| Param | Original file | Final file |
|---|---|---|
| Filename | modeM0/AS1T03_200T01_9000003654cztM0_level2.fits | modeM0/AS1T03_200T01_9000003654cztM0_level2_quad_clean.evt |
| Size (bytes) | 1,776,493,440 | 2,296,641,600 |
| Size | 1.7 GB | 2.1 GB |
| Events in quadrant A | 11,032,020 | 15,054,535 |
| Events in quadrant B | 10,546,952 | 15,059,946 |
| Events in quadrant C | 10,589,806 | 14,175,601 |
| Events in quadrant D | 9,129,440 | 12,772,911 |
| Mode M9 | |||
|---|---|---|---|
| Quadrant | BADHDUFLAG | Total packets | Discarded packets |
| A | 0 | 313 | 0 |
| B | 0 | 313 | 0 |
| C | 0 | 313 | 0 |
| D | 0 | 313 | 0 |
| Mode SS | |||
|---|---|---|---|
| Quadrant | BADHDUFLAG | Total packets | Discarded packets |
| A | 0 | 3716 | 0 |
| B | 0 | 3716 | 0 |
| C | 0 | 3716 | 0 |
| D | 0 | 3716 | 0 |
| Mode M0 | |||
|---|---|---|---|
| Quadrant | BADHDUFLAG | Total packets | Discarded packets |
| A | 0 | 375712 | 0 |
| B | 0 | 402231 | 0 |
| C | 0 | 423925 | 0 |
| D | 0 | 492243 | 0 |
| Quadrant | Total seconds | Saturated seconds | Saturation percentage |
|---|---|---|---|
| A | 182474 | 1843 | 1.010007% |
| B | 182475 | 3556 | 1.948760% |
| C | 182475 | 4299 | 2.355939% |
| D | 182475 | 7312 | 4.007124% |
Noise dominated data is calculated using 1-second bins in cleaned event files. If a bin has >2000 counts, and if more than 50% of those come from <1% of pixels, then it is considered to be noise-dominated and hence unusable.
| Quadrant | # 1 sec bins | Bins with >0 counts | Bins with >2000 counts | High rate bins dominated by noise | Noise dominated (total time) | Noise dominated (detector-on time) | Marked lightcurve |
|---|---|---|---|---|---|---|---|
| A | 213856 | 182476 | 0 | 0 | 0.00% | 0.00% |  |
| B | 213856 | 182459 | 0 | 0 | 0.00% | 0.00% |  |
| C | 213856 | 182473 | 0 | 0 | 0.00% | 0.00% | 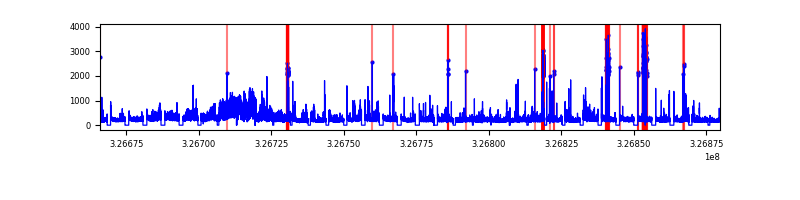 |
| D | 213856 | 182413 | 0 | 0 | 0.00% | 0.00% |  |
Top three noisy pixels from each quadrant. If the there are fewer than three noisy pixels in the level2.evt file, extra rows are filled as -1
| Pixel properties | Quadrant properties | ||||||
|---|---|---|---|---|---|---|---|
| Quadrant | DetID | PixID | Counts | Sigma | Mean | Median | Sigma |
| A | 0 | 29 | 10920 | 11.63 | 2879 | 2722 | 705.1 |
| A | 7 | 110 | 8905 | 8.77 | 2879 | 2722 | 705.1 |
| A | 0 | 30 | 8507 | 8.2 | 2879 | 2722 | 705.1 |
| B | 2 | 9 | 8392 | 10.64 | 2801 | 2691 | 535.9 |
| B | 14 | 254 | 7012 | 8.06 | 2801 | 2691 | 535.9 |
| B | 2 | 8 | 6995 | 8.03 | 2801 | 2691 | 535.9 |
| C | 12 | 241 | 7387 | 6.72 | 2802 | 2635 | 706.6 |
| C | 3 | 126 | 7069 | 6.27 | 2802 | 2635 | 706.6 |
| C | 2 | 191 | 7053 | 6.25 | 2802 | 2635 | 706.6 |
| D | 6 | 231 | 6569 | 6.09 | 2611 | 2378 | 688.6 |
| D | 15 | 46 | 6494 | 5.98 | 2611 | 2378 | 688.6 |
| D | 6 | 67 | 6443 | 5.9 | 2611 | 2378 | 688.6 |
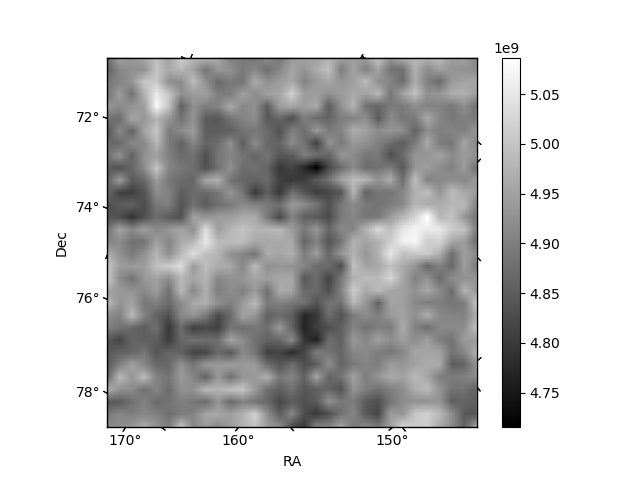
Histogram calculated using DETX and DETY for each event in the final _common_clean file
| Quadrant A |  |
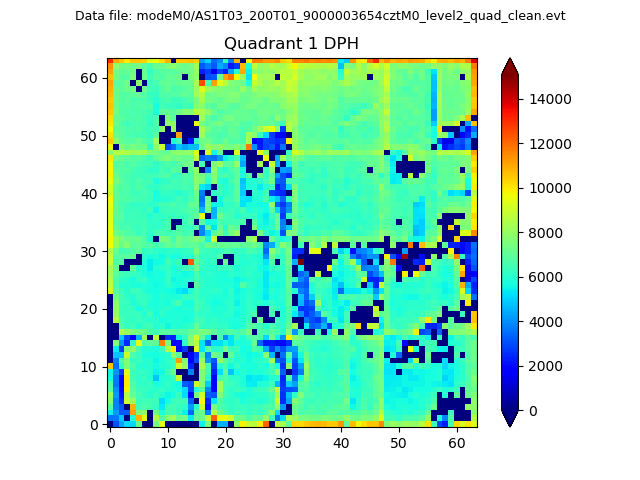 |
Quadrant B |
|---|---|---|---|
| Quadrant D | 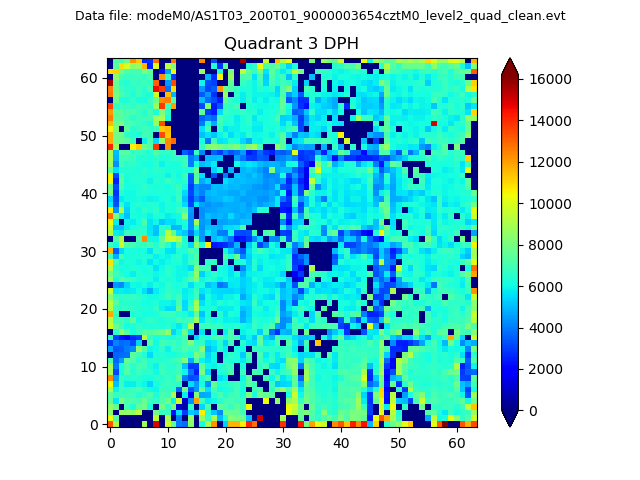 |
 |
Quadrant C |
| Plot type | Count rate plots | Images |
|---|---|---|
| Comparison with Poisson distribution Blue bars denote a histogram of data divided into 1 sec bins. Red curve is a Poisson curve with rate = median count rate of data. |
 |
 |
| Quadrant-wise count rates Data is divided into 100 sec bins |
 |
|
| Module-wise count rates for Quadrant A Data is divided into 100 sec bins |
 |
 |
| Module-wise count rates for Quadrant B Data is divided into 100 sec bins |
 |
 |
| Module-wise count rates for Quadrant C Data is divided into 100 sec bins |
 |
 |
| Module-wise count rates for Quadrant D Data is divided into 100 sec bins |
 |
 |
| Parameter | Plot |
|---|---|
| CZT HV Monitor |  |
| D_VDD |  |
| Temperature 1 |  |
| Veto HV Monitor |  |
| Veto LLD | 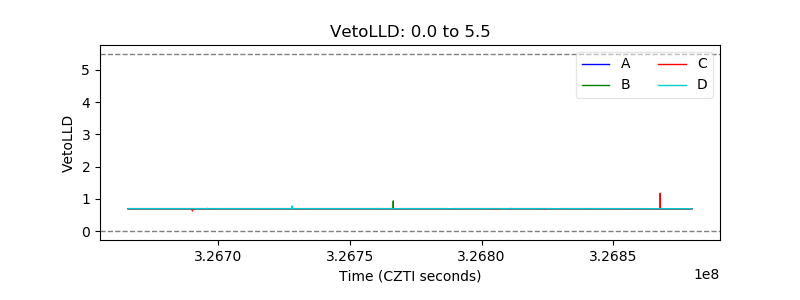 |
| Alpha Counter |  |
| _CPM_Rate | 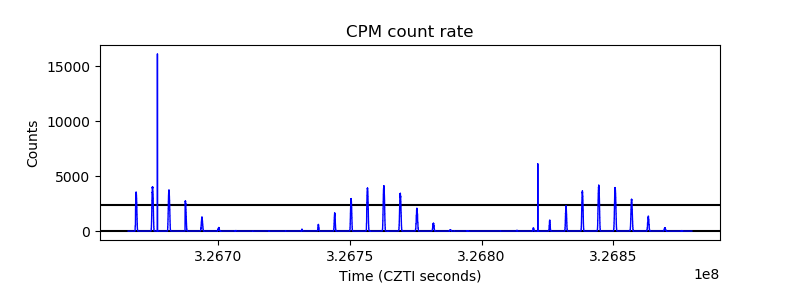 |
| CZT Counter |  |
| +2.5 Volts monitor |  |
| +5 Volts monitor |  |
| _ROLL_ROT |  |
| _Roll_DEC |  |
| _Roll_RA | 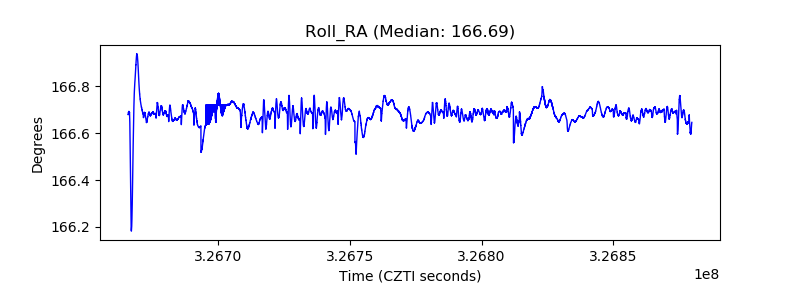 |
| Veto Counter | 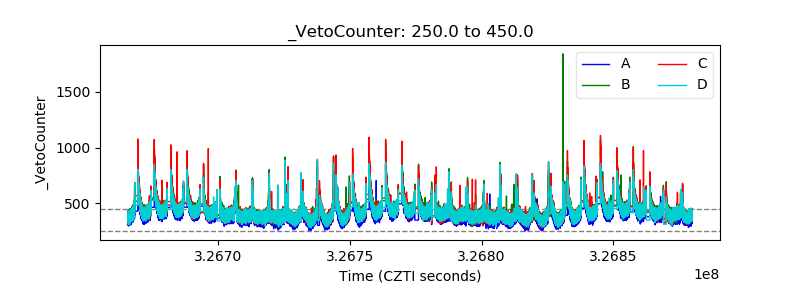 |