| Param | Original file | Final file |
|---|---|---|
| Filename | modeM0/AS1T03_200T01_9000003654_24937cztM0_level2.evt | modeM0/AS1T03_200T01_9000003654_24937cztM0_level2_quad_clean.evt |
| Size (bytes) | 255,588,480 | 76,086,720 |
| Size | 243.7 MB | 72.6 MB |
| Events in quadrant A | 1,794,224 | 515,857 |
| Events in quadrant B | 1,984,112 | 526,953 |
| Events in quadrant C | 1,849,974 | 506,763 |
| Events in quadrant D | 1,860,284 | 494,091 |
| Mode M9 | |||
|---|---|---|---|
| Quadrant | BADHDUFLAG | Total packets | Discarded packets |
| A | 0 | 11 | 0 |
| B | 0 | 11 | 0 |
| C | 0 | 11 | 0 |
| D | 0 | 11 | 0 |
| Mode SS | |||
|---|---|---|---|
| Quadrant | BADHDUFLAG | Total packets | Discarded packets |
| A | 0 | 76 | 0 |
| B | 0 | 76 | 0 |
| C | 0 | 76 | 0 |
| D | 0 | 76 | 0 |
| Mode M0 | |||
|---|---|---|---|
| Quadrant | BADHDUFLAG | Total packets | Discarded packets |
| A | 0 | 7682 | 1 |
| B | 0 | 8302 | 1 |
| C | 0 | 7916 | 1 |
| D | 0 | 8085 | 1 |
| Quadrant | Total seconds | Saturated seconds | Saturation percentage |
|---|---|---|---|
| A | 3682 | 13 | 0.353069% |
| B | 3682 | 67 | 1.819663% |
| C | 3682 | 33 | 0.896252% |
| D | 3682 | 11 | 0.298751% |
Noise dominated data is calculated using 1-second bins in cleaned event files. If a bin has >2000 counts, and if more than 50% of those come from <1% of pixels, then it is considered to be noise-dominated and hence unusable.
| Quadrant | # 1 sec bins | Bins with >0 counts | Bins with >2000 counts | High rate bins dominated by noise | Noise dominated (total time) | Noise dominated (detector-on time) | Marked lightcurve |
|---|---|---|---|---|---|---|---|
| A | 4852 | 3683 | 0 | 0 | 0.00% | 0.00% | 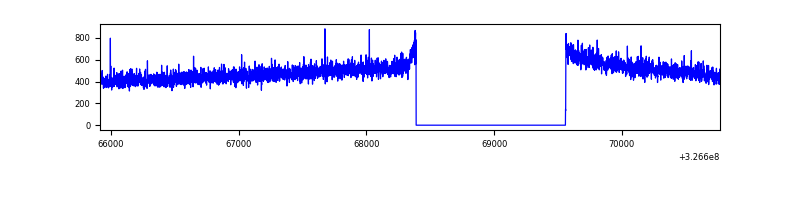 |
| B | 4852 | 3683 | 31 | 31 | 0.64% | 0.84% | 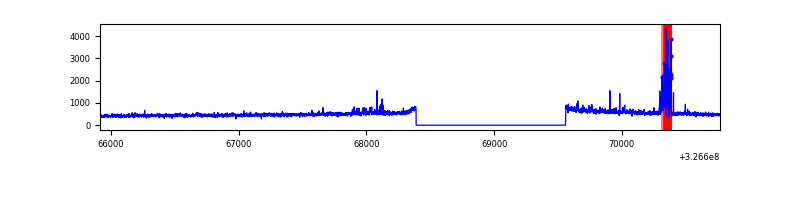 |
| C | 4852 | 3683 | 2 | 2 | 0.04% | 0.05% | 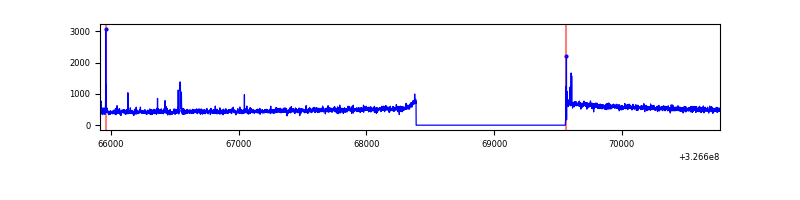 |
| D | 4852 | 3683 | 3 | 3 | 0.06% | 0.08% | 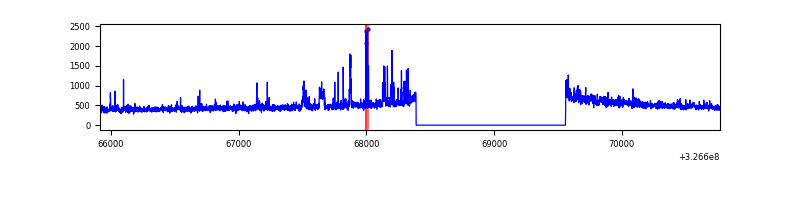 |
Top three noisy pixels from each quadrant. If the there are fewer than three noisy pixels in the level2.evt file, extra rows are filled as -1
| Pixel properties | Quadrant properties | ||||||
|---|---|---|---|---|---|---|---|
| Quadrant | DetID | PixID | Counts | Sigma | Mean | Median | Sigma |
| A | 13 | 254 | 5154 | 49.96 | 464 | 455 | 94.1 |
| A | 3 | 137 | 4164 | 39.43 | 464 | 455 | 94.1 |
| A | 0 | 226 | 4019 | 37.89 | 464 | 455 | 94.1 |
| B | 3 | 64 | 125007 | 1416.55 | 462 | 450 | 87.9 |
| B | 10 | 251 | 12857 | 141.1 | 462 | 450 | 87.9 |
| B | 7 | 202 | 12332 | 135.13 | 462 | 450 | 87.9 |
| C | 14 | 238 | 71308 | 678.62 | 446 | 449 | 104.4 |
| C | 2 | 16 | 23884 | 224.44 | 446 | 449 | 104.4 |
| C | 0 | 10 | 8412 | 76.26 | 446 | 449 | 104.4 |
| D | 1 | 52 | 86179 | 782.94 | 450 | 437 | 109.5 |
| D | 2 | 244 | 45140 | 408.2 | 450 | 437 | 109.5 |
| D | 8 | 195 | 27901 | 250.78 | 450 | 437 | 109.5 |
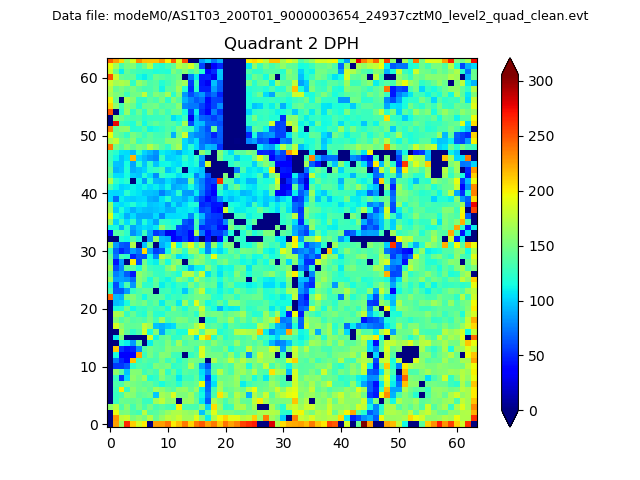
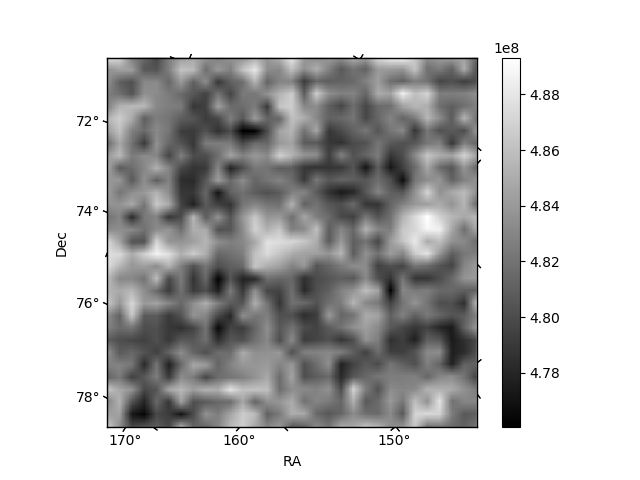
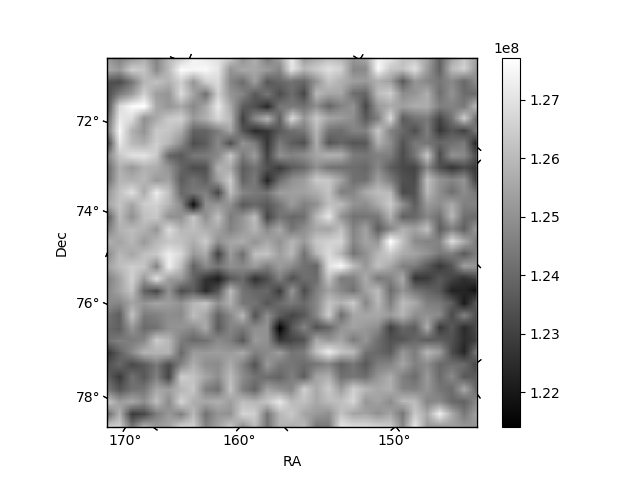
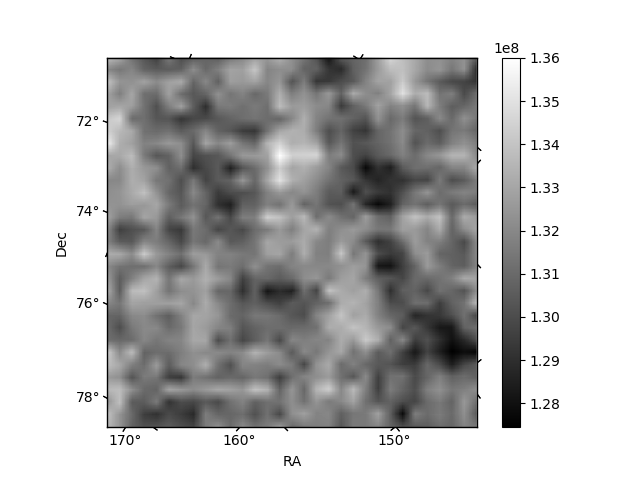
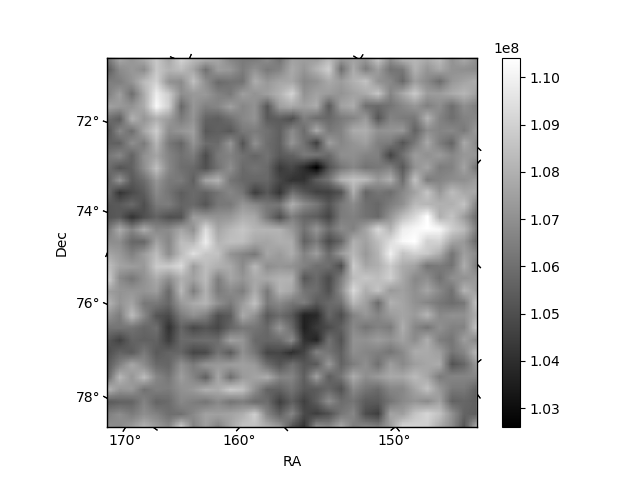
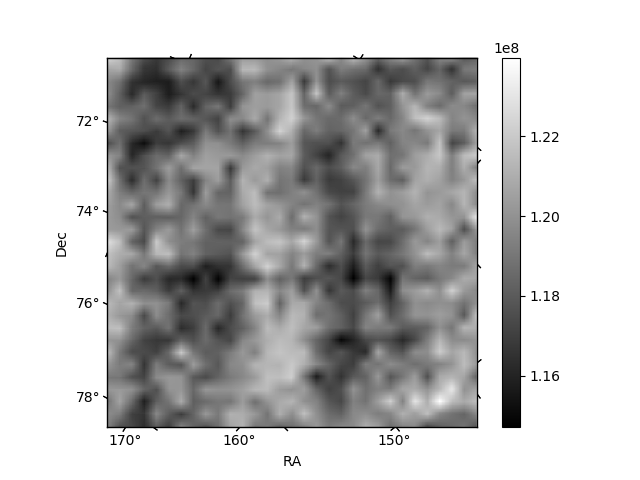
Histogram calculated using DETX and DETY for each event in the final _common_clean file
| Quadrant A | 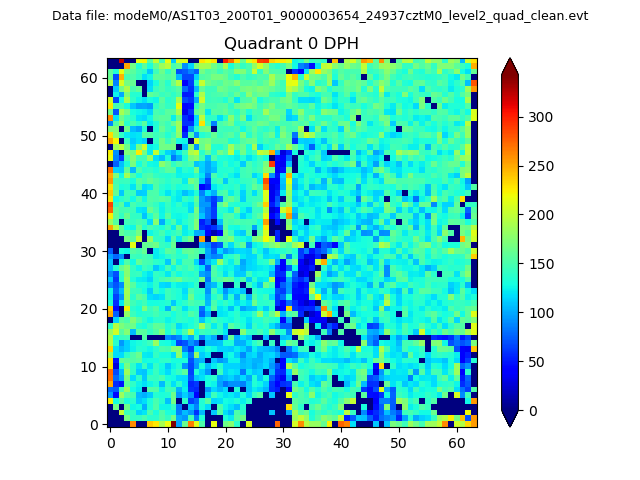 |
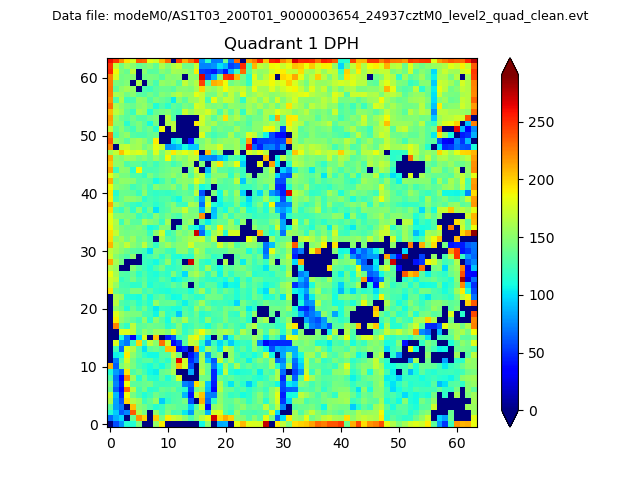 |
Quadrant B |
|---|---|---|---|
| Quadrant D | 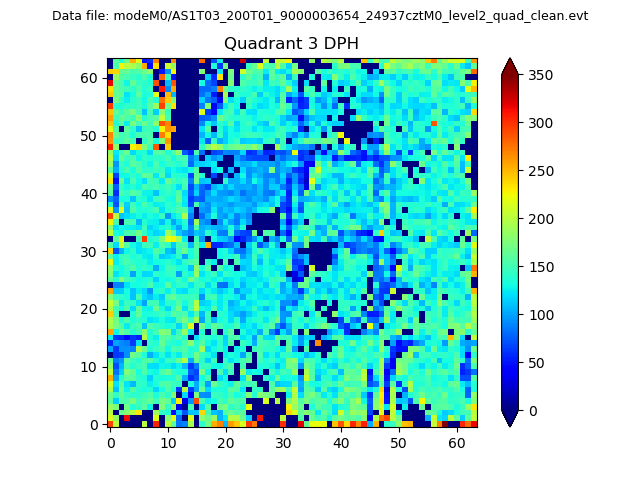 |
 |
Quadrant C |
| Plot type | Count rate plots | Images |
|---|---|---|
| Comparison with Poisson distribution Blue bars denote a histogram of data divided into 1 sec bins. Red curve is a Poisson curve with rate = median count rate of data. |
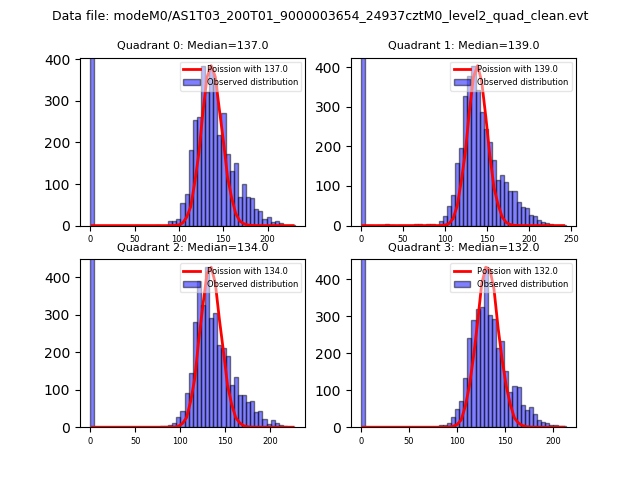 |
 |
| Quadrant-wise count rates Data is divided into 100 sec bins |
 |
|
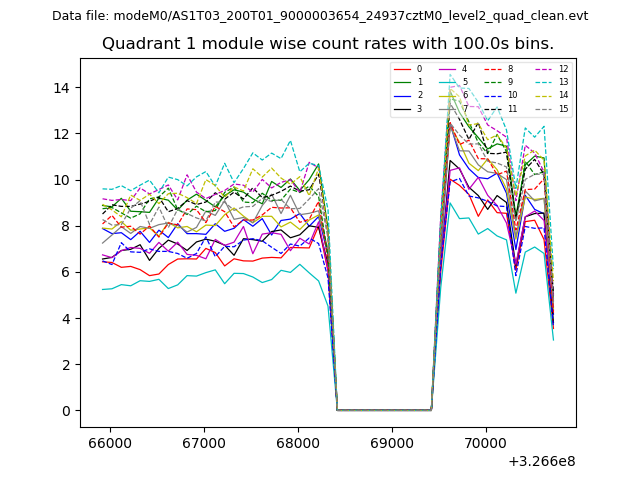
| Module-wise count rates for Quadrant A Data is divided into 100 sec bins |
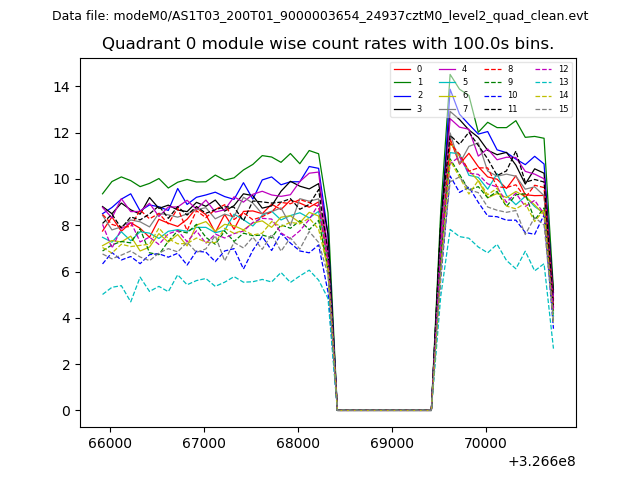 |
 |
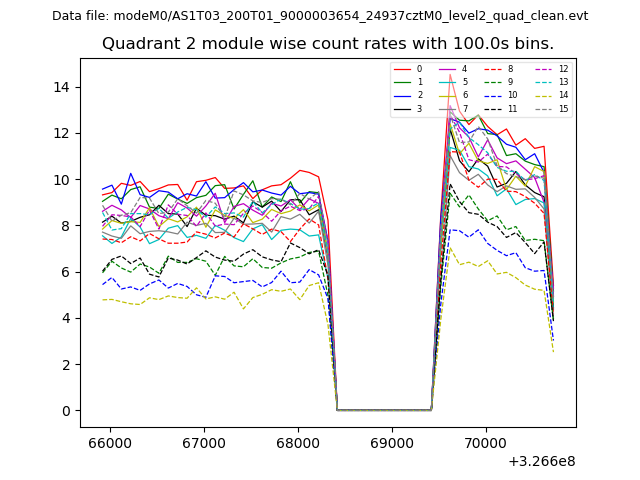
| Module-wise count rates for Quadrant B Data is divided into 100 sec bins |
 |
 |
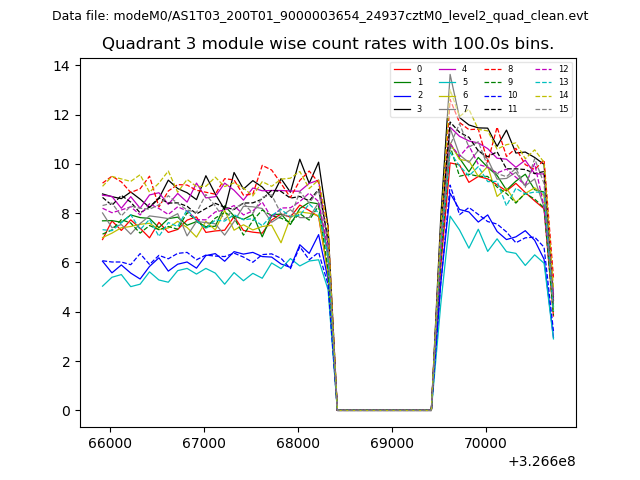
| Module-wise count rates for Quadrant C Data is divided into 100 sec bins |
 |
 |
| Module-wise count rates for Quadrant D Data is divided into 100 sec bins |
 |
 |
| Parameter | Plot |
|---|---|
| CZT HV Monitor | 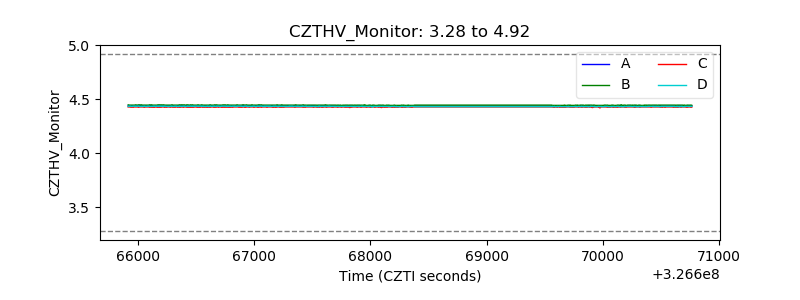 |
| D_VDD | 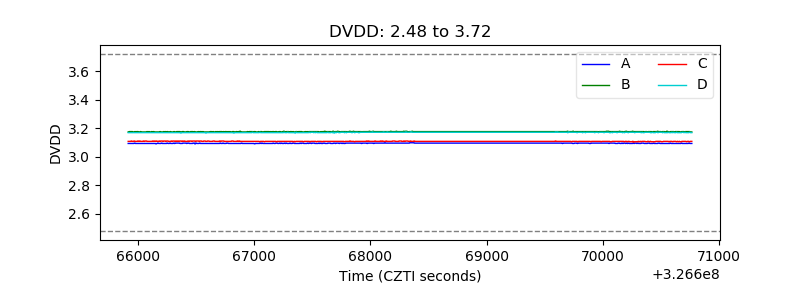 |
| Temperature 1 | 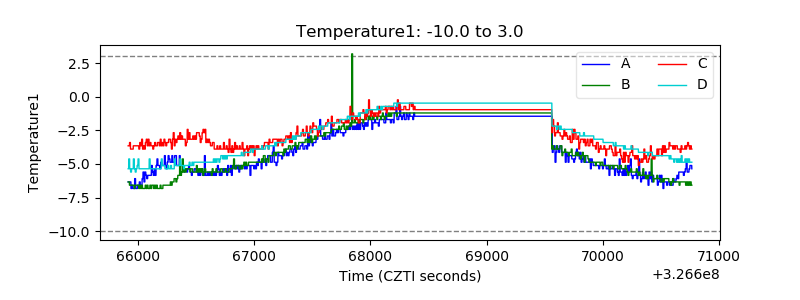 |
| Veto HV Monitor | 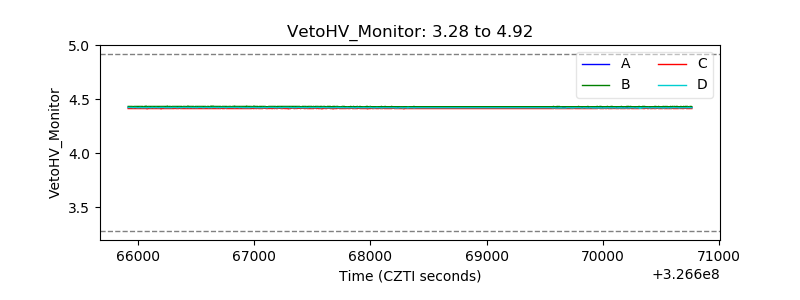 |
| Veto LLD | 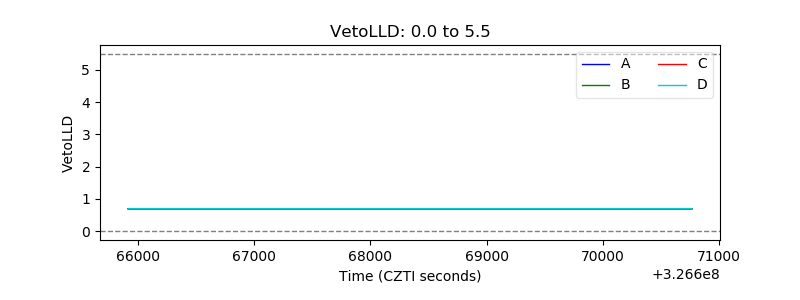 |
| Alpha Counter | 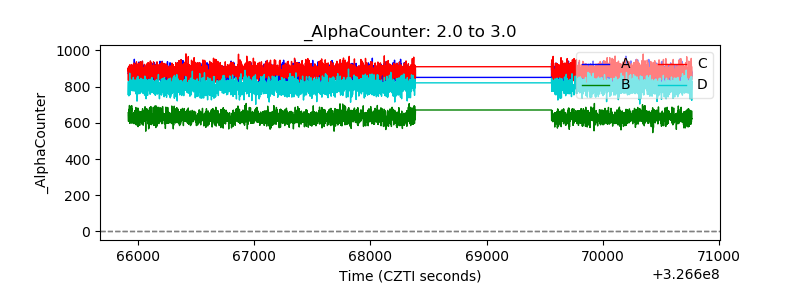 |
| _CPM_Rate | 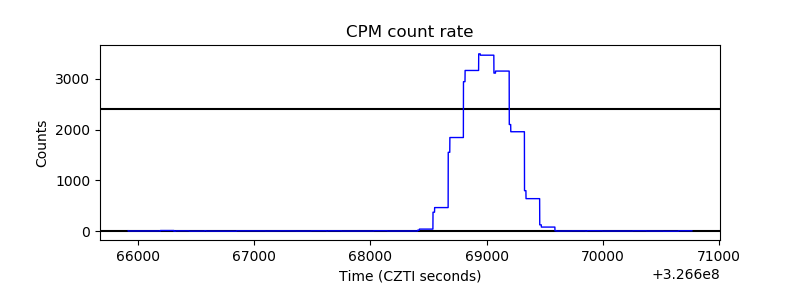 |
| CZT Counter | 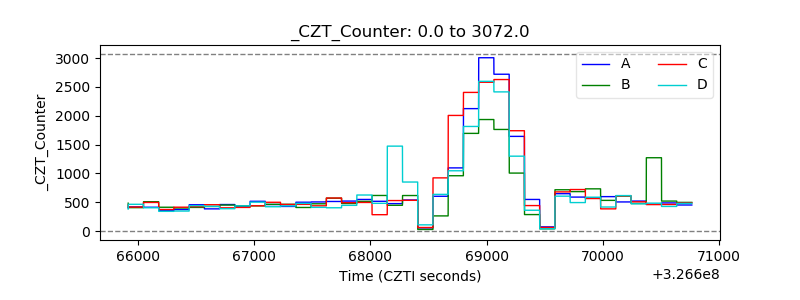 |
| +2.5 Volts monitor |  |
| +5 Volts monitor |  |
| _ROLL_ROT | 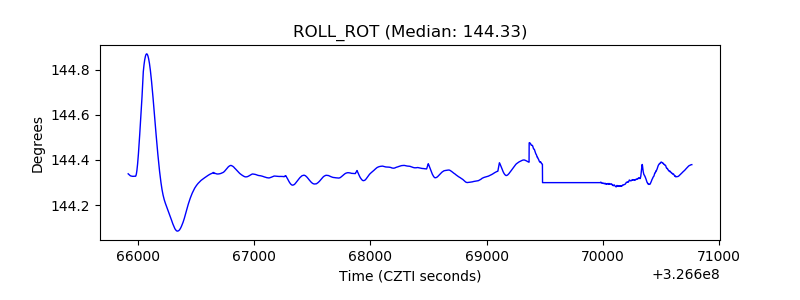 |
| _Roll_DEC | 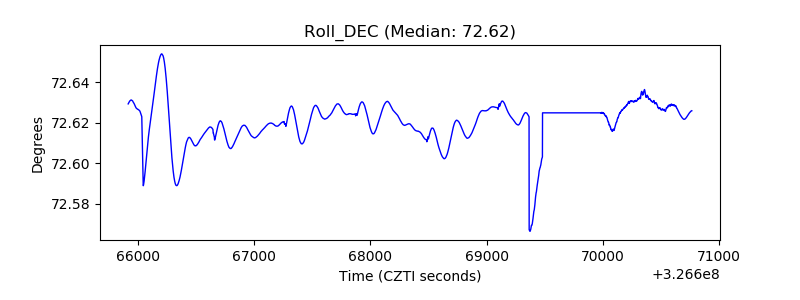 |
| _Roll_RA | 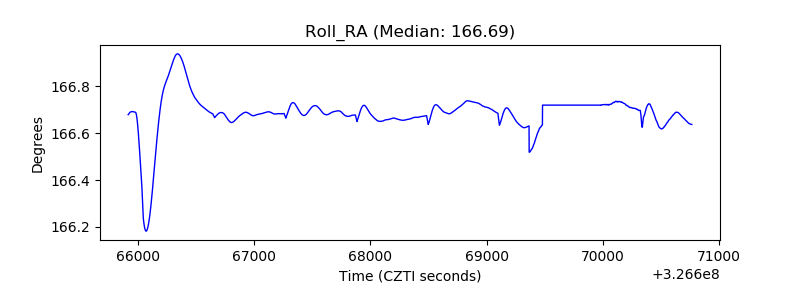 |
| Veto Counter | 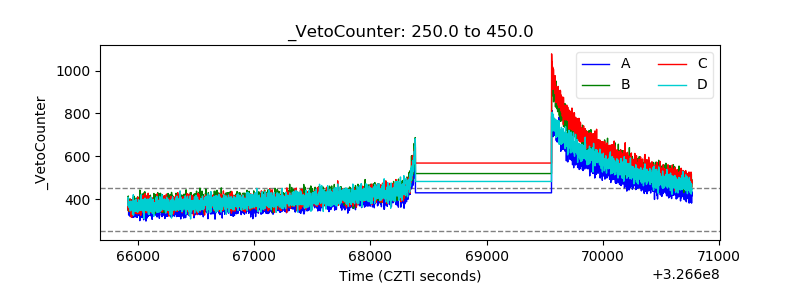 |