| Param | Original file | Final file |
|---|---|---|
| Filename | modeM0/AS1T03_200T01_9000003654_24939cztM0_level2.evt | modeM0/AS1T03_200T01_9000003654_24939cztM0_level2_quad_clean.evt |
| Size (bytes) | 464,192,640 | 140,094,720 |
| Size | 442.7 MB | 133.6 MB |
| Events in quadrant A | 3,304,540 | 957,709 |
| Events in quadrant B | 3,417,104 | 996,008 |
| Events in quadrant C | 3,376,137 | 939,300 |
| Events in quadrant D | 3,524,091 | 902,471 |
| Mode M9 | |||
|---|---|---|---|
| Quadrant | BADHDUFLAG | Total packets | Discarded packets |
| A | 0 | 21 | 0 |
| B | 0 | 22 | 0 |
| C | 0 | 22 | 0 |
| D | 0 | 22 | 0 |
| Mode SS | |||
|---|---|---|---|
| Quadrant | BADHDUFLAG | Total packets | Discarded packets |
| A | 0 | 132 | 0 |
| B | 0 | 132 | 0 |
| C | 0 | 132 | 0 |
| D | 0 | 132 | 0 |
| Mode M0 | |||
|---|---|---|---|
| Quadrant | BADHDUFLAG | Total packets | Discarded packets |
| A | 0 | 13844 | 2 |
| B | 0 | 14235 | 2 |
| C | 0 | 13983 | 2 |
| D | 0 | 14782 | 2 |
| Quadrant | Total seconds | Saturated seconds | Saturation percentage |
|---|---|---|---|
| A | 6418 | 90 | 1.402306% |
| B | 6418 | 45 | 0.701153% |
| C | 6418 | 70 | 1.090682% |
| D | 6418 | 39 | 0.607666% |
Noise dominated data is calculated using 1-second bins in cleaned event files. If a bin has >2000 counts, and if more than 50% of those come from <1% of pixels, then it is considered to be noise-dominated and hence unusable.
| Quadrant | # 1 sec bins | Bins with >0 counts | Bins with >2000 counts | High rate bins dominated by noise | Noise dominated (total time) | Noise dominated (detector-on time) | Marked lightcurve |
|---|---|---|---|---|---|---|---|
| A | 7783 | 6419 | 53 | 53 | 0.68% | 0.83% | 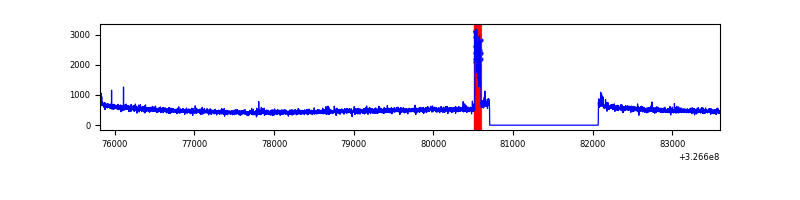 |
| B | 7783 | 6419 | 9 | 9 | 0.12% | 0.14% | 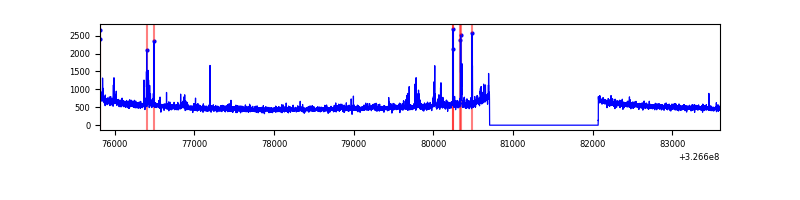 |
| C | 7783 | 6419 | 0 | 0 | 0.00% | 0.00% | 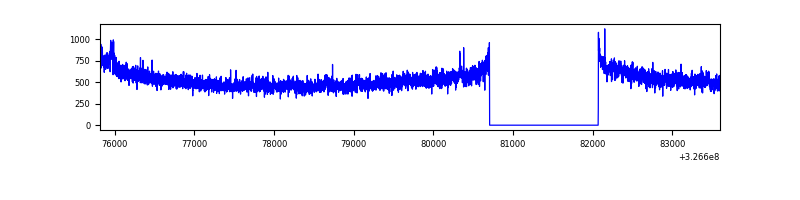 |
| D | 7783 | 6419 | 29 | 29 | 0.37% | 0.45% | 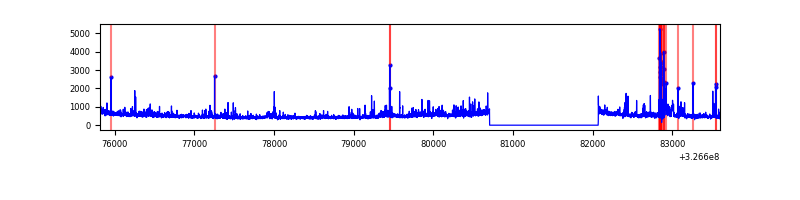 |
Top three noisy pixels from each quadrant. If the there are fewer than three noisy pixels in the level2.evt file, extra rows are filled as -1
| Pixel properties | Quadrant properties | ||||||
|---|---|---|---|---|---|---|---|
| Quadrant | DetID | PixID | Counts | Sigma | Mean | Median | Sigma |
| A | 4 | 2 | 150133 | 932.6 | 811 | 798 | 160.1 |
| A | 6 | 16 | 19658 | 117.78 | 811 | 798 | 160.1 |
| A | 13 | 254 | 9414 | 53.81 | 811 | 798 | 160.1 |
| B | 3 | 64 | 74916 | 493.18 | 824 | 808 | 150.3 |
| B | 0 | 230 | 46396 | 303.39 | 824 | 808 | 150.3 |
| B | 7 | 202 | 21439 | 137.3 | 824 | 808 | 150.3 |
| C | 7 | 247 | 162799 | 889.71 | 790 | 796 | 182.1 |
| C | 14 | 238 | 131076 | 715.49 | 790 | 796 | 182.1 |
| C | 13 | 61 | 5480 | 25.72 | 790 | 796 | 182.1 |
| D | 1 | 52 | 184523 | 973.6 | 786 | 763 | 188.7 |
| D | 8 | 195 | 141671 | 746.56 | 786 | 763 | 188.7 |
| D | 1 | 239 | 123260 | 649.02 | 786 | 763 | 188.7 |
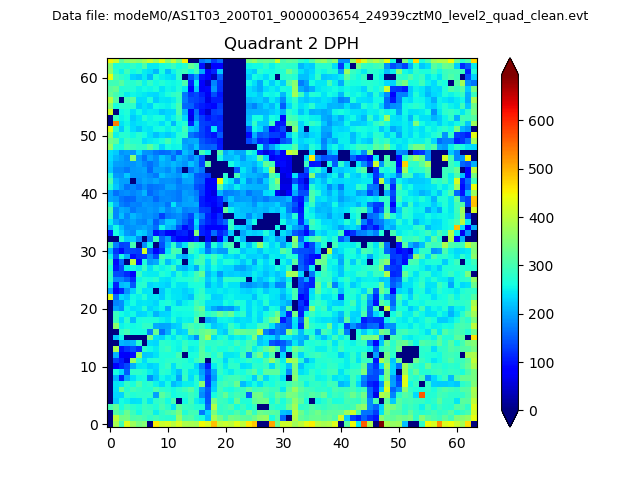
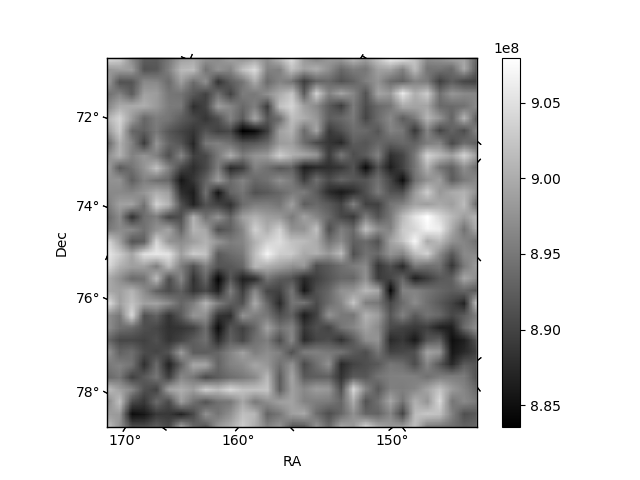
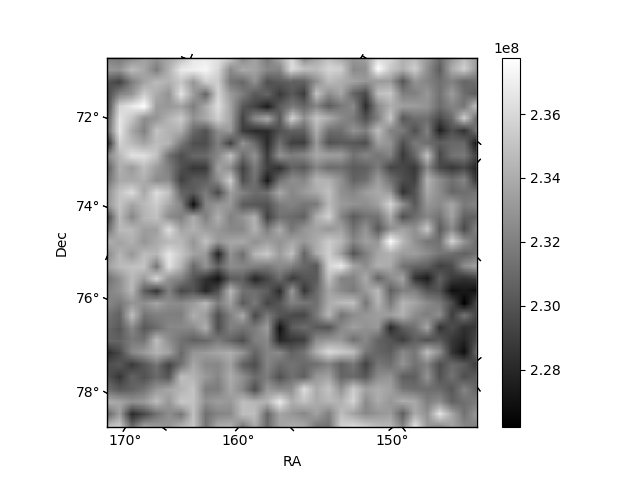
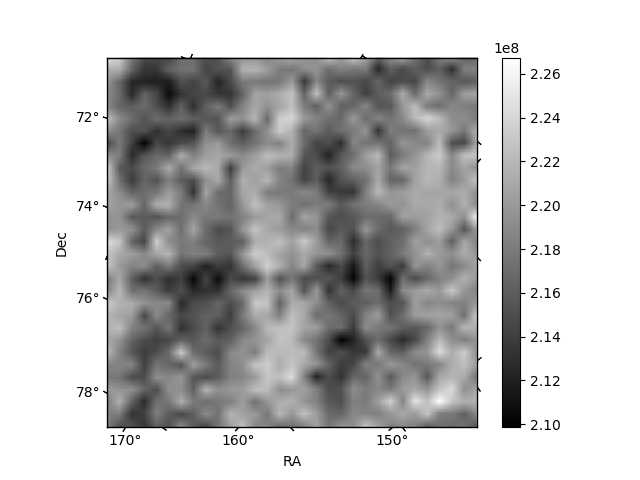
Histogram calculated using DETX and DETY for each event in the final _common_clean file
| Quadrant A | 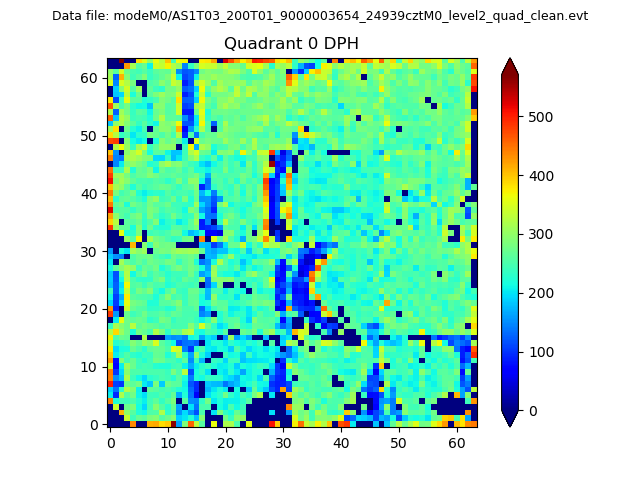 |
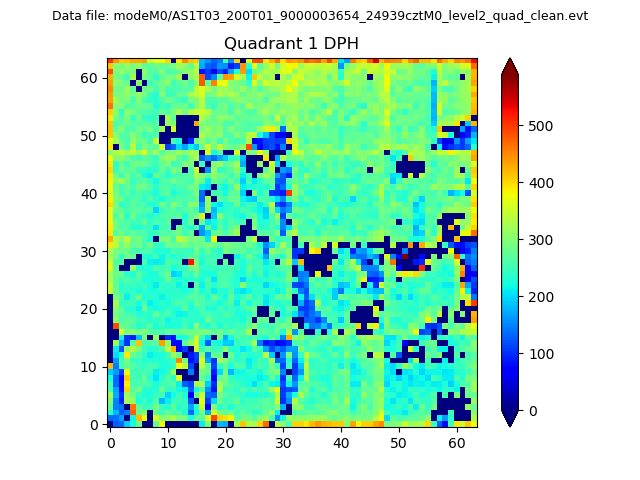 |
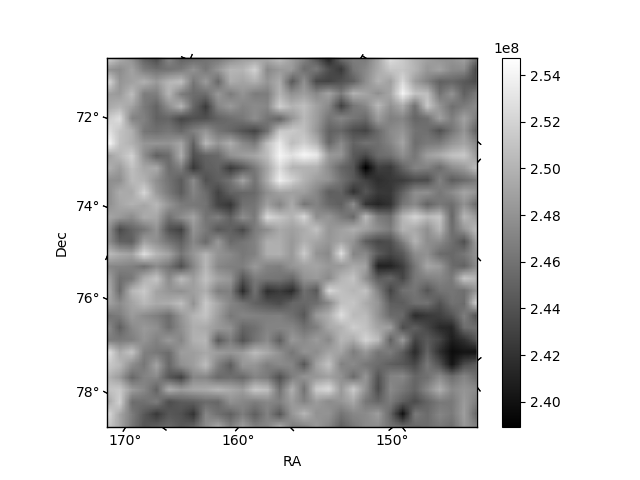
Quadrant B |
|---|---|---|---|
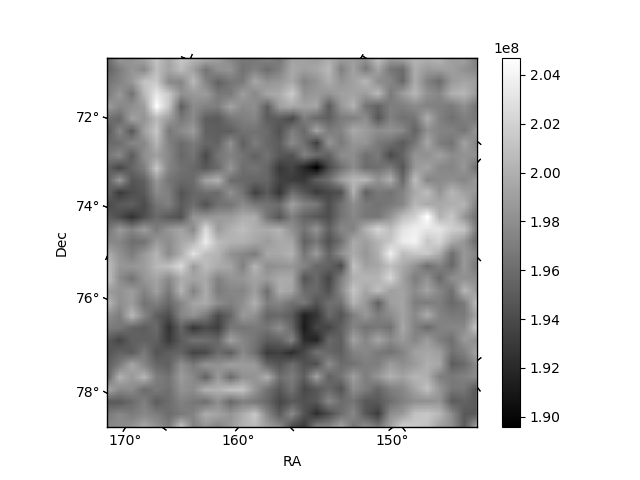
| Quadrant D | 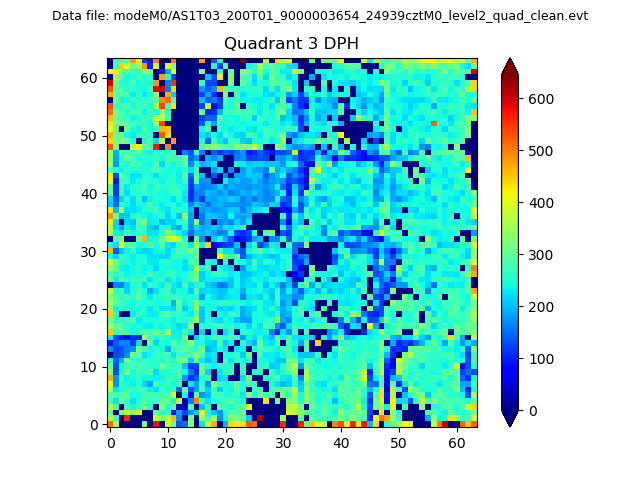 |
 |
Quadrant C |
| Plot type | Count rate plots | Images |
|---|---|---|
| Comparison with Poisson distribution Blue bars denote a histogram of data divided into 1 sec bins. Red curve is a Poisson curve with rate = median count rate of data. |
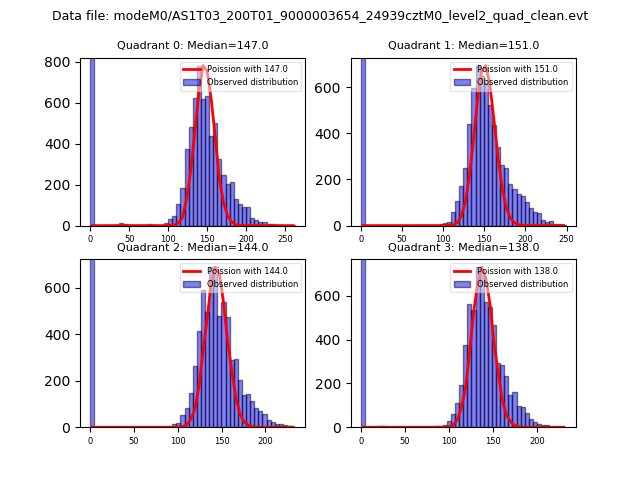 |
 |
| Quadrant-wise count rates Data is divided into 100 sec bins |
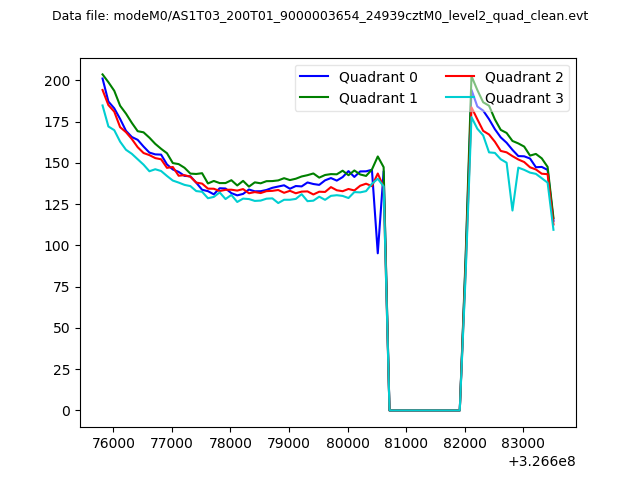 |
|
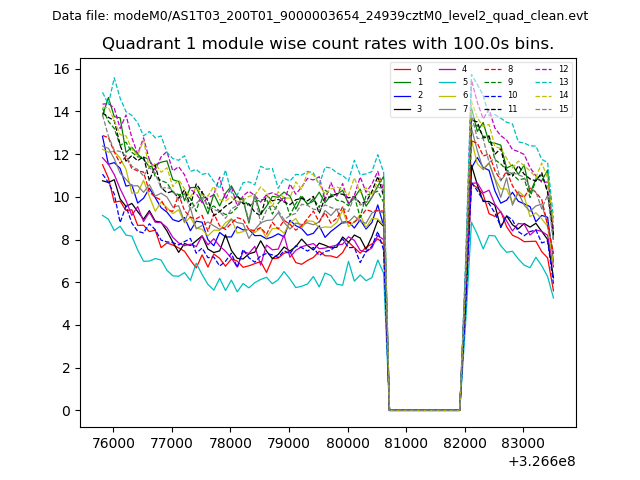
| Module-wise count rates for Quadrant A Data is divided into 100 sec bins |
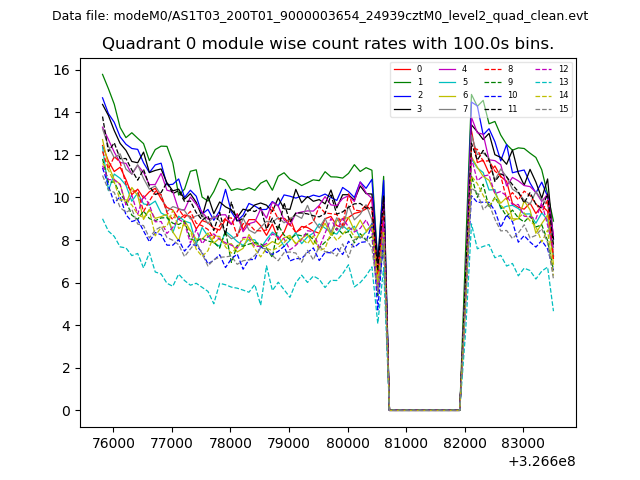 |
 |
| Module-wise count rates for Quadrant B Data is divided into 100 sec bins |
 |
 |
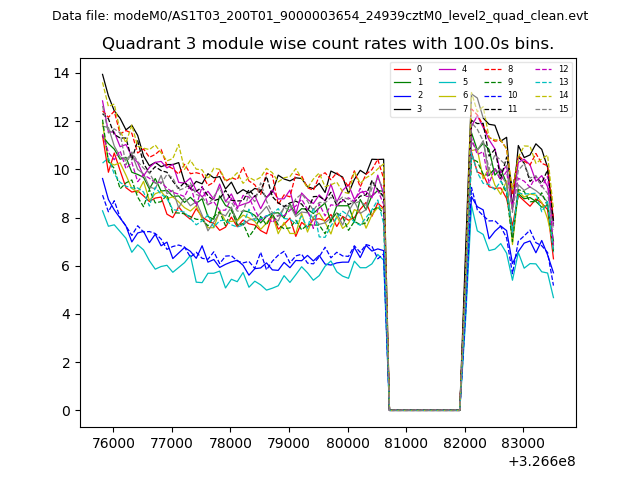
| Module-wise count rates for Quadrant C Data is divided into 100 sec bins |
 |
 |
| Module-wise count rates for Quadrant D Data is divided into 100 sec bins |
 |
 |
| Parameter | Plot |
|---|---|
| CZT HV Monitor |  |
| D_VDD | 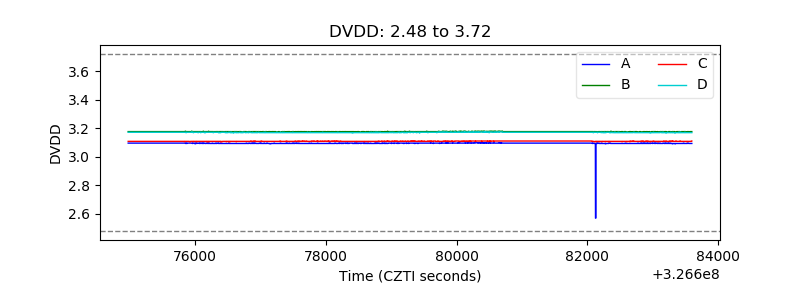 |
| Temperature 1 | 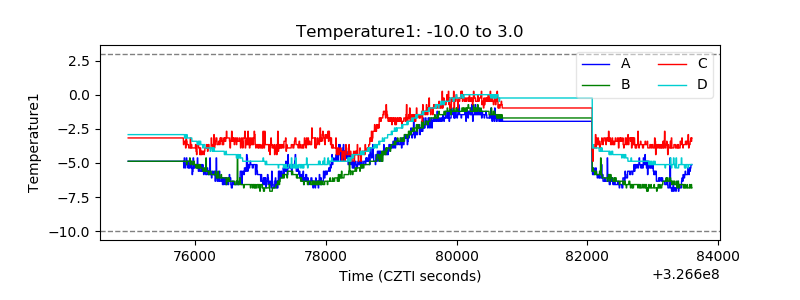 |
| Veto HV Monitor | 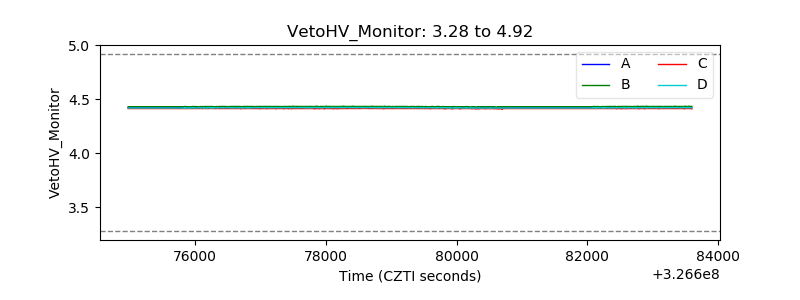 |
| Veto LLD | 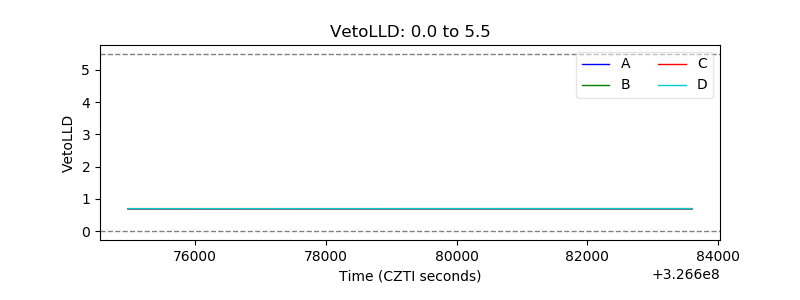 |
| Alpha Counter | 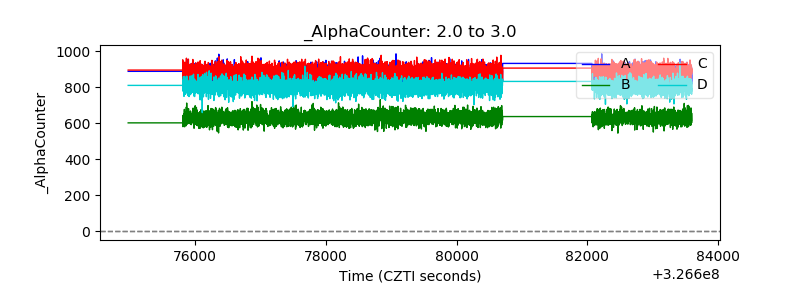 |
| _CPM_Rate | 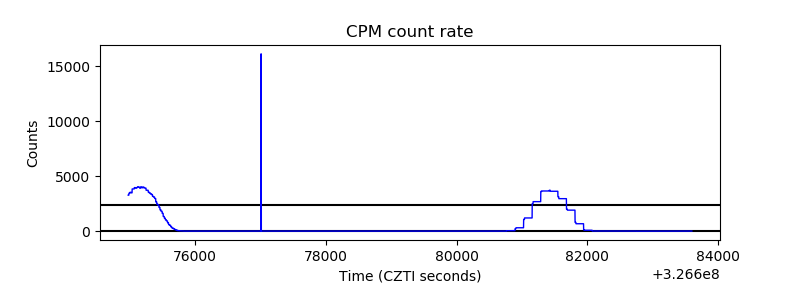 |
| CZT Counter | 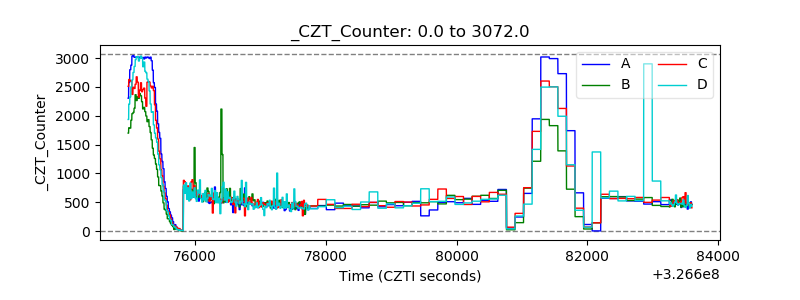 |
| +2.5 Volts monitor |  |
| +5 Volts monitor |  |
| _ROLL_ROT | 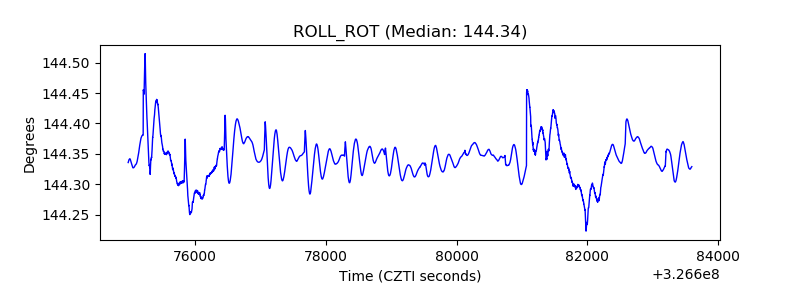 |
| _Roll_DEC | 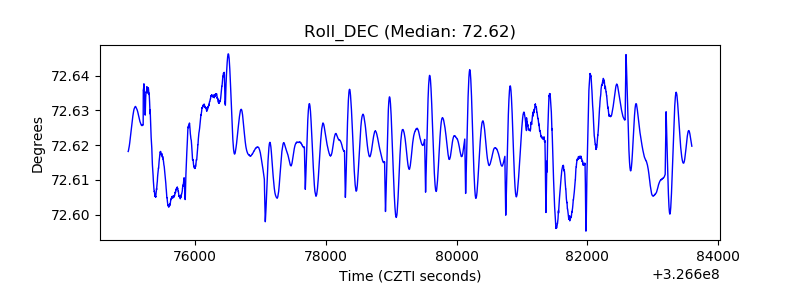 |
| _Roll_RA | 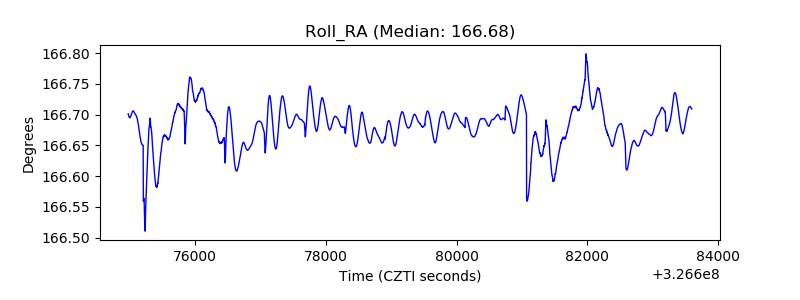 |
| Veto Counter | 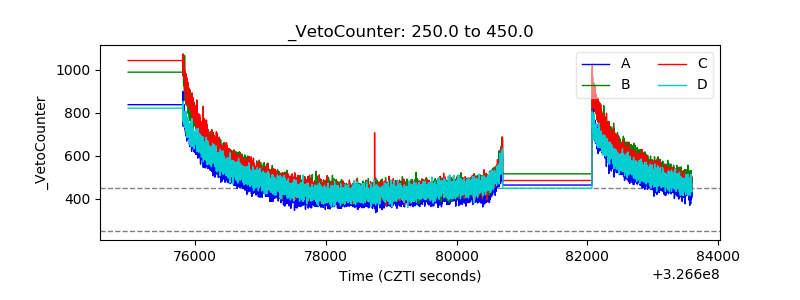 |