| Param | Original file | Final file |
|---|---|---|
| Filename | modeM0/AS1T03_200T01_9000003654_24942cztM0_level2.evt | modeM0/AS1T03_200T01_9000003654_24942cztM0_level2_quad_clean.evt |
| Size (bytes) | 564,955,200 | 121,158,720 |
| Size | 538.8 MB | 115.5 MB |
| Events in quadrant A | 2,950,095 | 848,140 |
| Events in quadrant B | 3,093,788 | 862,240 |
| Events in quadrant C | 3,818,552 | 805,512 |
| Events in quadrant D | 6,826,701 | 720,243 |
| Mode M9 | |||
|---|---|---|---|
| Quadrant | BADHDUFLAG | Total packets | Discarded packets |
| A | 0 | 11 | 0 |
| B | 0 | 11 | 0 |
| C | 0 | 11 | 0 |
| D | 0 | 11 | 0 |
| Mode SS | |||
|---|---|---|---|
| Quadrant | BADHDUFLAG | Total packets | Discarded packets |
| A | 0 | 126 | 0 |
| B | 0 | 126 | 0 |
| C | 0 | 126 | 0 |
| D | 0 | 126 | 0 |
| Mode M0 | |||
|---|---|---|---|
| Quadrant | BADHDUFLAG | Total packets | Discarded packets |
| A | 0 | 12669 | 1 |
| B | 0 | 13003 | 1 |
| C | 0 | 15752 | 1 |
| D | 0 | 24510 | 1 |
| Quadrant | Total seconds | Saturated seconds | Saturation percentage |
|---|---|---|---|
| A | 6203 | 27 | 0.435273% |
| B | 6203 | 42 | 0.677092% |
| C | 6203 | 94 | 1.515396% |
| D | 6204 | 1414 | 22.791747% |
Noise dominated data is calculated using 1-second bins in cleaned event files. If a bin has >2000 counts, and if more than 50% of those come from <1% of pixels, then it is considered to be noise-dominated and hence unusable.
| Quadrant | # 1 sec bins | Bins with >0 counts | Bins with >2000 counts | High rate bins dominated by noise | Noise dominated (total time) | Noise dominated (detector-on time) | Marked lightcurve |
|---|---|---|---|---|---|---|---|
| A | 7284 | 6204 | 1 | 1 | 0.01% | 0.02% |  |
| B | 7284 | 6204 | 1 | 1 | 0.01% | 0.02% |  |
| C | 7284 | 6204 | 10 | 10 | 0.14% | 0.16% |  |
| D | 7285 | 6205 | 1344 | 1344 | 18.45% | 21.66% | 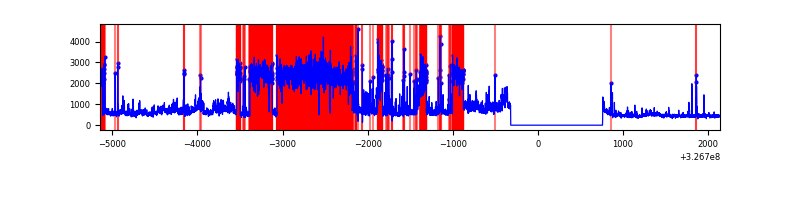 |
Top three noisy pixels from each quadrant. If the there are fewer than three noisy pixels in the level2.evt file, extra rows are filled as -1
| Pixel properties | Quadrant properties | ||||||
|---|---|---|---|---|---|---|---|
| Quadrant | DetID | PixID | Counts | Sigma | Mean | Median | Sigma |
| A | 15 | 223 | 20068 | 128.18 | 755 | 740 | 150.8 |
| A | 13 | 254 | 9675 | 59.26 | 755 | 740 | 150.8 |
| A | 4 | 2 | 9095 | 55.41 | 755 | 740 | 150.8 |
| B | 10 | 251 | 34106 | 236.46 | 750 | 733 | 141.1 |
| B | 0 | 190 | 32430 | 224.58 | 750 | 733 | 141.1 |
| B | 0 | 229 | 29027 | 200.47 | 750 | 733 | 141.1 |
| C | 7 | 247 | 847971 | 5193.83 | 712 | 717 | 163.1 |
| C | 14 | 238 | 116586 | 710.3 | 712 | 717 | 163.1 |
| C | 0 | 207 | 72505 | 440.07 | 712 | 717 | 163.1 |
| D | 1 | 52 | 3652406 | 22706.43 | 673 | 654 | 160.8 |
| D | 7 | 238 | 293343 | 1819.93 | 673 | 654 | 160.8 |
| D | 1 | 3 | 80280 | 495.11 | 673 | 654 | 160.8 |
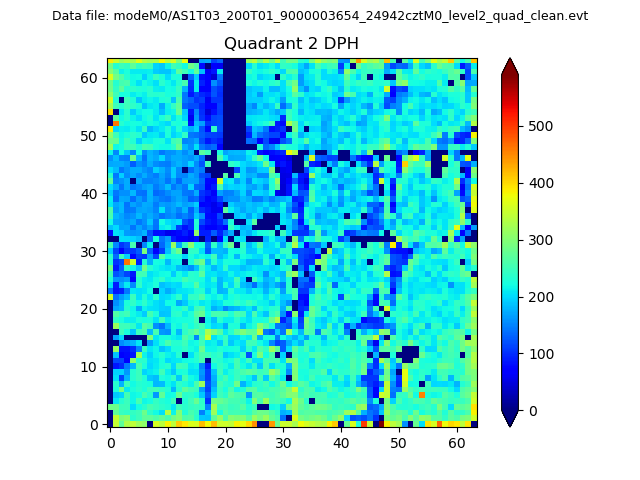
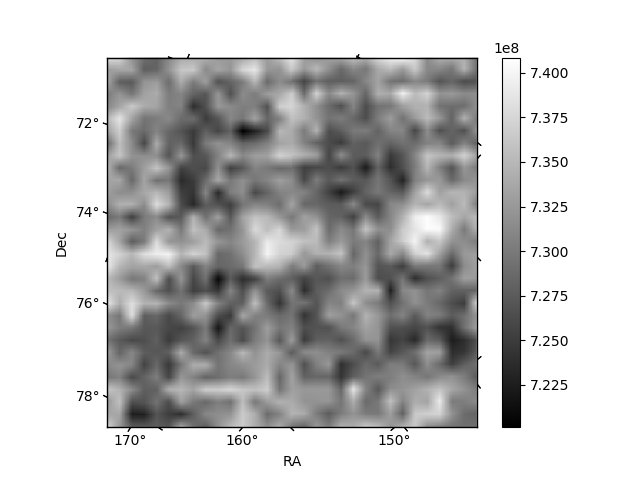
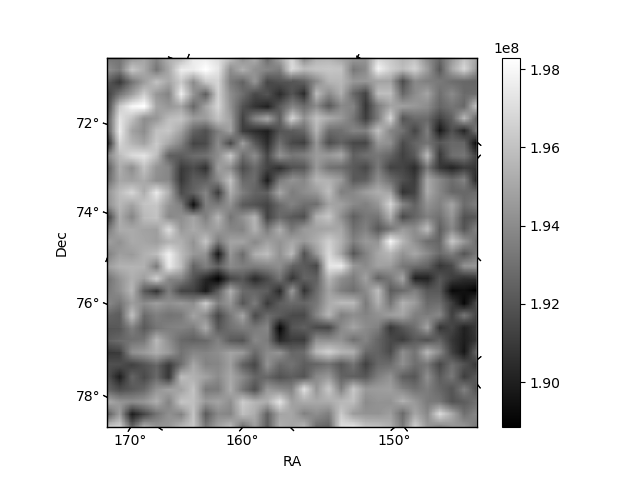
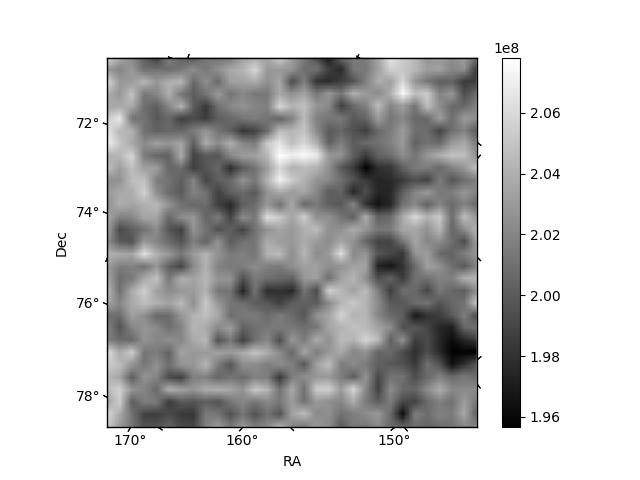
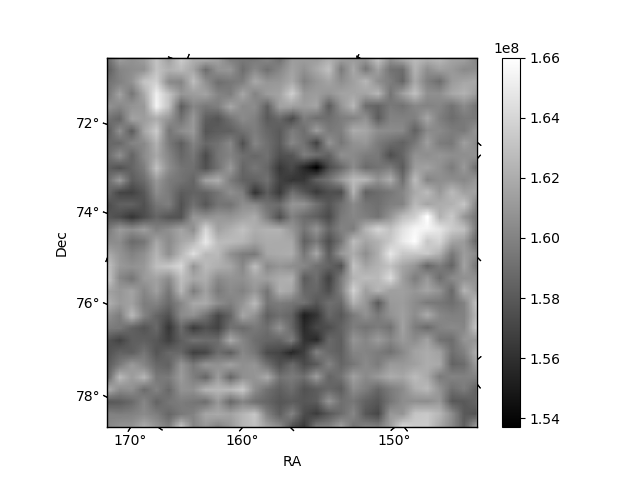
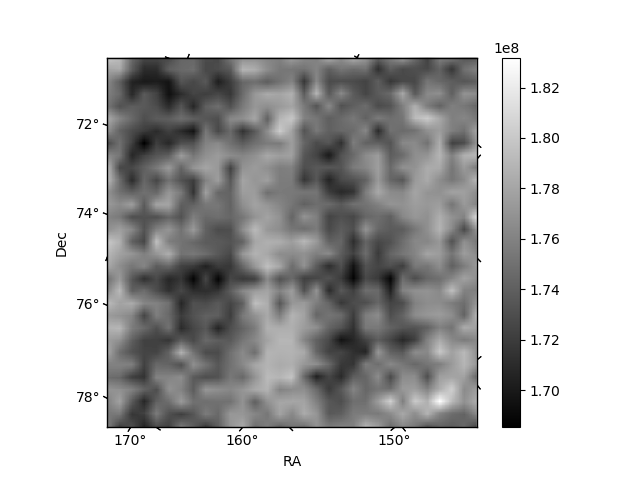
Histogram calculated using DETX and DETY for each event in the final _common_clean file
| Quadrant A | 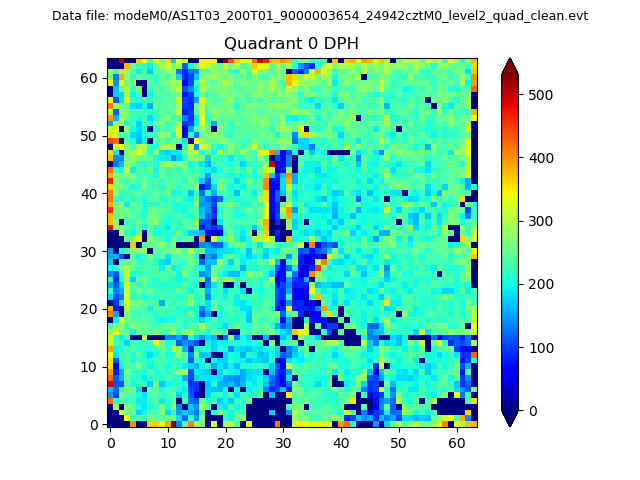 |
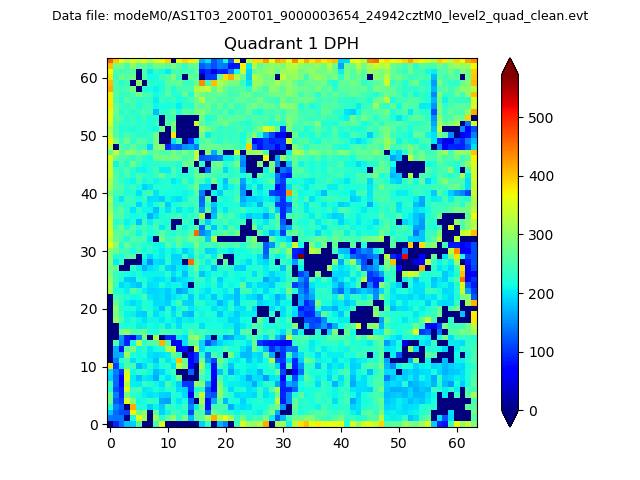 |
Quadrant B |
|---|---|---|---|
| Quadrant D | 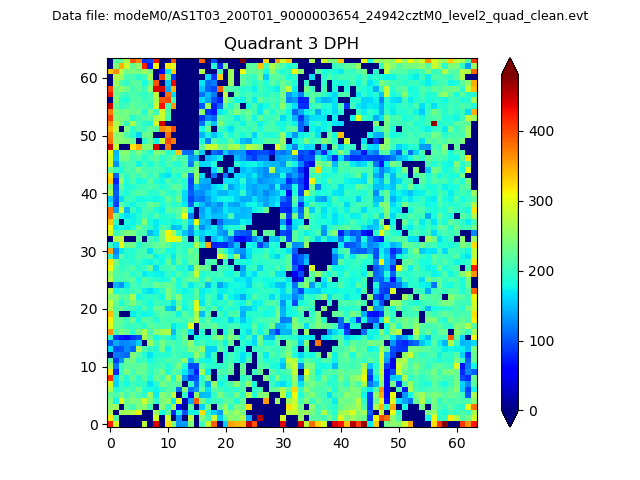 |
 |
Quadrant C |
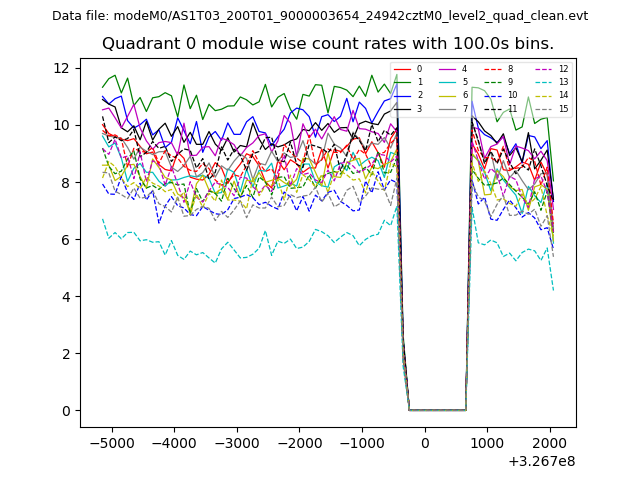
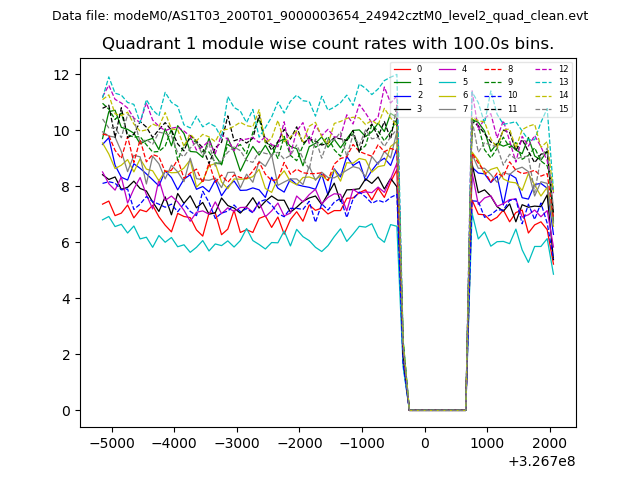
| Plot type | Count rate plots | Images |
|---|---|---|
| Comparison with Poisson distribution Blue bars denote a histogram of data divided into 1 sec bins. Red curve is a Poisson curve with rate = median count rate of data. |
 |
 |
| Quadrant-wise count rates Data is divided into 100 sec bins |
 |
|
| Module-wise count rates for Quadrant A Data is divided into 100 sec bins |
 |
 |
| Module-wise count rates for Quadrant B Data is divided into 100 sec bins |
 |
 |
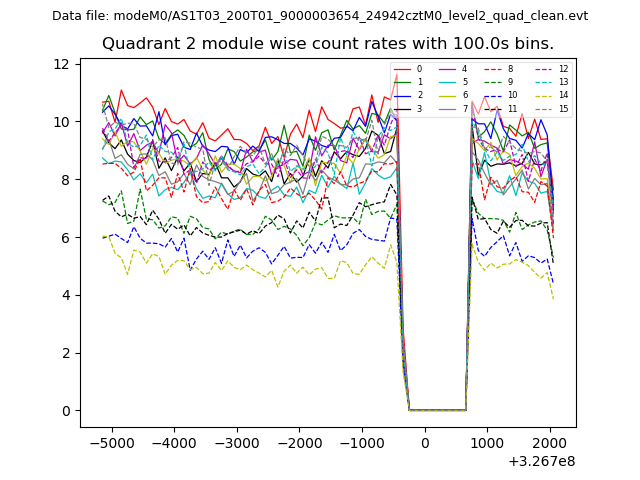
| Module-wise count rates for Quadrant C Data is divided into 100 sec bins |
 |
 |
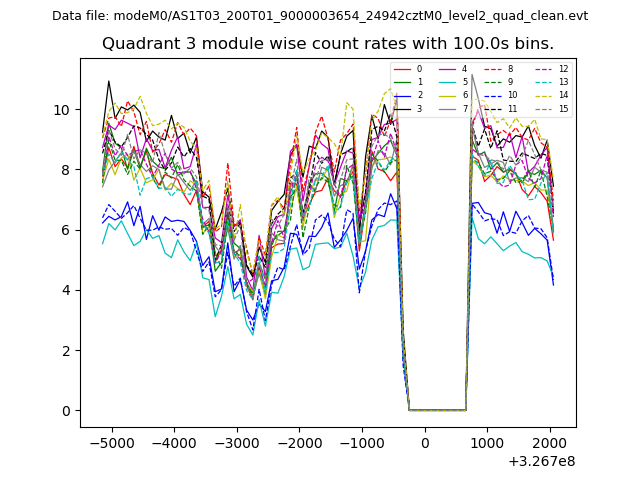
| Module-wise count rates for Quadrant D Data is divided into 100 sec bins |
 |
 |
| Parameter | Plot |
|---|---|
| CZT HV Monitor |  |
| D_VDD | 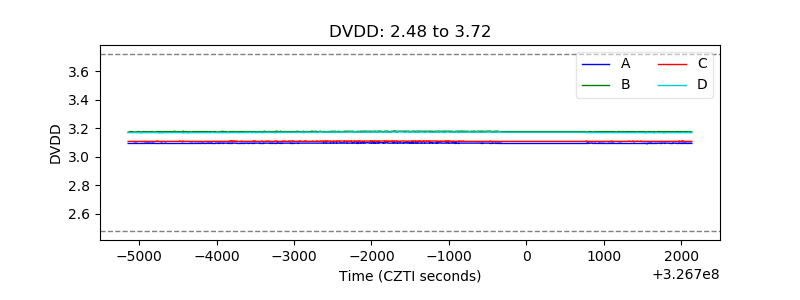 |
| Temperature 1 | 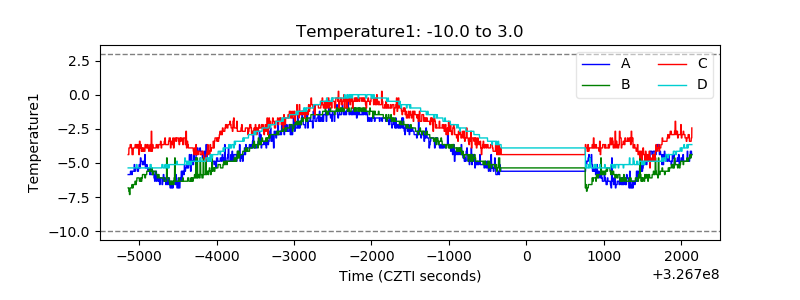 |
| Veto HV Monitor | 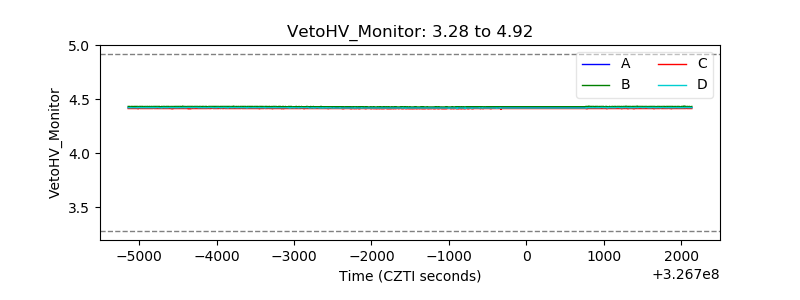 |
| Veto LLD | 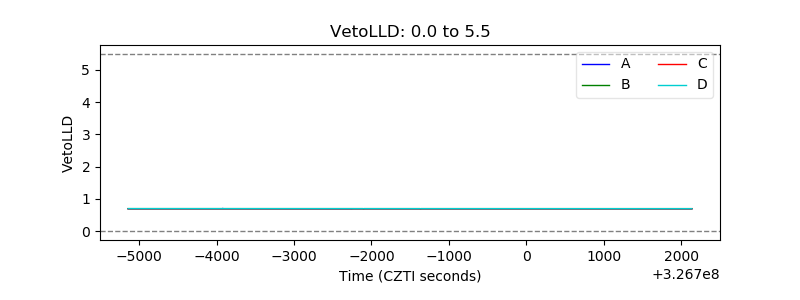 |
| Alpha Counter | 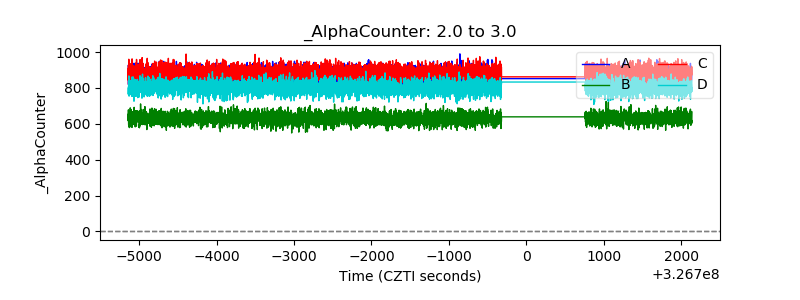 |
| _CPM_Rate | 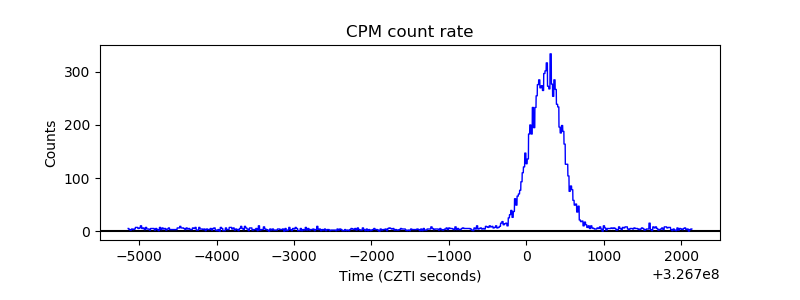 |
| CZT Counter | 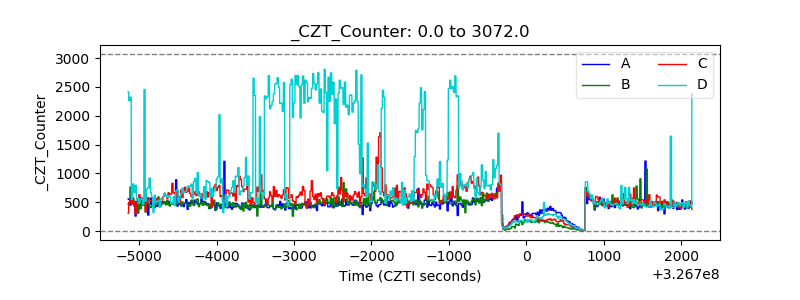 |
| +2.5 Volts monitor | 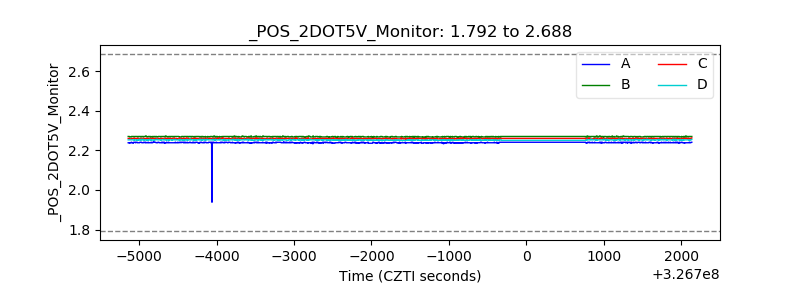 |
| +5 Volts monitor |  |
| _ROLL_ROT | 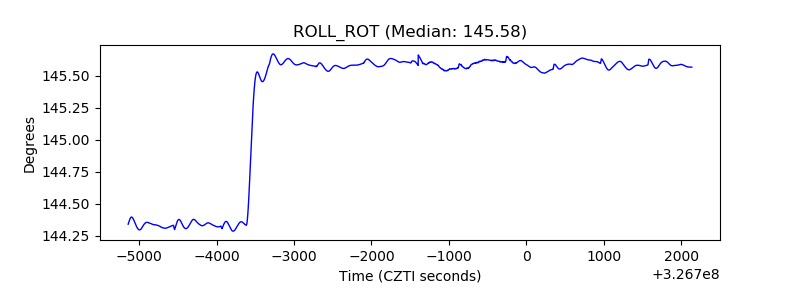 |
| _Roll_DEC | 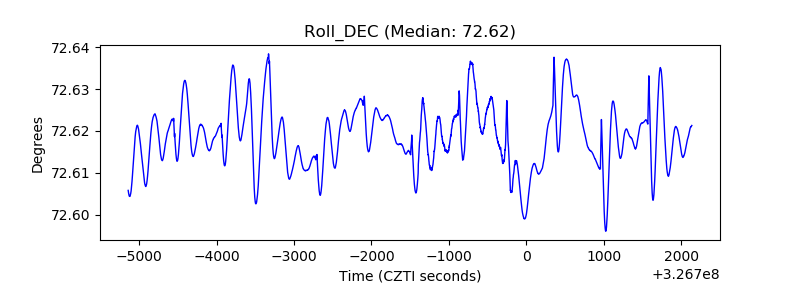 |
| _Roll_RA | 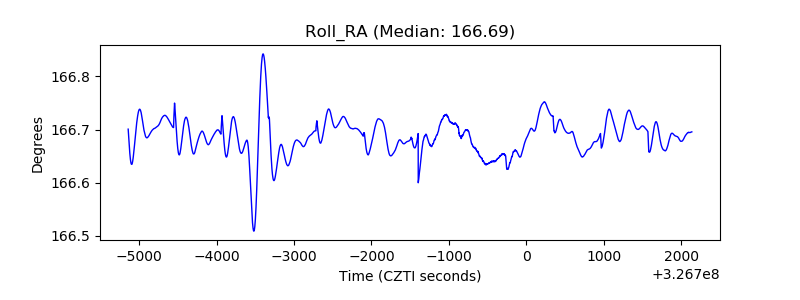 |
| Veto Counter | 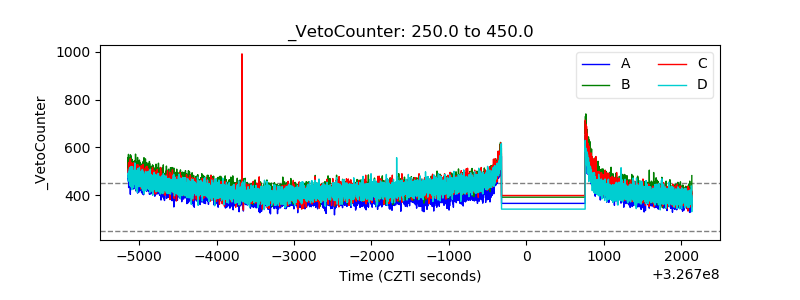 |