| Param | Original file | Final file |
|---|---|---|
| Filename | modeM0/AS1T03_200T01_9000003654_24943cztM0_level2.evt | modeM0/AS1T03_200T01_9000003654_24943cztM0_level2_quad_clean.evt |
| Size (bytes) | 536,428,800 | 130,080,960 |
| Size | 511.6 MB | 124.1 MB |
| Events in quadrant A | 3,159,796 | 891,709 |
| Events in quadrant B | 3,654,447 | 900,869 |
| Events in quadrant C | 4,396,613 | 849,289 |
| Events in quadrant D | 4,569,857 | 819,952 |
| Mode M9 | |||
|---|---|---|---|
| Quadrant | BADHDUFLAG | Total packets | Discarded packets |
| A | 0 | 6 | 0 |
| B | 0 | 6 | 0 |
| C | 0 | 6 | 0 |
| D | 0 | 6 | 0 |
| Mode SS | |||
|---|---|---|---|
| Quadrant | BADHDUFLAG | Total packets | Discarded packets |
| A | 0 | 138 | 0 |
| B | 0 | 138 | 0 |
| C | 0 | 138 | 0 |
| D | 0 | 138 | 0 |
| Mode M0 | |||
|---|---|---|---|
| Quadrant | BADHDUFLAG | Total packets | Discarded packets |
| A | 0 | 13936 | 1 |
| B | 0 | 15247 | 1 |
| C | 0 | 17698 | 1 |
| D | 0 | 18163 | 1 |
| Quadrant | Total seconds | Saturated seconds | Saturation percentage |
|---|---|---|---|
| A | 6860 | 125 | 1.822157% |
| B | 6861 | 244 | 3.556333% |
| C | 6861 | 187 | 2.725550% |
| D | 6861 | 386 | 5.626002% |
Noise dominated data is calculated using 1-second bins in cleaned event files. If a bin has >2000 counts, and if more than 50% of those come from <1% of pixels, then it is considered to be noise-dominated and hence unusable.
| Quadrant | # 1 sec bins | Bins with >0 counts | Bins with >2000 counts | High rate bins dominated by noise | Noise dominated (total time) | Noise dominated (detector-on time) | Marked lightcurve |
|---|---|---|---|---|---|---|---|
| A | 7405 | 6861 | 0 | 0 | 0.00% | 0.00% | 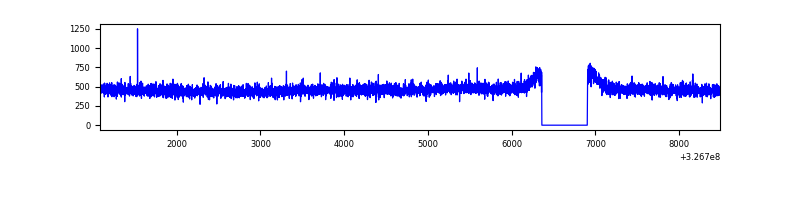 |
| B | 7406 | 6862 | 44 | 44 | 0.59% | 0.64% | 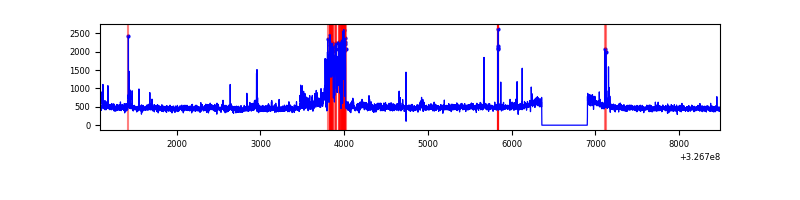 |
| C | 7406 | 6862 | 0 | 0 | 0.00% | 0.00% | 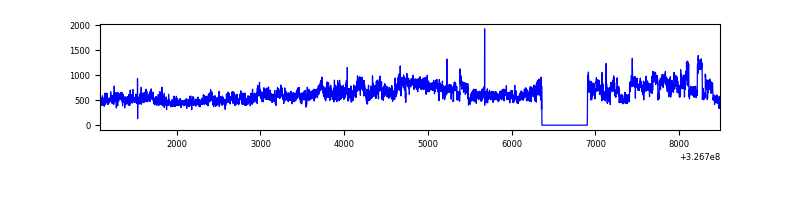 |
| D | 7406 | 6862 | 249 | 249 | 3.36% | 3.63% | 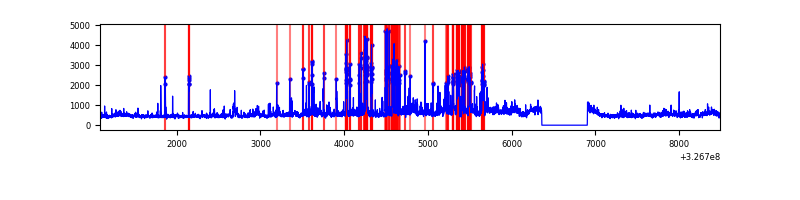 |
Top three noisy pixels from each quadrant. If the there are fewer than three noisy pixels in the level2.evt file, extra rows are filled as -1
| Pixel properties | Quadrant properties | ||||||
|---|---|---|---|---|---|---|---|
| Quadrant | DetID | PixID | Counts | Sigma | Mean | Median | Sigma |
| A | 13 | 254 | 10479 | 59.17 | 817 | 802 | 163.5 |
| A | 4 | 2 | 7862 | 43.17 | 817 | 802 | 163.5 |
| A | 3 | 137 | 7471 | 40.78 | 817 | 802 | 163.5 |
| B | 15 | 33 | 277043 | 1805.91 | 810 | 789 | 153.0 |
| B | 0 | 230 | 57701 | 372.04 | 810 | 789 | 153.0 |
| B | 10 | 251 | 46946 | 301.73 | 810 | 789 | 153.0 |
| C | 7 | 247 | 1239329 | 6933.02 | 775 | 778 | 178.6 |
| C | 14 | 238 | 124465 | 692.36 | 775 | 778 | 178.6 |
| C | 13 | 61 | 5326 | 25.46 | 775 | 778 | 178.6 |
| D | 1 | 52 | 1042510 | 5542.78 | 774 | 748 | 187.9 |
| D | 1 | 3 | 317419 | 1684.87 | 774 | 748 | 187.9 |
| D | 8 | 195 | 89547 | 472.46 | 774 | 748 | 187.9 |
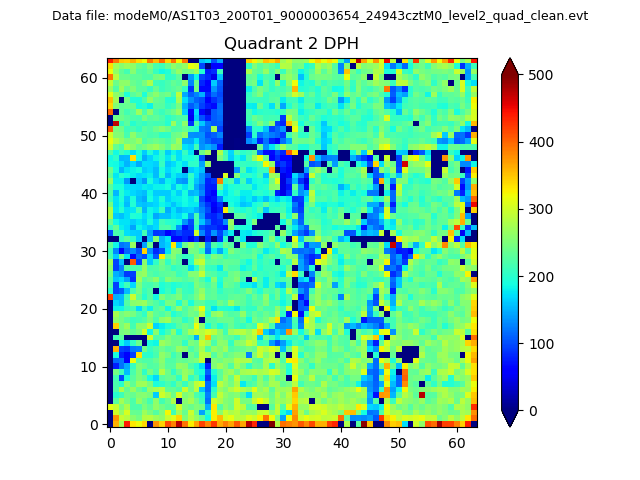
Histogram calculated using DETX and DETY for each event in the final _common_clean file
| Quadrant A | 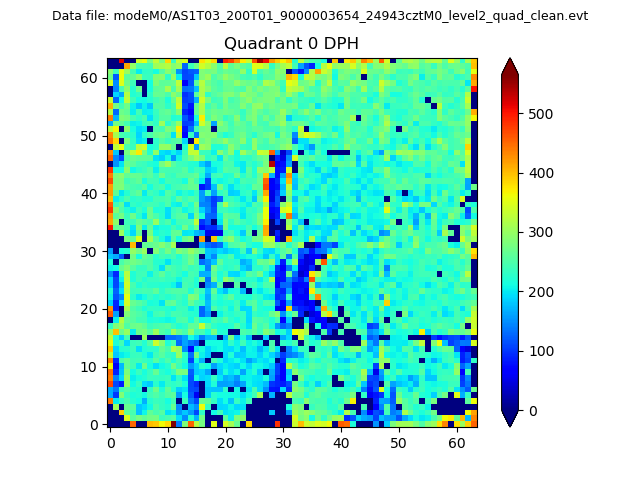 |
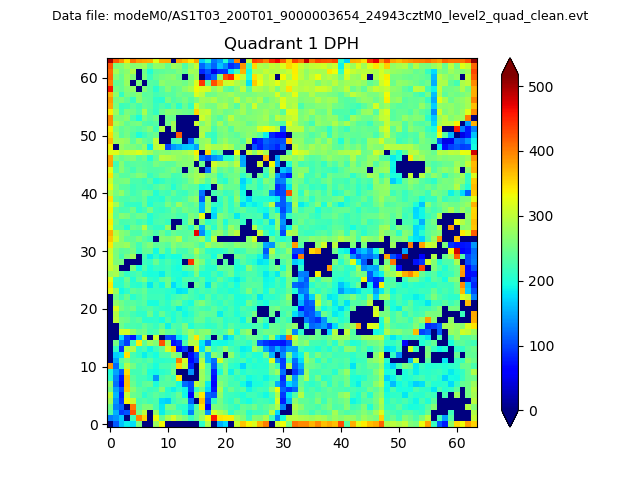 |
Quadrant B |
|---|---|---|---|
| Quadrant D | 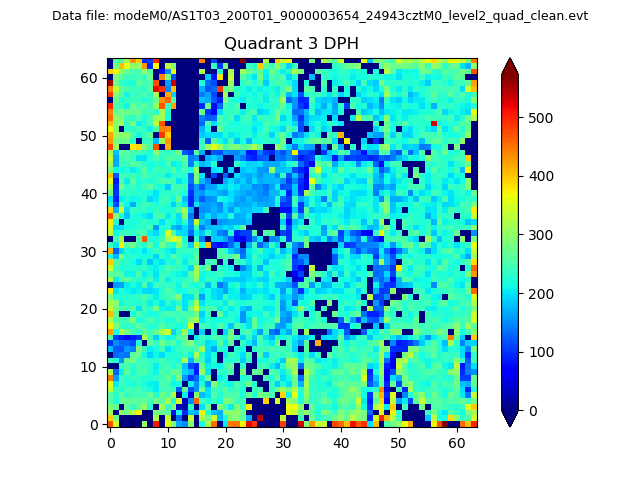 |
 |
Quadrant C |
| Plot type | Count rate plots | Images |
|---|---|---|
| Comparison with Poisson distribution Blue bars denote a histogram of data divided into 1 sec bins. Red curve is a Poisson curve with rate = median count rate of data. |
 |
 |
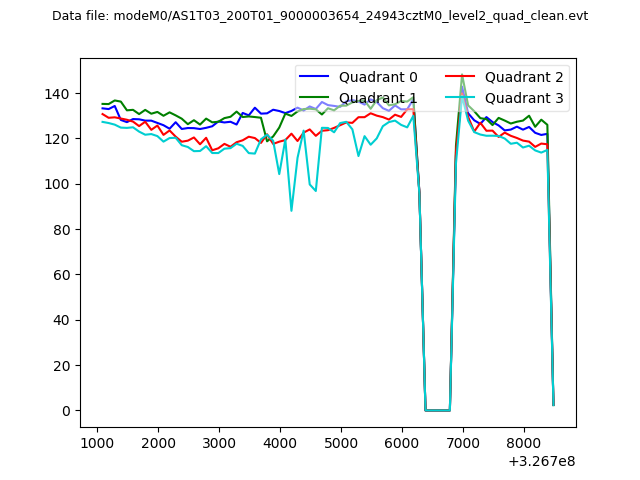
| Quadrant-wise count rates Data is divided into 100 sec bins |
 |
|
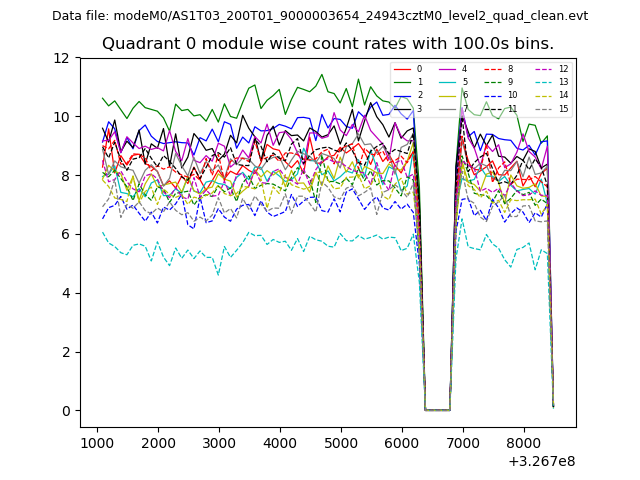
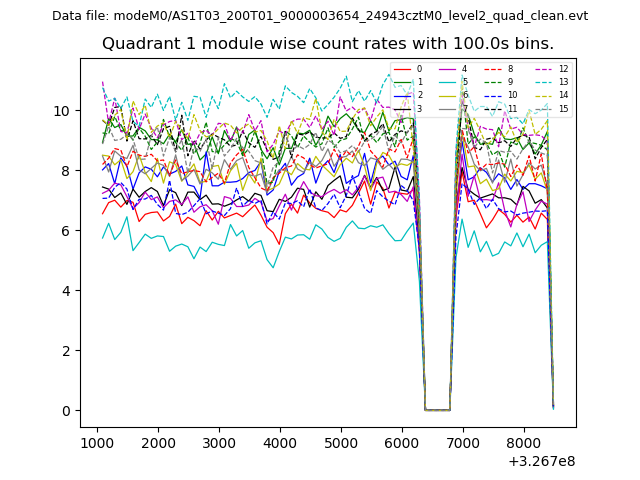
| Module-wise count rates for Quadrant A Data is divided into 100 sec bins |
 |
 |
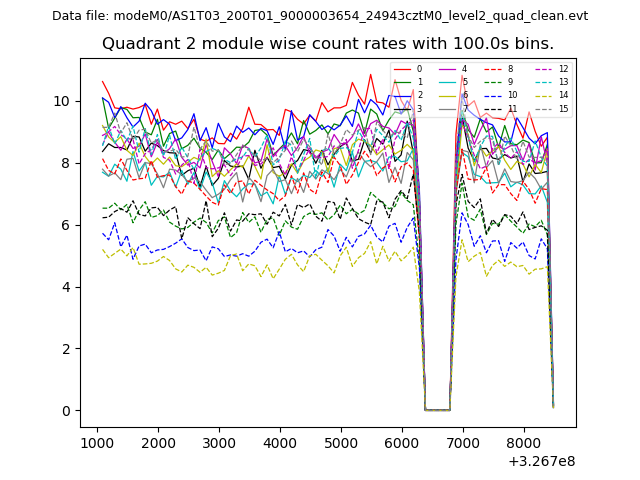
| Module-wise count rates for Quadrant B Data is divided into 100 sec bins |
 |
 |
| Module-wise count rates for Quadrant C Data is divided into 100 sec bins |
 |
 |
| Module-wise count rates for Quadrant D Data is divided into 100 sec bins |
 |
 |
| Parameter | Plot |
|---|---|
| CZT HV Monitor | 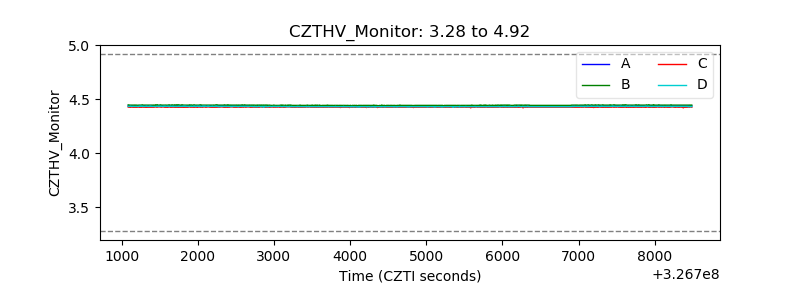 |
| D_VDD | 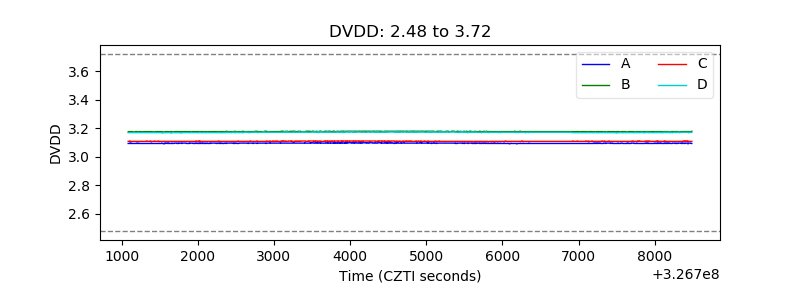 |
| Temperature 1 | 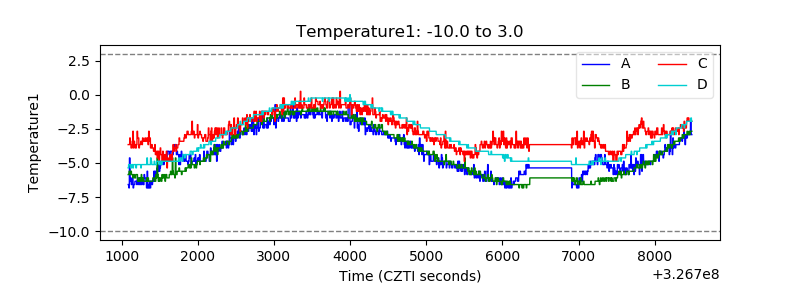 |
| Veto HV Monitor | 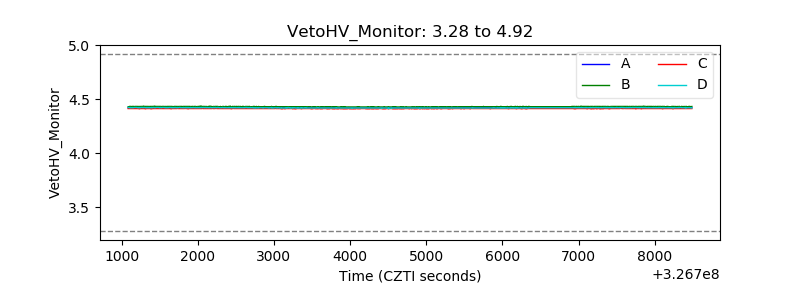 |
| Veto LLD | 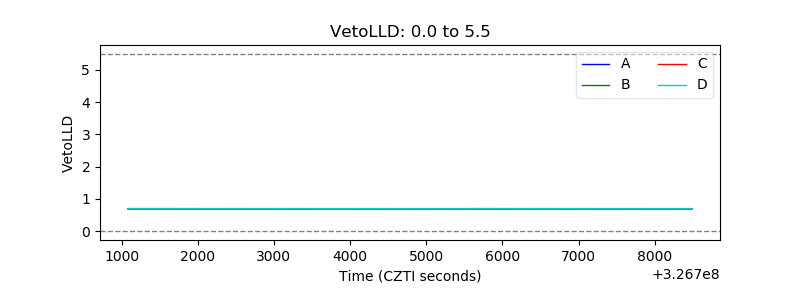 |
| Alpha Counter | 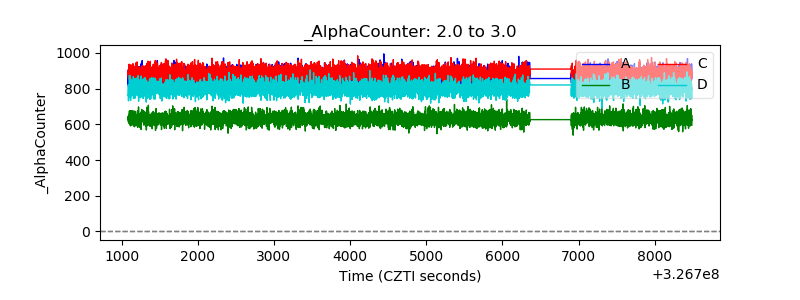 |
| _CPM_Rate | 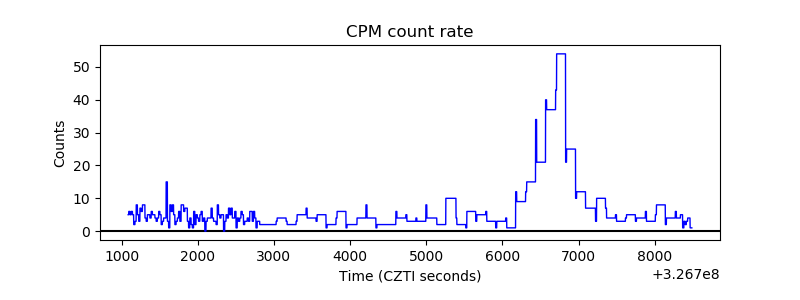 |
| CZT Counter | 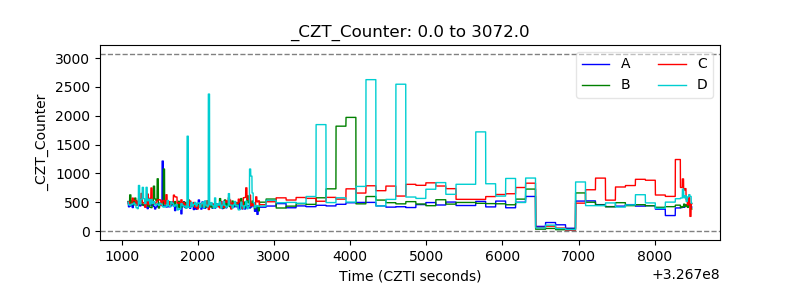 |
| +2.5 Volts monitor |  |
| +5 Volts monitor | 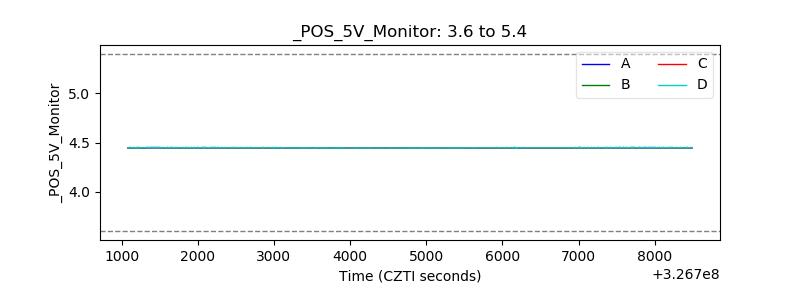 |
| _ROLL_ROT |  |
| _Roll_DEC | 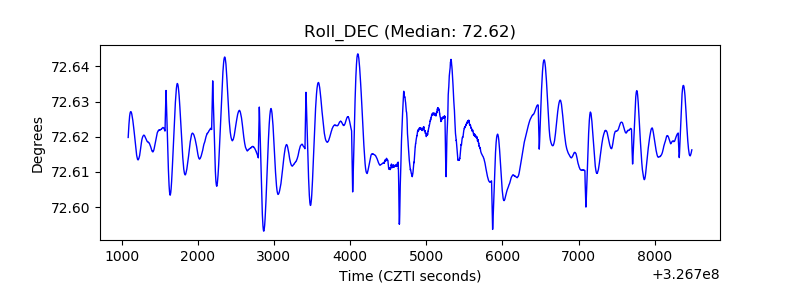 |
| _Roll_RA | 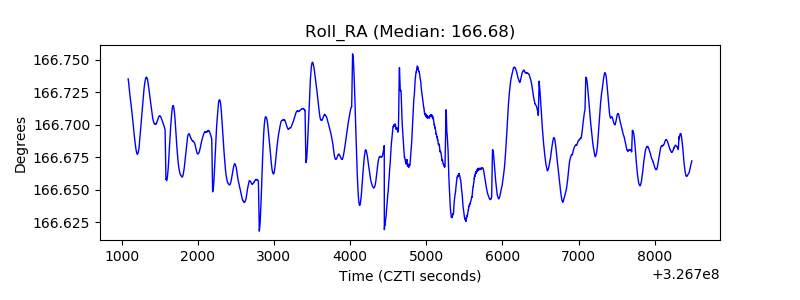 |
| Veto Counter |  |