| Param | Original file | Final file |
|---|---|---|
| Filename | modeM0/AS1T03_200T01_9000003654_24944cztM0_level2.evt | modeM0/AS1T03_200T01_9000003654_24944cztM0_level2_quad_clean.evt |
| Size (bytes) | 633,012,480 | 133,629,120 |
| Size | 603.7 MB | 127.4 MB |
| Events in quadrant A | 3,335,760 | 914,469 |
| Events in quadrant B | 3,635,911 | 927,220 |
| Events in quadrant C | 6,852,837 | 850,929 |
| Events in quadrant D | 4,858,047 | 852,119 |
| Mode M9 | |||
|---|---|---|---|
| Quadrant | BADHDUFLAG | Total packets | Discarded packets |
| A | 0 | 1 | 0 |
| B | 0 | 1 | 0 |
| C | 0 | 1 | 0 |
| D | 0 | 1 | 0 |
| Mode SS | |||
|---|---|---|---|
| Quadrant | BADHDUFLAG | Total packets | Discarded packets |
| A | 0 | 146 | 0 |
| B | 0 | 146 | 0 |
| C | 0 | 146 | 0 |
| D | 0 | 146 | 0 |
| Mode M0 | |||
|---|---|---|---|
| Quadrant | BADHDUFLAG | Total packets | Discarded packets |
| A | 0 | 14818 | 0 |
| B | 0 | 15415 | 0 |
| C | 0 | 25362 | 0 |
| D | 0 | 19220 | 0 |
| Quadrant | Total seconds | Saturated seconds | Saturation percentage |
|---|---|---|---|
| A | 7214 | 207 | 2.869421% |
| B | 7214 | 202 | 2.800111% |
| C | 7214 | 471 | 6.528971% |
| D | 7214 | 301 | 4.172442% |
Noise dominated data is calculated using 1-second bins in cleaned event files. If a bin has >2000 counts, and if more than 50% of those come from <1% of pixels, then it is considered to be noise-dominated and hence unusable.
| Quadrant | # 1 sec bins | Bins with >0 counts | Bins with >2000 counts | High rate bins dominated by noise | Noise dominated (total time) | Noise dominated (detector-on time) | Marked lightcurve |
|---|---|---|---|---|---|---|---|
| A | 7274 | 7216 | 0 | 0 | 0.00% | 0.00% | 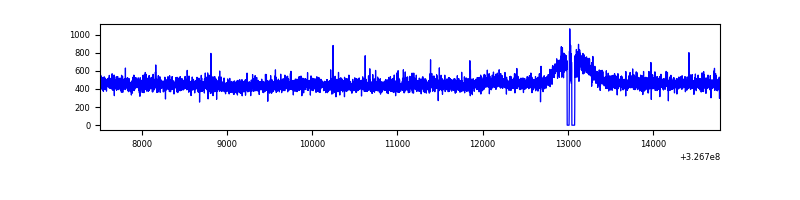 |
| B | 7274 | 7216 | 17 | 17 | 0.23% | 0.24% | 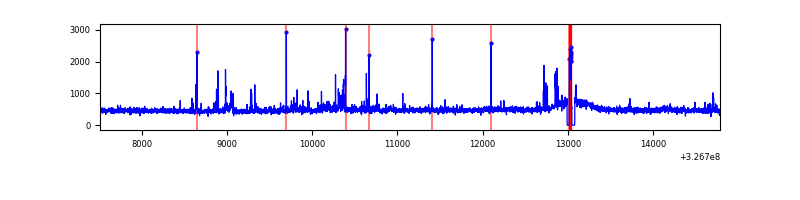 |
| C | 7274 | 7216 | 2 | 2 | 0.03% | 0.03% | 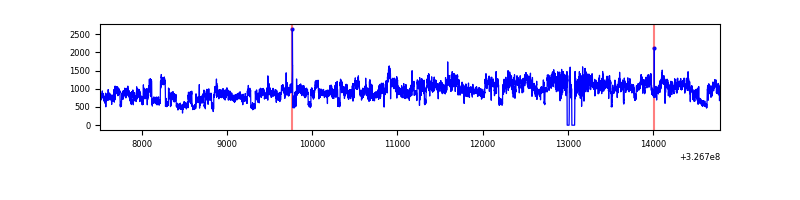 |
| D | 7274 | 7216 | 99 | 99 | 1.36% | 1.37% | 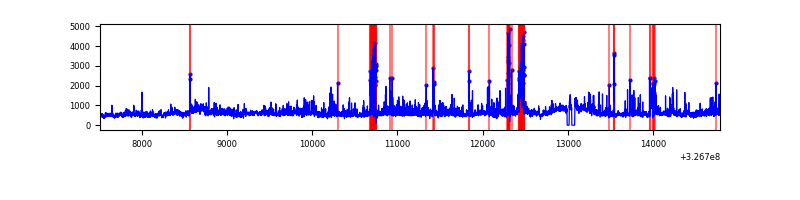 |
Top three noisy pixels from each quadrant. If the there are fewer than three noisy pixels in the level2.evt file, extra rows are filled as -1
| Pixel properties | Quadrant properties | ||||||
|---|---|---|---|---|---|---|---|
| Quadrant | DetID | PixID | Counts | Sigma | Mean | Median | Sigma |
| A | 13 | 254 | 11362 | 60.77 | 862 | 842 | 173.1 |
| A | 3 | 137 | 7922 | 40.9 | 862 | 842 | 173.1 |
| A | 0 | 226 | 7321 | 37.43 | 862 | 842 | 173.1 |
| B | 3 | 64 | 105101 | 647.87 | 850 | 826 | 160.9 |
| B | 6 | 36 | 48059 | 293.47 | 850 | 826 | 160.9 |
| B | 0 | 190 | 26011 | 156.48 | 850 | 826 | 160.9 |
| C | 7 | 247 | 3537909 | 18944.95 | 805 | 810 | 186.7 |
| C | 14 | 238 | 127686 | 679.56 | 805 | 810 | 186.7 |
| C | 0 | 207 | 26503 | 137.61 | 805 | 810 | 186.7 |
| D | 1 | 3 | 665718 | 3311.76 | 824 | 796 | 200.8 |
| D | 1 | 52 | 493223 | 2452.62 | 824 | 796 | 200.8 |
| D | 7 | 238 | 250197 | 1242.19 | 824 | 796 | 200.8 |
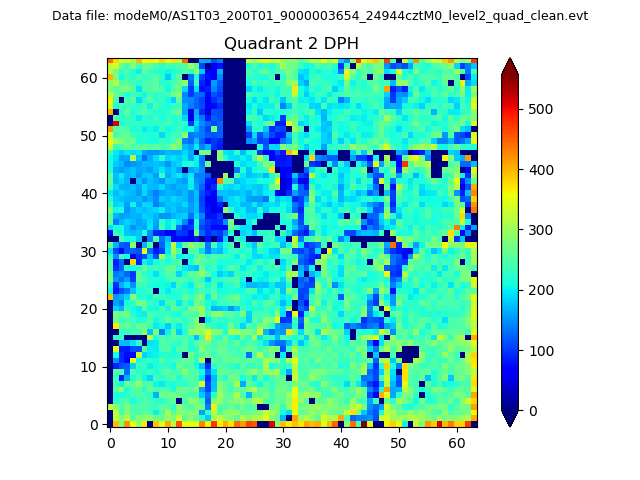
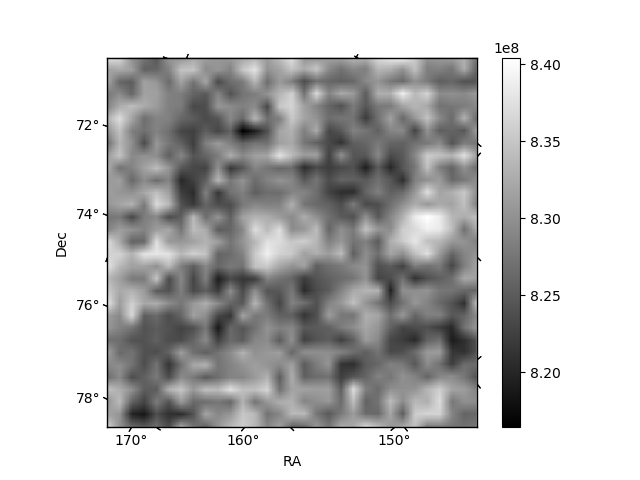
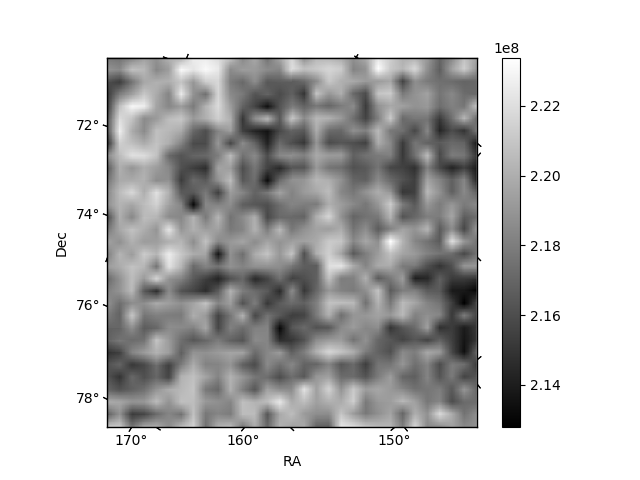
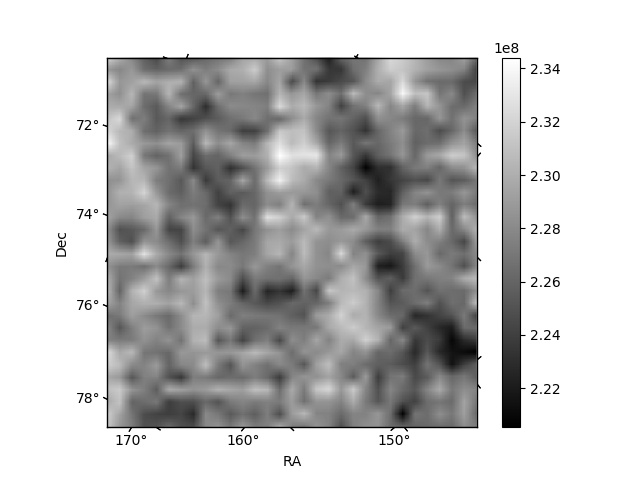
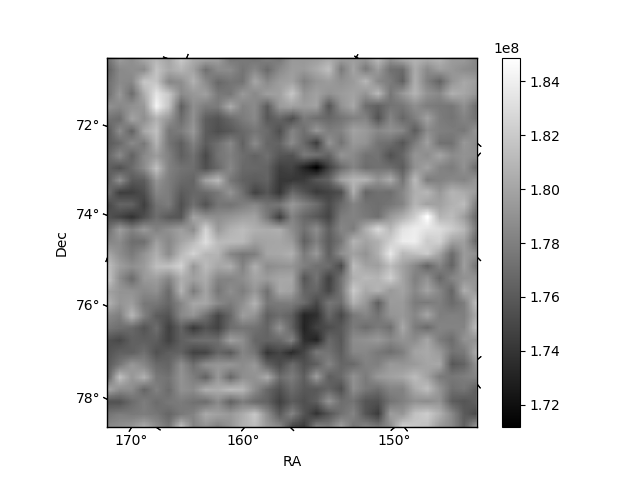
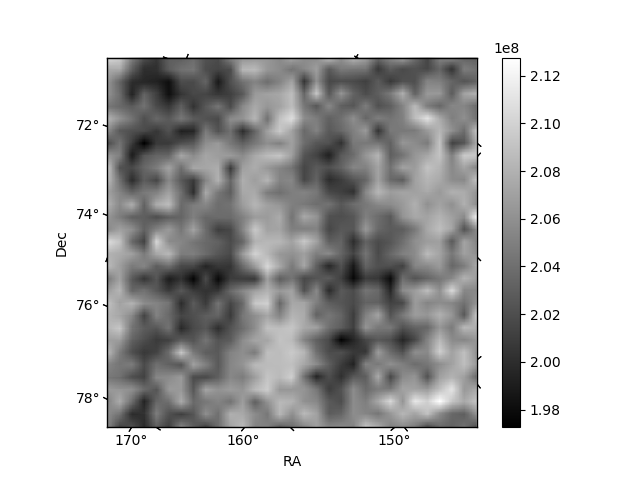
Histogram calculated using DETX and DETY for each event in the final _common_clean file
| Quadrant A | 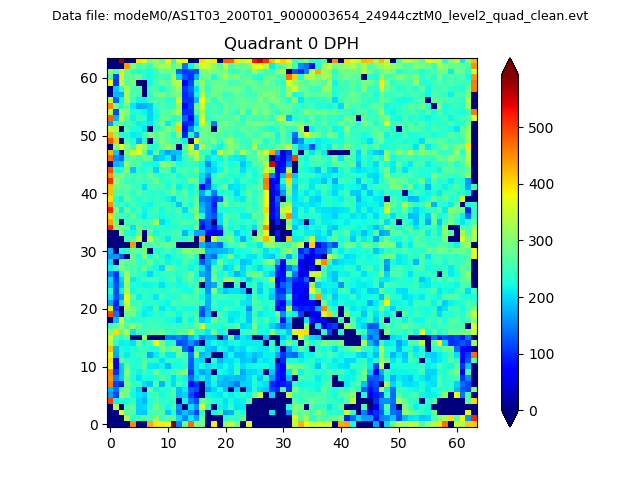 |
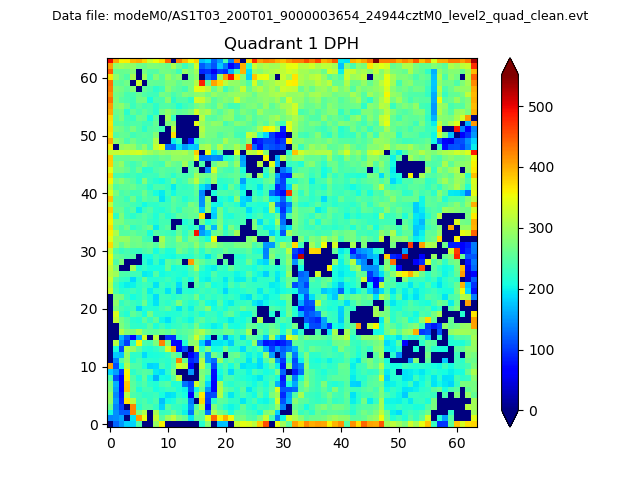 |
Quadrant B |
|---|---|---|---|
| Quadrant D | 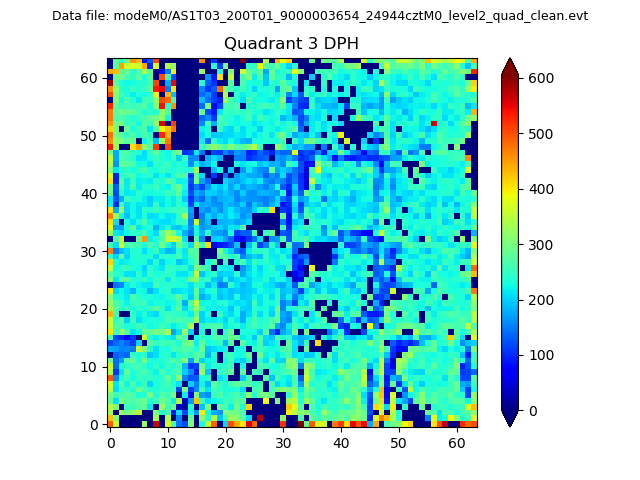 |
 |
Quadrant C |
| Plot type | Count rate plots | Images |
|---|---|---|
| Comparison with Poisson distribution Blue bars denote a histogram of data divided into 1 sec bins. Red curve is a Poisson curve with rate = median count rate of data. |
 |
 |
| Quadrant-wise count rates Data is divided into 100 sec bins |
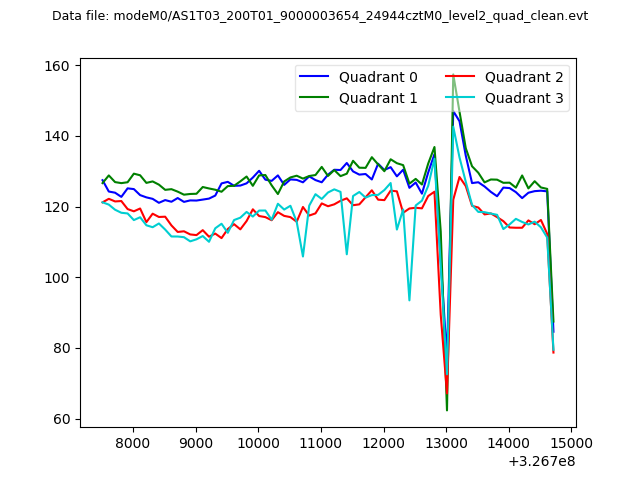 |
|
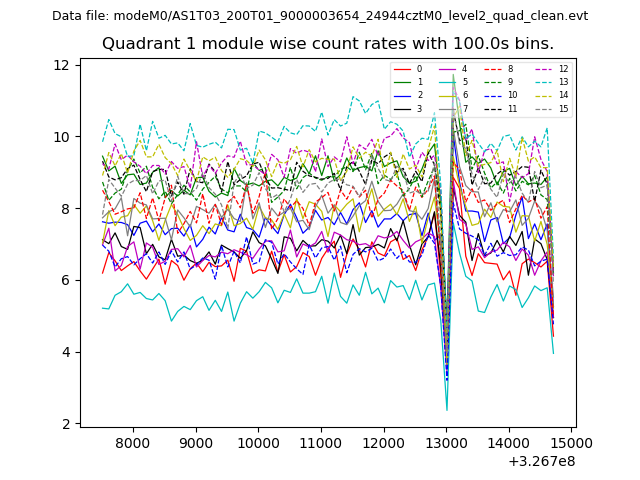
| Module-wise count rates for Quadrant A Data is divided into 100 sec bins |
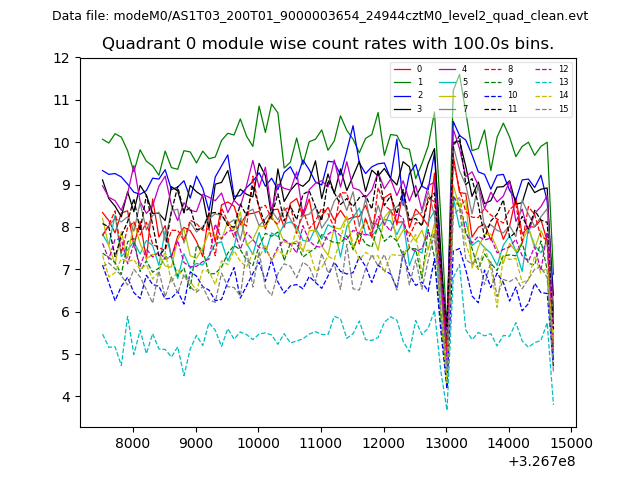 |
 |
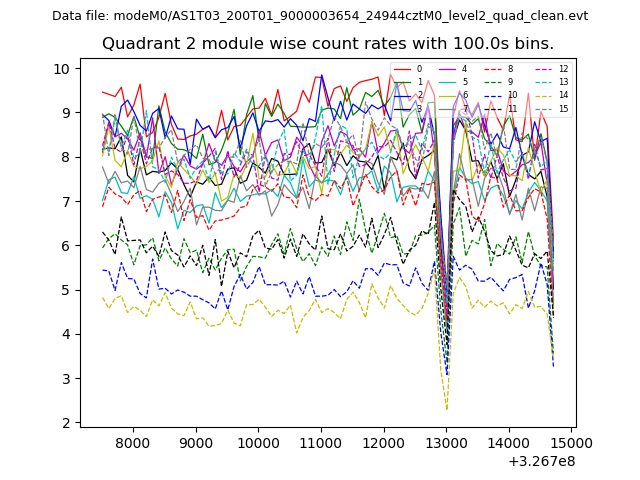
| Module-wise count rates for Quadrant B Data is divided into 100 sec bins |
 |
 |
| Module-wise count rates for Quadrant C Data is divided into 100 sec bins |
 |
 |
| Module-wise count rates for Quadrant D Data is divided into 100 sec bins |
 |
 |
| Parameter | Plot |
|---|---|
| CZT HV Monitor | 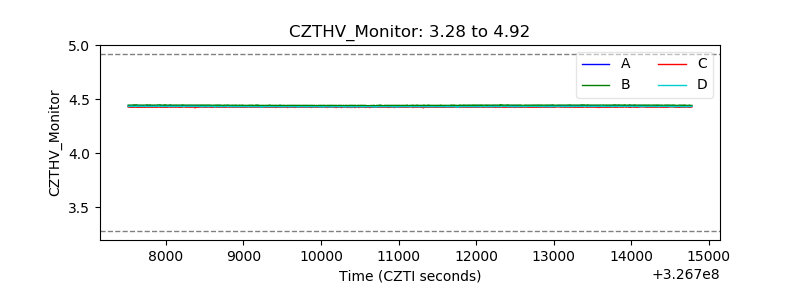 |
| D_VDD | 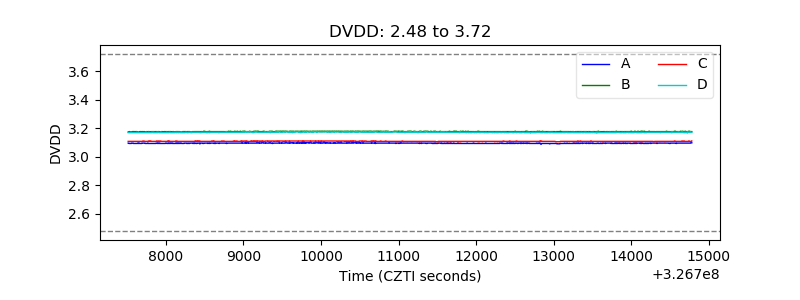 |
| Temperature 1 | 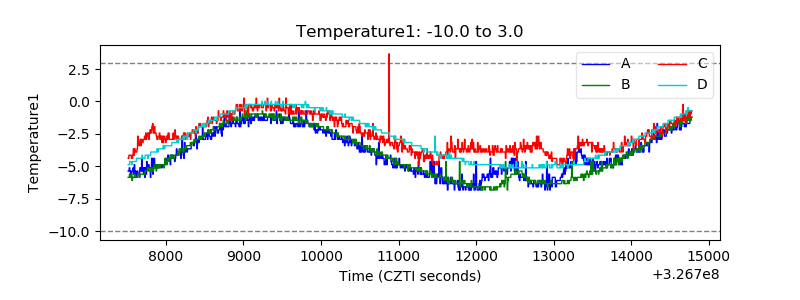 |
| Veto HV Monitor | 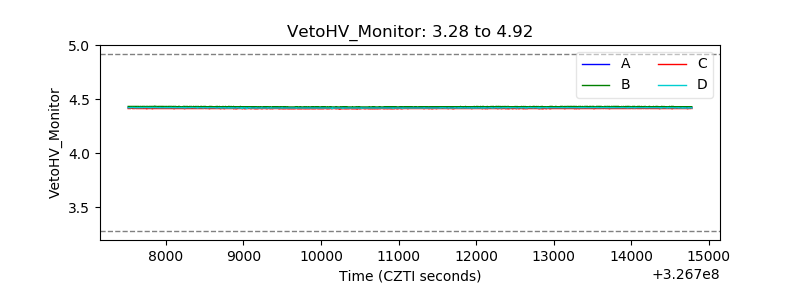 |
| Veto LLD | 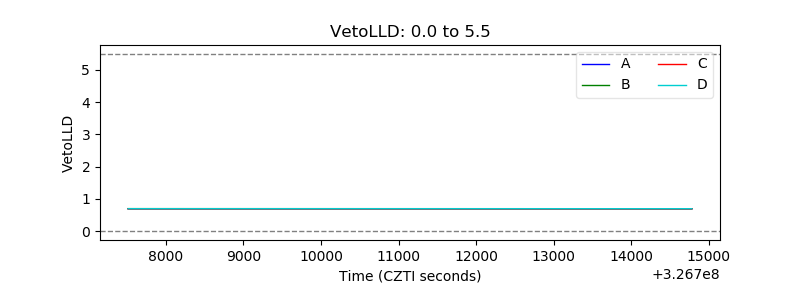 |
| Alpha Counter | 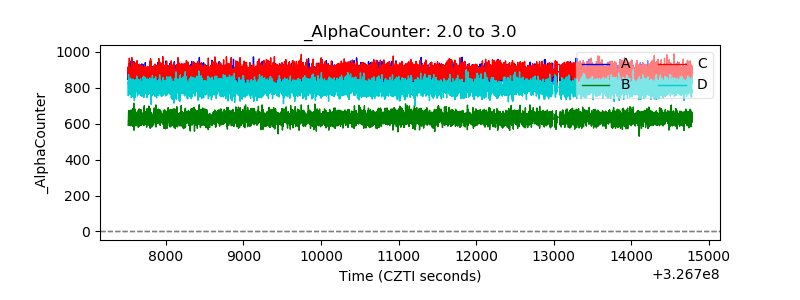 |
| _CPM_Rate | 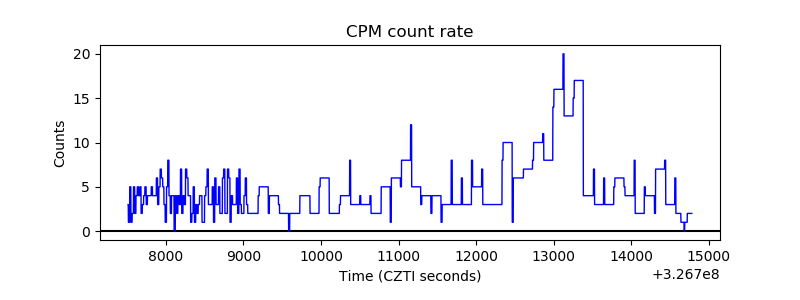 |
| CZT Counter | 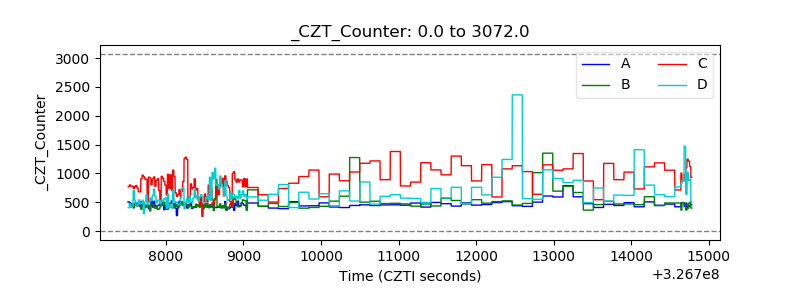 |
| +2.5 Volts monitor |  |
| +5 Volts monitor | 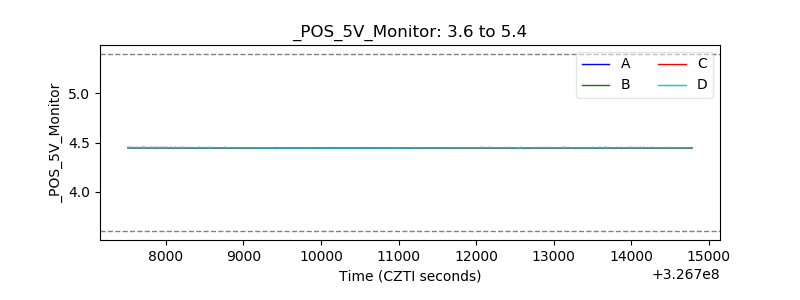 |
| _ROLL_ROT | 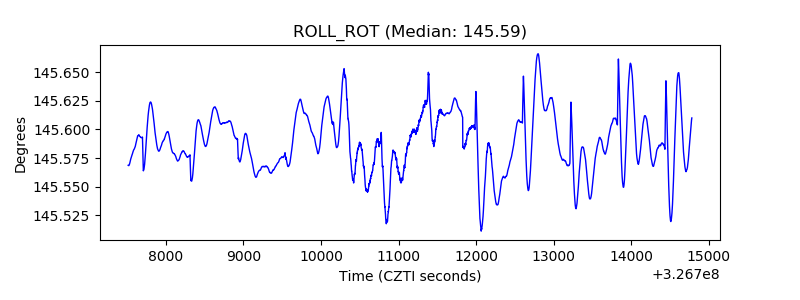 |
| _Roll_DEC | 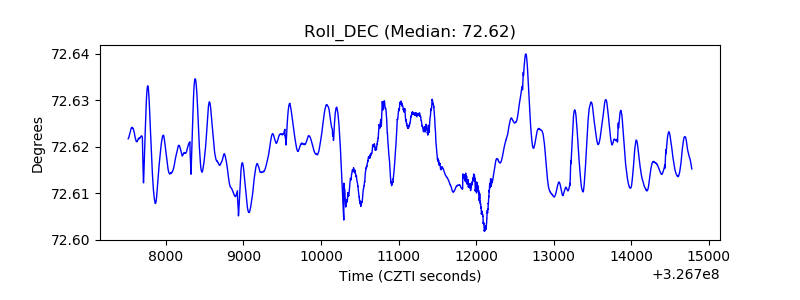 |
| _Roll_RA | 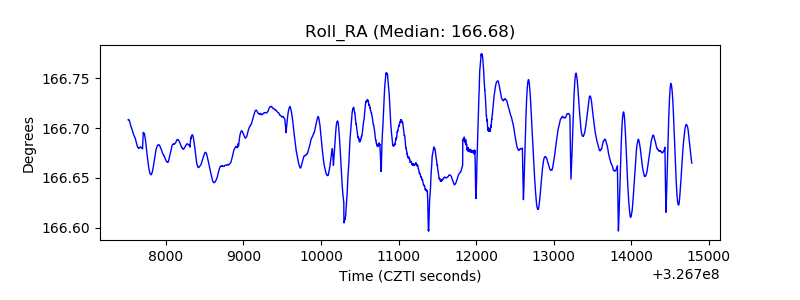 |
| Veto Counter |  |