| Param | Original file | Final file |
|---|---|---|
| Filename | modeM0/AS1T03_200T01_9000003654_24945cztM0_level2.evt | modeM0/AS1T03_200T01_9000003654_24945cztM0_level2_quad_clean.evt |
| Size (bytes) | 680,425,920 | 138,121,920 |
| Size | 648.9 MB | 131.7 MB |
| Events in quadrant A | 3,480,553 | 949,782 |
| Events in quadrant B | 3,698,651 | 960,883 |
| Events in quadrant C | 6,863,728 | 883,433 |
| Events in quadrant D | 6,054,930 | 865,309 |
| Mode M9 | |||
|---|---|---|---|
| Quadrant | BADHDUFLAG | Total packets | Discarded packets |
| A | 0 | 1 | 0 |
| B | 0 | 1 | 0 |
| C | 0 | 1 | 0 |
| D | 0 | 1 | 0 |
| Mode SS | |||
|---|---|---|---|
| Quadrant | BADHDUFLAG | Total packets | Discarded packets |
| A | 0 | 152 | 0 |
| B | 0 | 152 | 0 |
| C | 0 | 152 | 0 |
| D | 0 | 152 | 0 |
| Mode M0 | |||
|---|---|---|---|
| Quadrant | BADHDUFLAG | Total packets | Discarded packets |
| A | 0 | 15451 | 1 |
| B | 0 | 15870 | 1 |
| C | 0 | 25674 | 1 |
| D | 0 | 23169 | 1 |
| Quadrant | Total seconds | Saturated seconds | Saturation percentage |
|---|---|---|---|
| A | 7528 | 174 | 2.311371% |
| B | 7529 | 175 | 2.324346% |
| C | 7529 | 413 | 5.485456% |
| D | 7528 | 488 | 6.482465% |
Noise dominated data is calculated using 1-second bins in cleaned event files. If a bin has >2000 counts, and if more than 50% of those come from <1% of pixels, then it is considered to be noise-dominated and hence unusable.
| Quadrant | # 1 sec bins | Bins with >0 counts | Bins with >2000 counts | High rate bins dominated by noise | Noise dominated (total time) | Noise dominated (detector-on time) | Marked lightcurve |
|---|---|---|---|---|---|---|---|
| A | 7618 | 7530 | 0 | 0 | 0.00% | 0.00% | 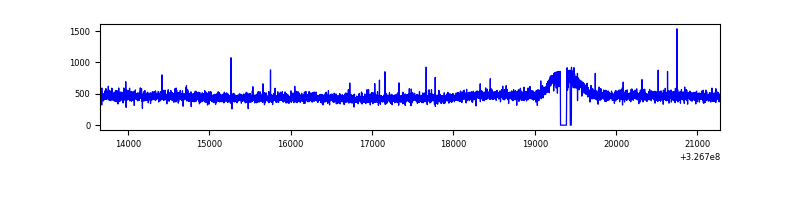 |
| B | 7619 | 7531 | 15 | 15 | 0.20% | 0.20% | 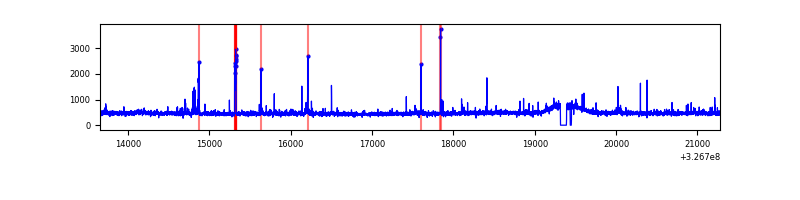 |
| C | 7619 | 7531 | 1 | 1 | 0.01% | 0.01% | 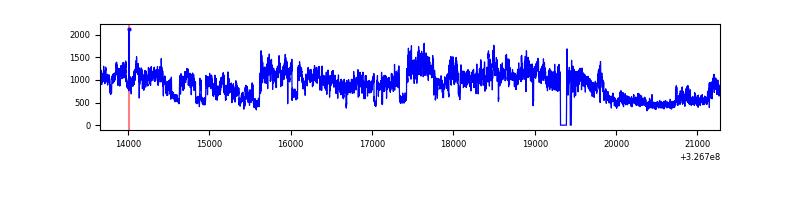 |
| D | 7618 | 7530 | 337 | 337 | 4.42% | 4.48% | 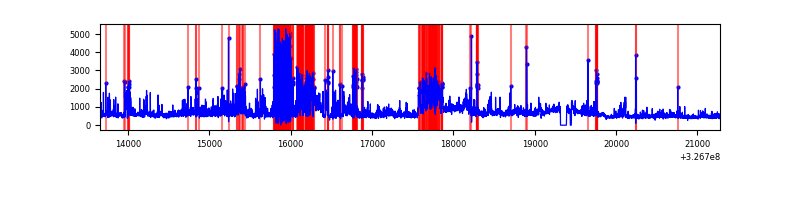 |
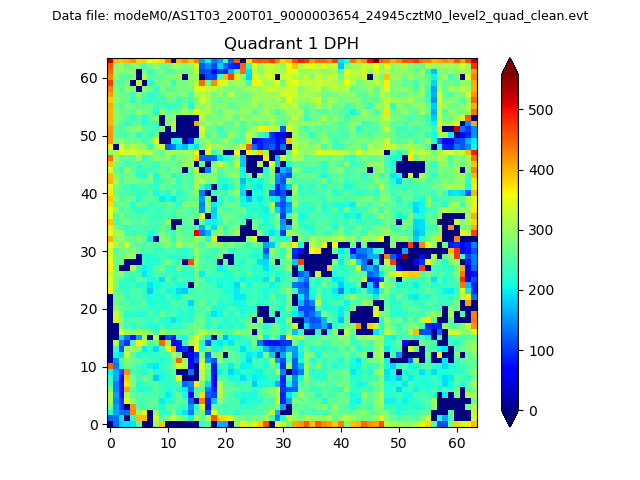
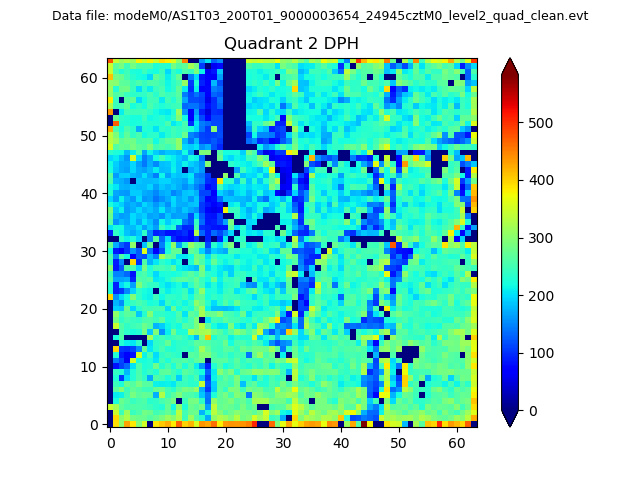
Top three noisy pixels from each quadrant. If the there are fewer than three noisy pixels in the level2.evt file, extra rows are filled as -1
| Pixel properties | Quadrant properties | ||||||
|---|---|---|---|---|---|---|---|
| Quadrant | DetID | PixID | Counts | Sigma | Mean | Median | Sigma |
| A | 13 | 254 | 12641 | 64.02 | 902 | 878 | 183.7 |
| A | 3 | 137 | 8367 | 40.76 | 902 | 878 | 183.7 |
| A | 0 | 226 | 7720 | 37.24 | 902 | 878 | 183.7 |
| B | 3 | 64 | 70384 | 408.88 | 889 | 864 | 170.0 |
| B | 0 | 229 | 26908 | 153.18 | 889 | 864 | 170.0 |
| B | 10 | 251 | 26736 | 152.17 | 889 | 864 | 170.0 |
| C | 7 | 247 | 3412771 | 17314.2 | 845 | 848 | 197.1 |
| C | 14 | 238 | 134223 | 676.83 | 845 | 848 | 197.1 |
| C | 3 | 233 | 15218 | 72.92 | 845 | 848 | 197.1 |
| D | 1 | 52 | 1816193 | 8808.49 | 851 | 824 | 206.1 |
| D | 1 | 3 | 457020 | 2213.54 | 851 | 824 | 206.1 |
| D | 8 | 195 | 411033 | 1990.41 | 851 | 824 | 206.1 |
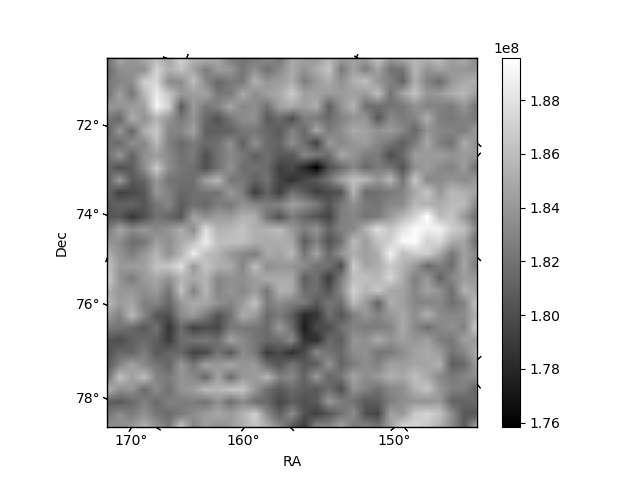
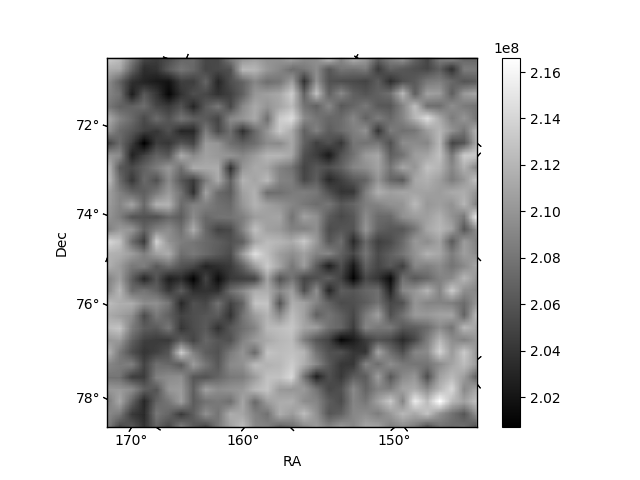
Histogram calculated using DETX and DETY for each event in the final _common_clean file
| Quadrant A | 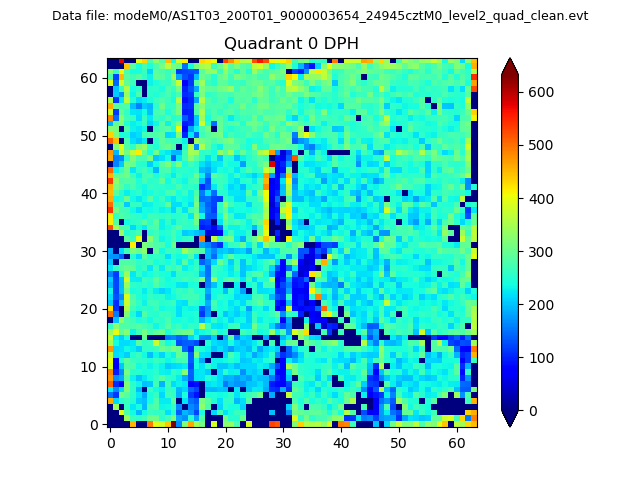 |
 |
Quadrant B |
|---|---|---|---|
| Quadrant D | 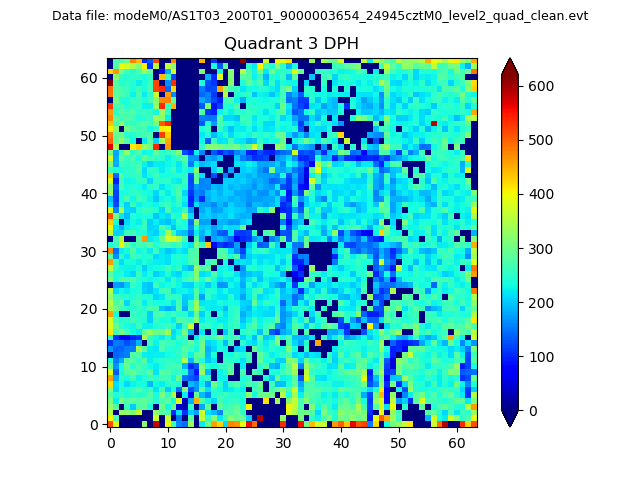 |
 |
Quadrant C |
| Plot type | Count rate plots | Images |
|---|---|---|
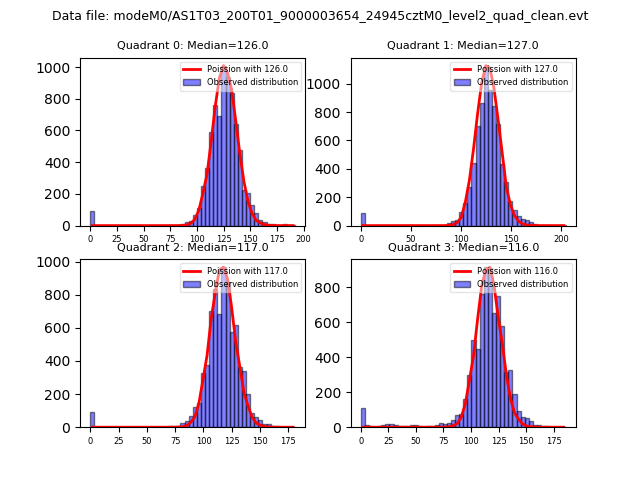
| Comparison with Poisson distribution Blue bars denote a histogram of data divided into 1 sec bins. Red curve is a Poisson curve with rate = median count rate of data. |
 |
 |
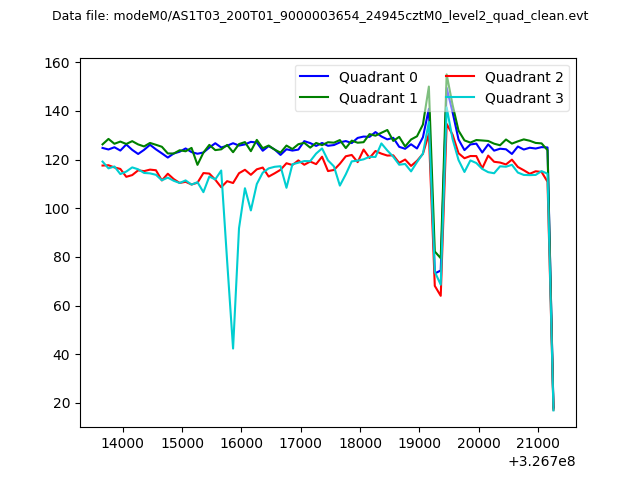
| Quadrant-wise count rates Data is divided into 100 sec bins |
 |
|
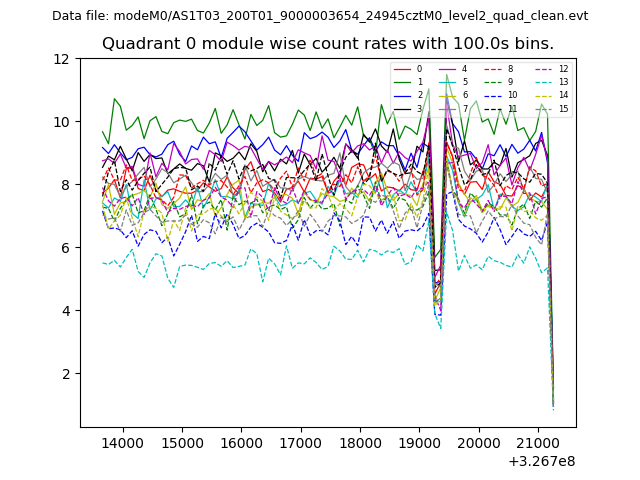
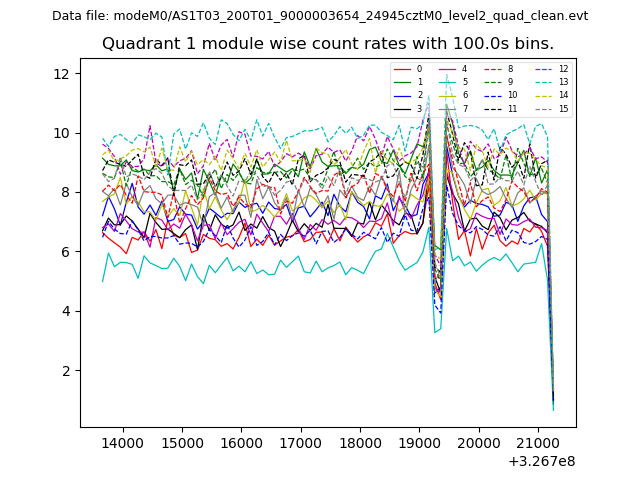
| Module-wise count rates for Quadrant A Data is divided into 100 sec bins |
 |
 |
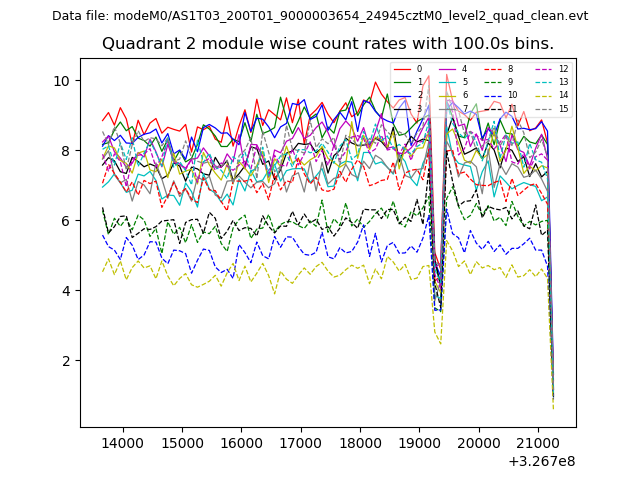
| Module-wise count rates for Quadrant B Data is divided into 100 sec bins |
 |
 |
| Module-wise count rates for Quadrant C Data is divided into 100 sec bins |
 |
 |
| Module-wise count rates for Quadrant D Data is divided into 100 sec bins |
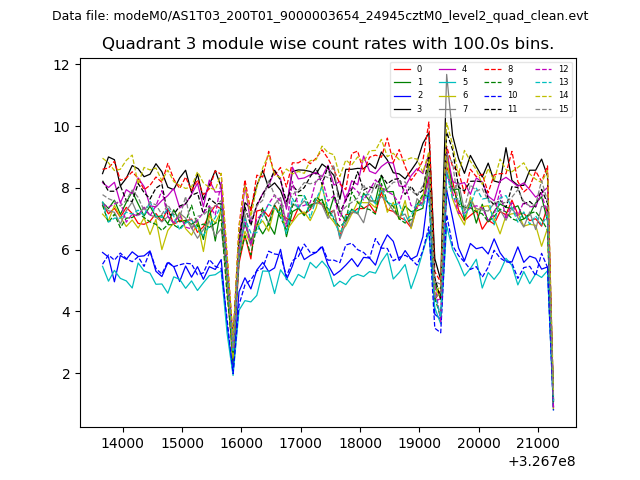 |
 |
| Parameter | Plot |
|---|---|
| CZT HV Monitor | 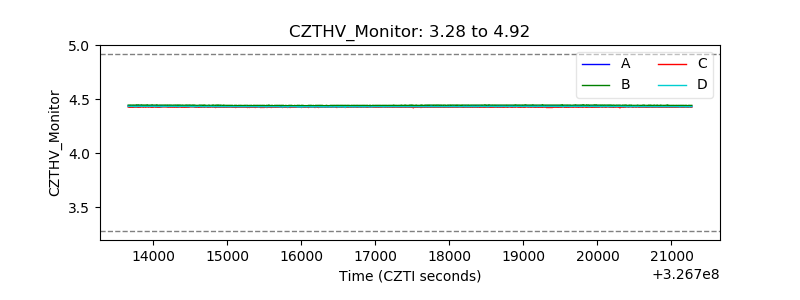 |
| D_VDD |  |
| Temperature 1 | 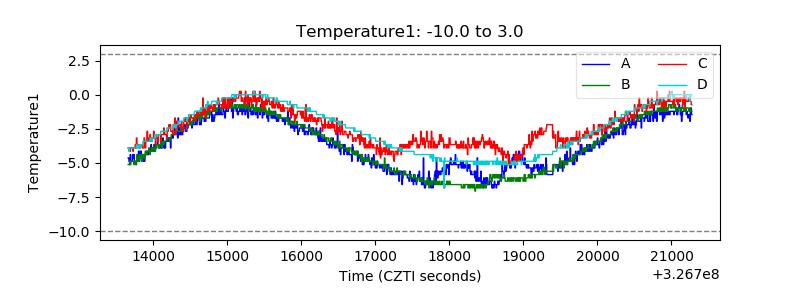 |
| Veto HV Monitor | 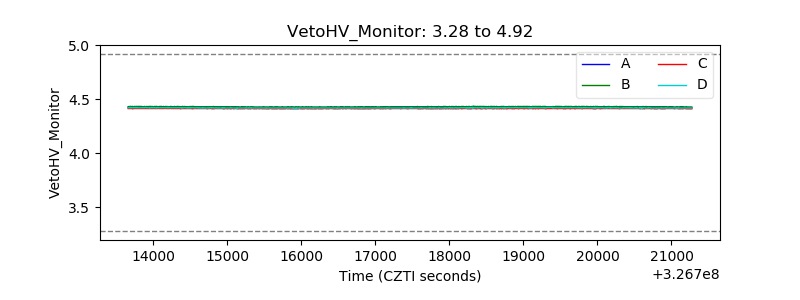 |
| Veto LLD |  |
| Alpha Counter | 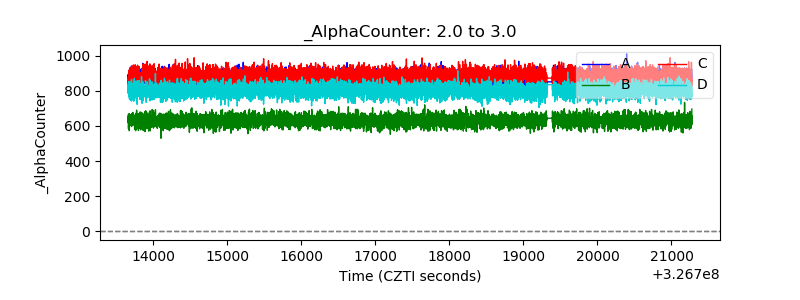 |
| _CPM_Rate | 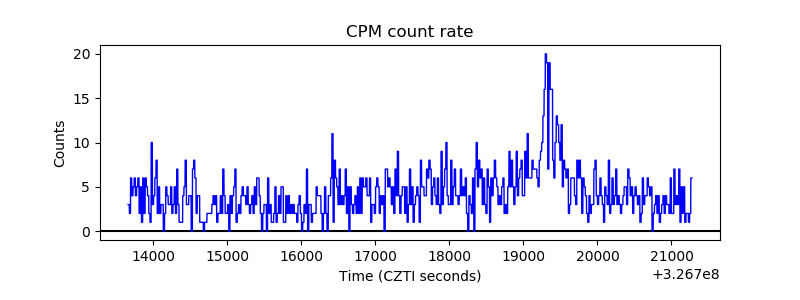 |
| CZT Counter | 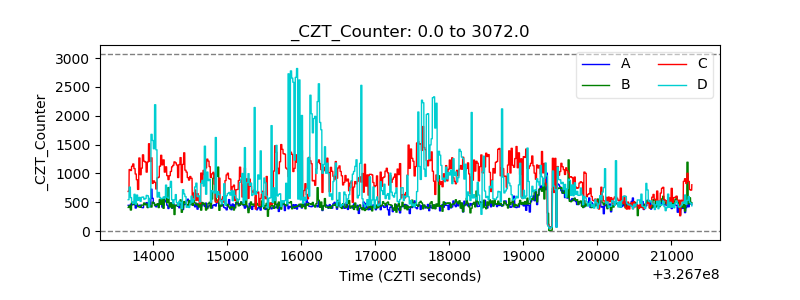 |
| +2.5 Volts monitor |  |
| +5 Volts monitor |  |
| _ROLL_ROT | 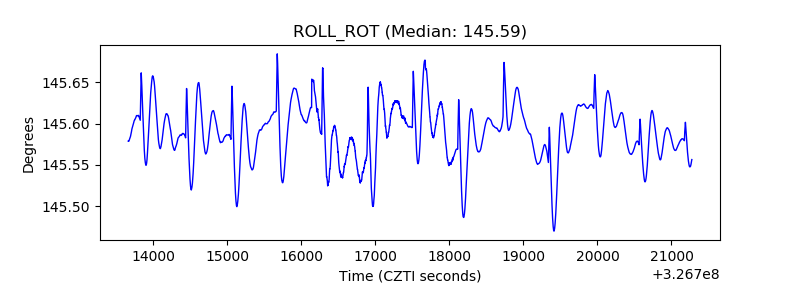 |
| _Roll_DEC | 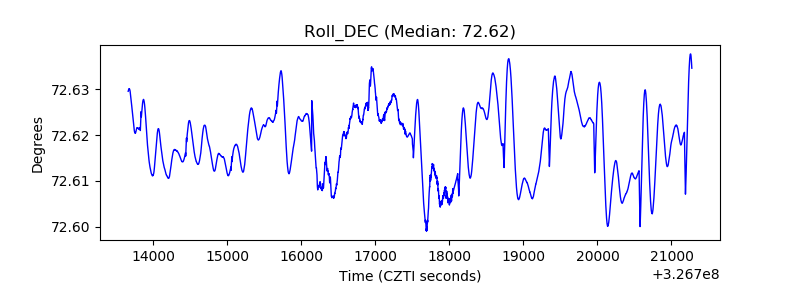 |
| _Roll_RA | 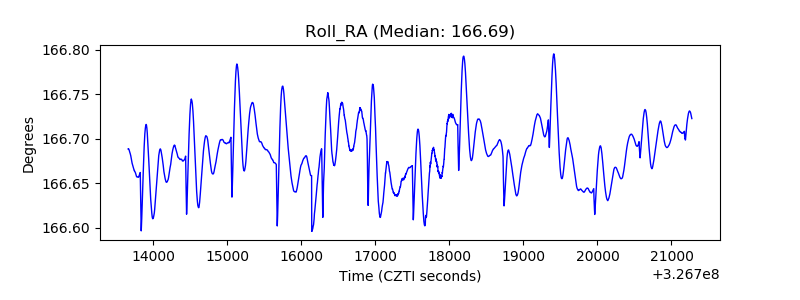 |
| Veto Counter | 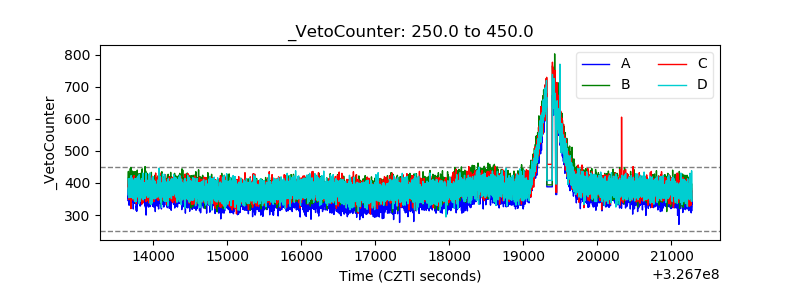 |