| Param | Original file | Final file |
|---|---|---|
| Filename | modeM0/AS1T03_200T01_9000003654_24946cztM0_level2.evt | modeM0/AS1T03_200T01_9000003654_24946cztM0_level2_quad_clean.evt |
| Size (bytes) | 501,088,320 | 121,250,880 |
| Size | 477.9 MB | 115.6 MB |
| Events in quadrant A | 3,003,233 | 825,359 |
| Events in quadrant B | 3,209,202 | 835,406 |
| Events in quadrant C | 4,352,070 | 779,918 |
| Events in quadrant D | 4,164,123 | 772,439 |
| Mode M9 | |||
|---|---|---|---|
| Quadrant | BADHDUFLAG | Total packets | Discarded packets |
| A | 0 | 4 | 0 |
| B | 0 | 4 | 0 |
| C | 0 | 4 | 0 |
| D | 0 | 4 | 0 |
| Mode SS | |||
|---|---|---|---|
| Quadrant | BADHDUFLAG | Total packets | Discarded packets |
| A | 0 | 134 | 0 |
| B | 0 | 134 | 0 |
| C | 0 | 134 | 0 |
| D | 0 | 134 | 0 |
| Mode M0 | |||
|---|---|---|---|
| Quadrant | BADHDUFLAG | Total packets | Discarded packets |
| A | 0 | 13386 | 1 |
| B | 0 | 13857 | 1 |
| C | 0 | 17386 | 1 |
| D | 0 | 17023 | 1 |
| Quadrant | Total seconds | Saturated seconds | Saturation percentage |
|---|---|---|---|
| A | 6583 | 82 | 1.245633% |
| B | 6584 | 96 | 1.458080% |
| C | 6584 | 168 | 2.551640% |
| D | 6584 | 137 | 2.080802% |
Noise dominated data is calculated using 1-second bins in cleaned event files. If a bin has >2000 counts, and if more than 50% of those come from <1% of pixels, then it is considered to be noise-dominated and hence unusable.
| Quadrant | # 1 sec bins | Bins with >0 counts | Bins with >2000 counts | High rate bins dominated by noise | Noise dominated (total time) | Noise dominated (detector-on time) | Marked lightcurve |
|---|---|---|---|---|---|---|---|
| A | 6963 | 6584 | 0 | 0 | 0.00% | 0.00% |  |
| B | 6964 | 6585 | 12 | 12 | 0.17% | 0.18% |  |
| C | 6964 | 6585 | 2 | 2 | 0.03% | 0.03% |  |
| D | 6964 | 6585 | 41 | 41 | 0.59% | 0.62% |  |
Top three noisy pixels from each quadrant. If the there are fewer than three noisy pixels in the level2.evt file, extra rows are filled as -1
| Pixel properties | Quadrant properties | ||||||
|---|---|---|---|---|---|---|---|
| Quadrant | DetID | PixID | Counts | Sigma | Mean | Median | Sigma |
| A | 13 | 254 | 11863 | 70.35 | 776 | 757 | 157.9 |
| A | 3 | 137 | 6832 | 38.48 | 776 | 757 | 157.9 |
| A | 0 | 226 | 6811 | 38.35 | 776 | 757 | 157.9 |
| B | 4 | 80 | 78128 | 525.71 | 770 | 749 | 147.2 |
| B | 15 | 33 | 47149 | 315.24 | 770 | 749 | 147.2 |
| B | 12 | 111 | 17709 | 115.22 | 770 | 749 | 147.2 |
| C | 7 | 247 | 1290783 | 7448.87 | 741 | 743 | 173.2 |
| C | 14 | 238 | 118512 | 680.01 | 741 | 743 | 173.2 |
| C | 9 | 54 | 34383 | 194.24 | 741 | 743 | 173.2 |
| D | 1 | 3 | 600776 | 3293.48 | 753 | 732 | 182.2 |
| D | 8 | 195 | 453922 | 2487.44 | 753 | 732 | 182.2 |
| D | 7 | 238 | 88302 | 480.65 | 753 | 732 | 182.2 |
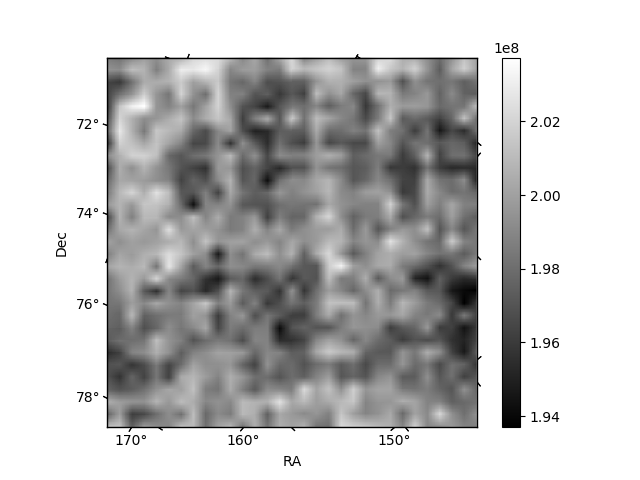
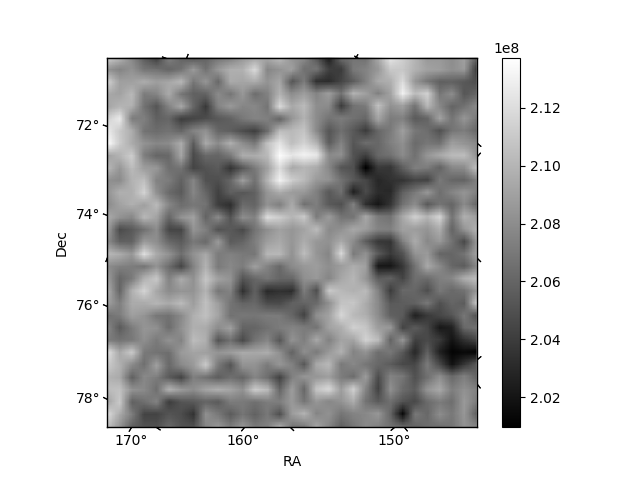
Histogram calculated using DETX and DETY for each event in the final _common_clean file
| Quadrant A | 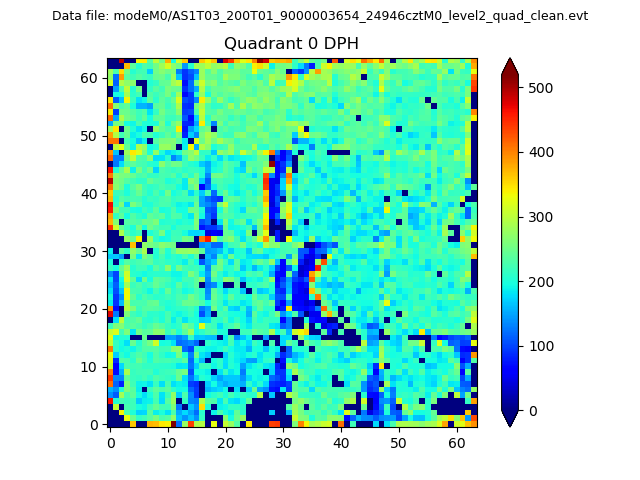 |
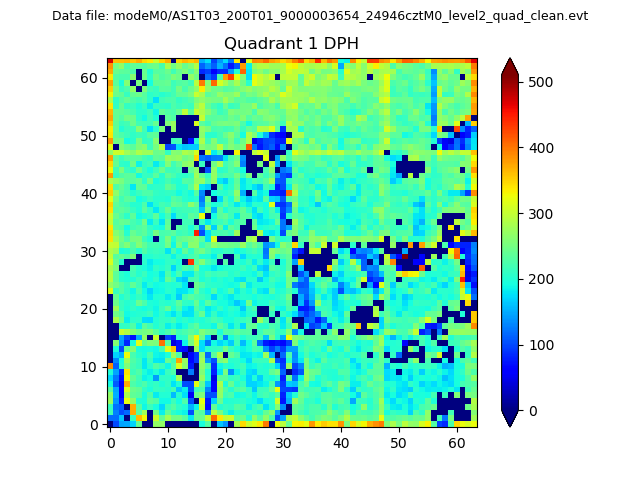 |
Quadrant B |
|---|---|---|---|
| Quadrant D | 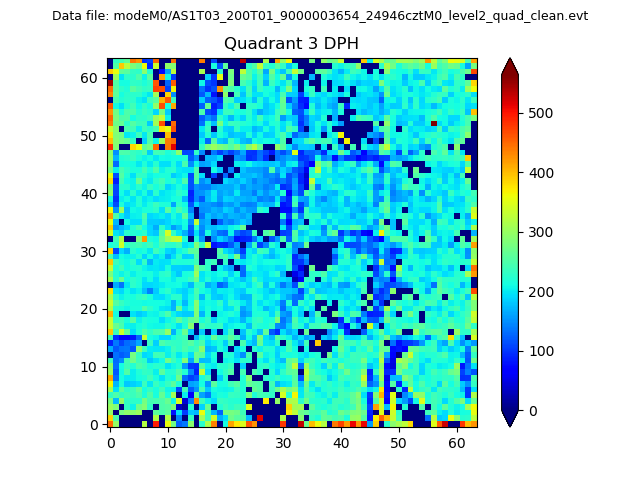 |
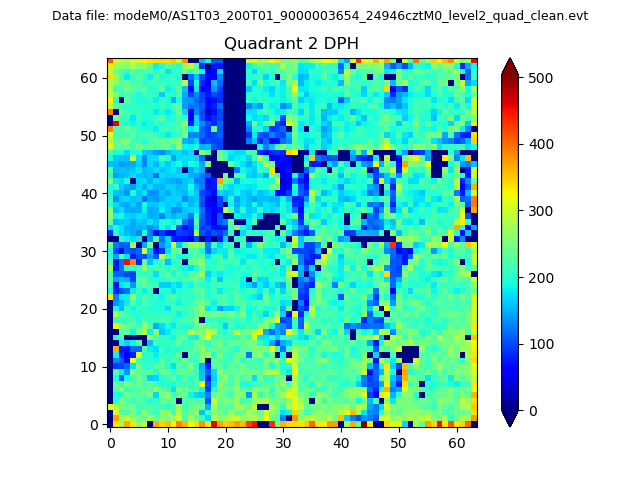 |
Quadrant C |
| Plot type | Count rate plots | Images |
|---|---|---|
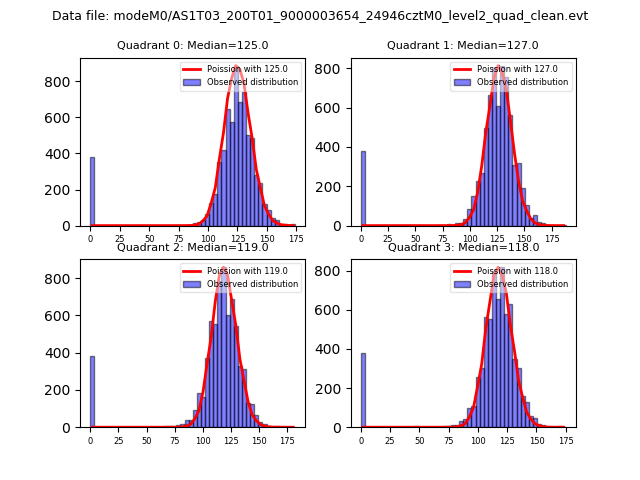
| Comparison with Poisson distribution Blue bars denote a histogram of data divided into 1 sec bins. Red curve is a Poisson curve with rate = median count rate of data. |
 |
 |
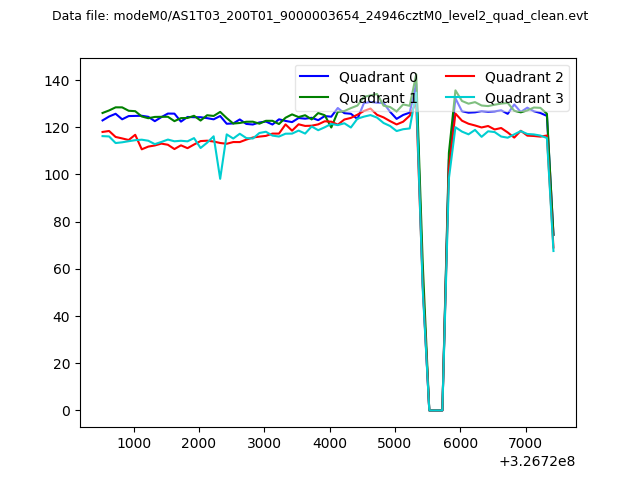
| Quadrant-wise count rates Data is divided into 100 sec bins |
 |
|
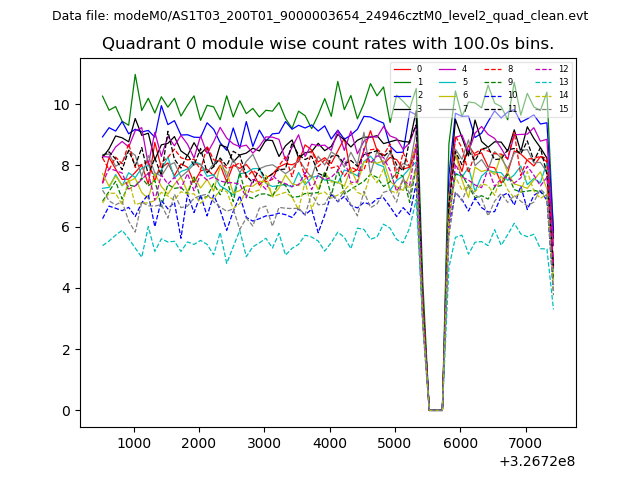
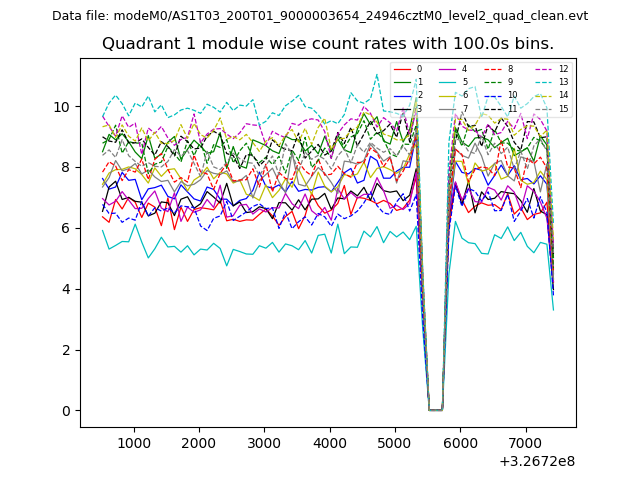
| Module-wise count rates for Quadrant A Data is divided into 100 sec bins |
 |
 |
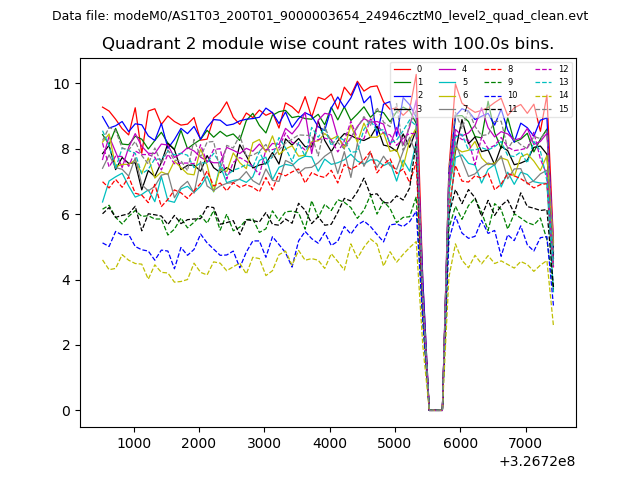
| Module-wise count rates for Quadrant B Data is divided into 100 sec bins |
 |
 |
| Module-wise count rates for Quadrant C Data is divided into 100 sec bins |
 |
 |
| Module-wise count rates for Quadrant D Data is divided into 100 sec bins |
 |
 |
| Parameter | Plot |
|---|---|
| CZT HV Monitor | 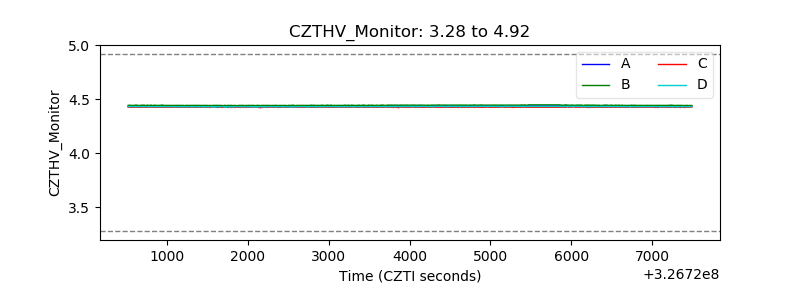 |
| D_VDD | 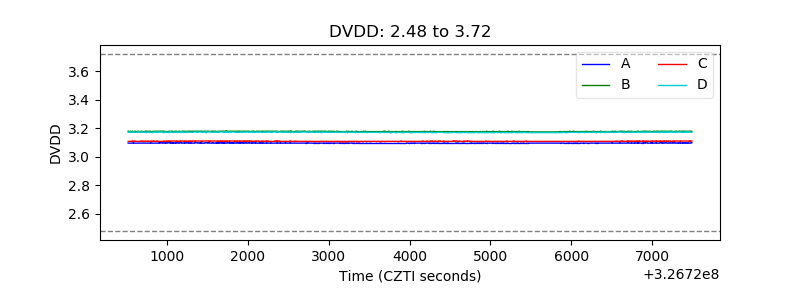 |
| Temperature 1 | 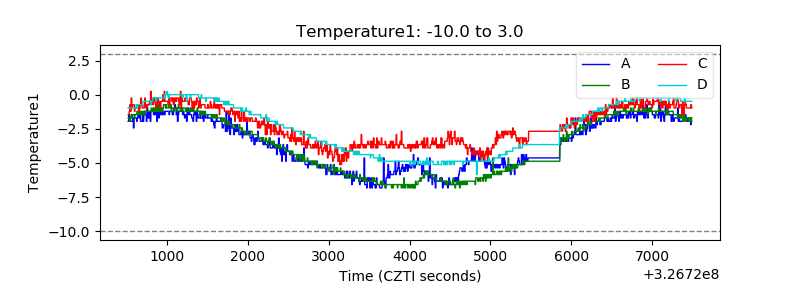 |
| Veto HV Monitor | 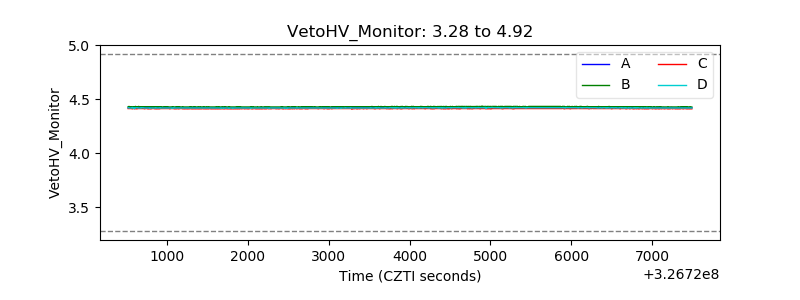 |
| Veto LLD | 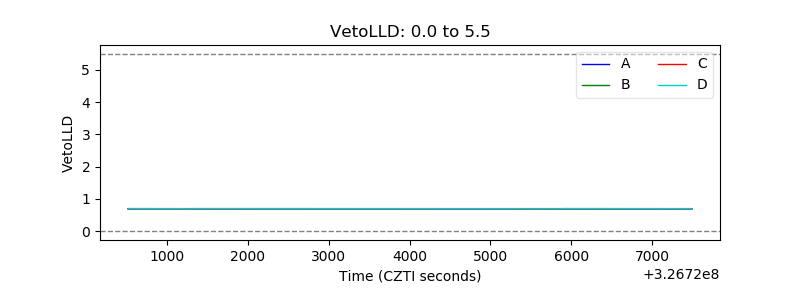 |
| Alpha Counter | 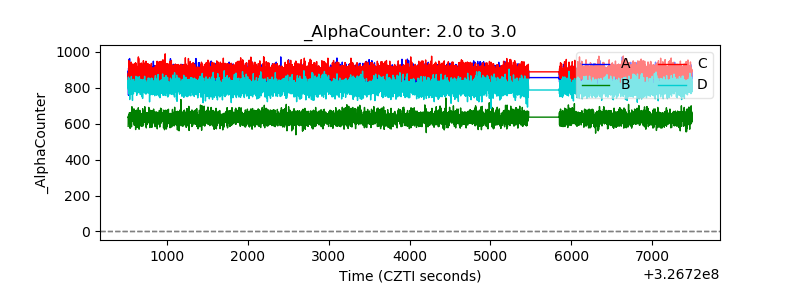 |
| _CPM_Rate | 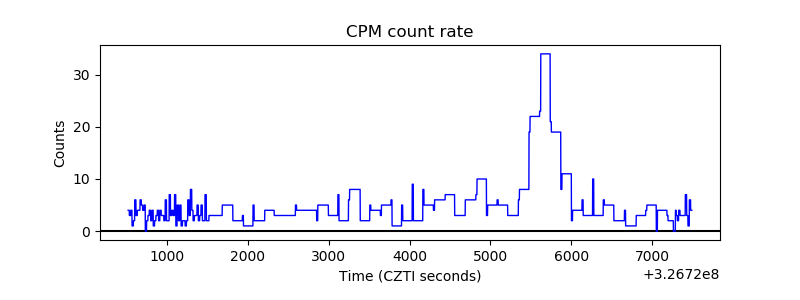 |
| CZT Counter | 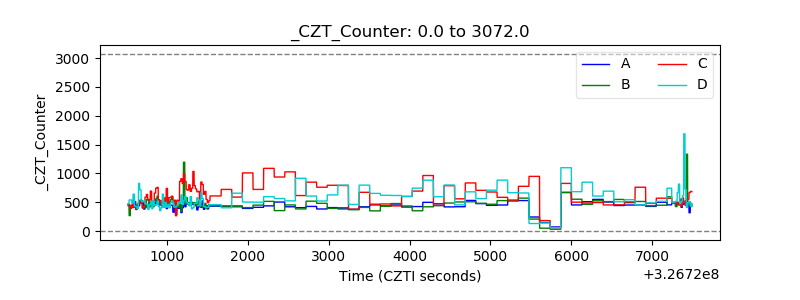 |
| +2.5 Volts monitor |  |
| +5 Volts monitor | 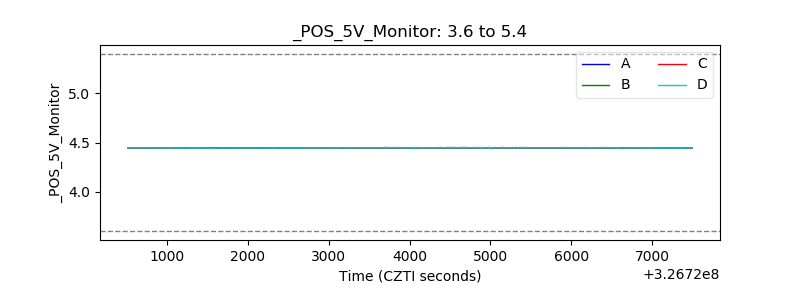 |
| _ROLL_ROT | 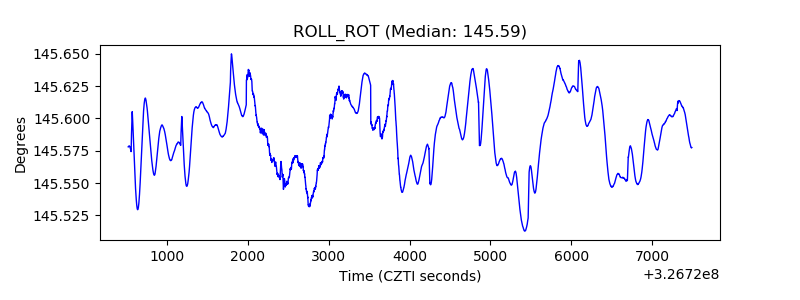 |
| _Roll_DEC | 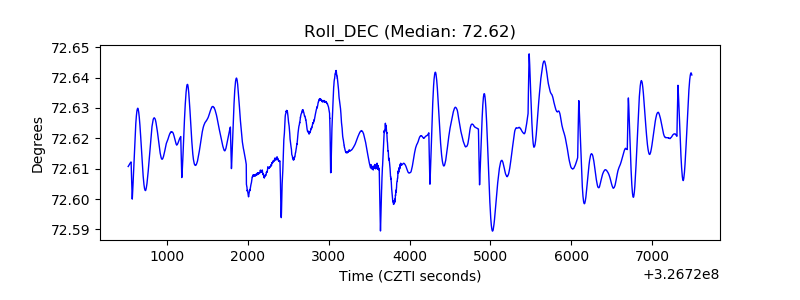 |
| _Roll_RA | 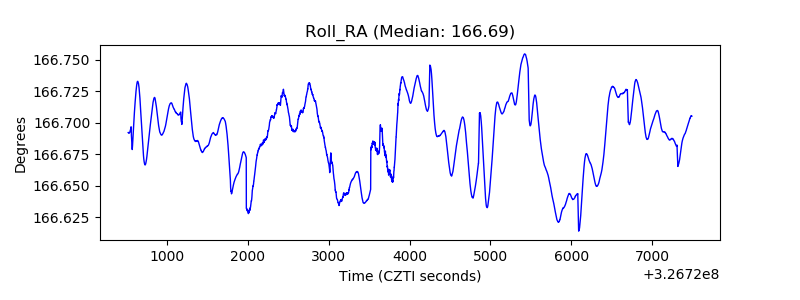 |
| Veto Counter |  |