| Param | Original file | Final file |
|---|---|---|
| Filename | modeM0/AS1T03_200T01_9000003654_24948cztM0_level2.evt | modeM0/AS1T03_200T01_9000003654_24948cztM0_level2_quad_clean.evt |
| Size (bytes) | 891,809,280 | 229,504,320 |
| Size | 850.5 MB | 218.9 MB |
| Events in quadrant A | 5,647,480 | 1,560,631 |
| Events in quadrant B | 6,757,752 | 1,567,715 |
| Events in quadrant C | 6,619,543 | 1,495,160 |
| Events in quadrant D | 7,143,886 | 1,470,083 |
| Mode M9 | |||
|---|---|---|---|
| Quadrant | BADHDUFLAG | Total packets | Discarded packets |
| A | 0 | 14 | 0 |
| B | 0 | 14 | 0 |
| C | 0 | 14 | 0 |
| D | 0 | 14 | 0 |
| Mode SS | |||
|---|---|---|---|
| Quadrant | BADHDUFLAG | Total packets | Discarded packets |
| A | 0 | 252 | 0 |
| B | 0 | 252 | 0 |
| C | 0 | 252 | 0 |
| D | 0 | 252 | 0 |
| Mode M0 | |||
|---|---|---|---|
| Quadrant | BADHDUFLAG | Total packets | Discarded packets |
| A | 0 | 25194 | 2 |
| B | 0 | 28362 | 2 |
| C | 0 | 27608 | 2 |
| D | 0 | 29447 | 2 |
| Quadrant | Total seconds | Saturated seconds | Saturation percentage |
|---|---|---|---|
| A | 12415 | 60 | 0.483286% |
| B | 12415 | 210 | 1.691502% |
| C | 12415 | 230 | 1.852598% |
| D | 12415 | 99 | 0.797422% |
Noise dominated data is calculated using 1-second bins in cleaned event files. If a bin has >2000 counts, and if more than 50% of those come from <1% of pixels, then it is considered to be noise-dominated and hence unusable.
| Quadrant | # 1 sec bins | Bins with >0 counts | Bins with >2000 counts | High rate bins dominated by noise | Noise dominated (total time) | Noise dominated (detector-on time) | Marked lightcurve |
|---|---|---|---|---|---|---|---|
| A | 13790 | 12417 | 0 | 0 | 0.00% | 0.00% | 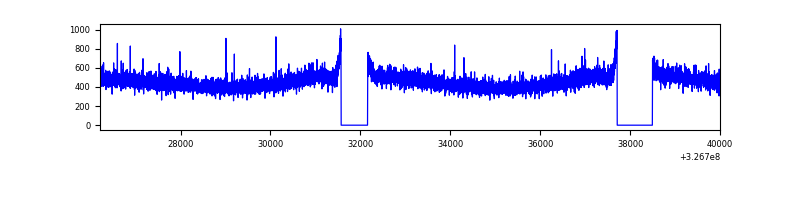 |
| B | 13790 | 12417 | 82 | 82 | 0.59% | 0.66% | 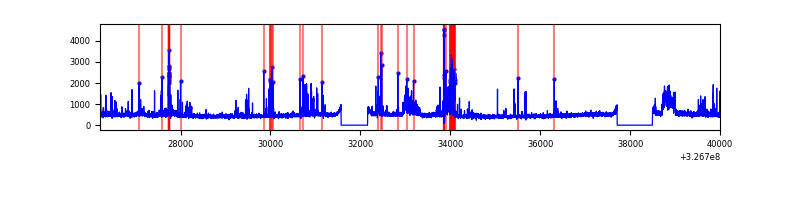 |
| C | 13790 | 12417 | 52 | 52 | 0.38% | 0.42% | 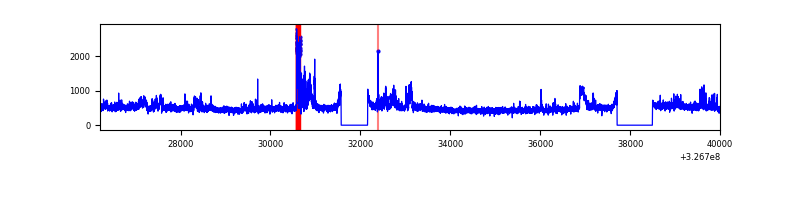 |
| D | 13790 | 12417 | 11 | 11 | 0.08% | 0.09% | 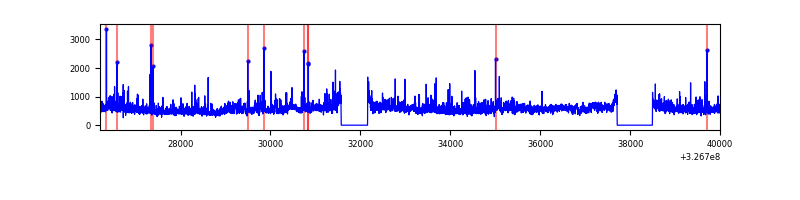 |
Top three noisy pixels from each quadrant. If the there are fewer than three noisy pixels in the level2.evt file, extra rows are filled as -1
| Pixel properties | Quadrant properties | ||||||
|---|---|---|---|---|---|---|---|
| Quadrant | DetID | PixID | Counts | Sigma | Mean | Median | Sigma |
| A | 13 | 254 | 21213 | 67.1 | 1461 | 1429 | 294.9 |
| A | 3 | 137 | 13035 | 39.36 | 1461 | 1429 | 294.9 |
| A | 0 | 226 | 12542 | 37.69 | 1461 | 1429 | 294.9 |
| B | 15 | 33 | 348269 | 1271.71 | 1450 | 1413 | 272.7 |
| B | 3 | 64 | 293685 | 1071.58 | 1450 | 1413 | 272.7 |
| B | 4 | 80 | 185548 | 675.11 | 1450 | 1413 | 272.7 |
| C | 7 | 247 | 917105 | 2799.18 | 1400 | 1408 | 327.1 |
| C | 14 | 238 | 222042 | 674.45 | 1400 | 1408 | 327.1 |
| C | 3 | 233 | 11010 | 29.35 | 1400 | 1408 | 327.1 |
| D | 1 | 3 | 1043432 | 3037.9 | 1423 | 1381 | 343.0 |
| D | 8 | 195 | 316821 | 919.6 | 1423 | 1381 | 343.0 |
| D | 1 | 52 | 243365 | 705.46 | 1423 | 1381 | 343.0 |
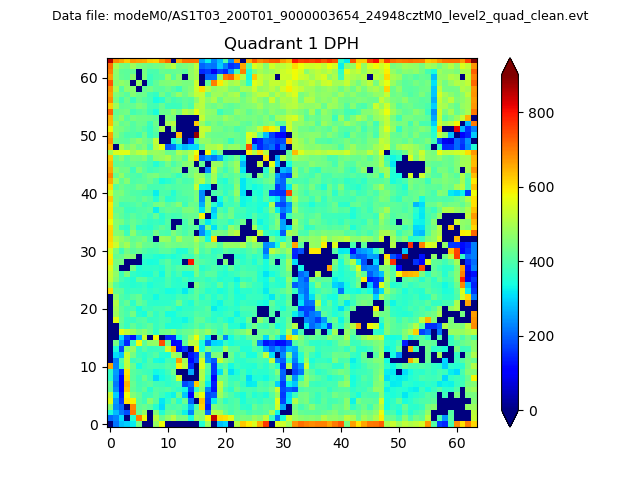
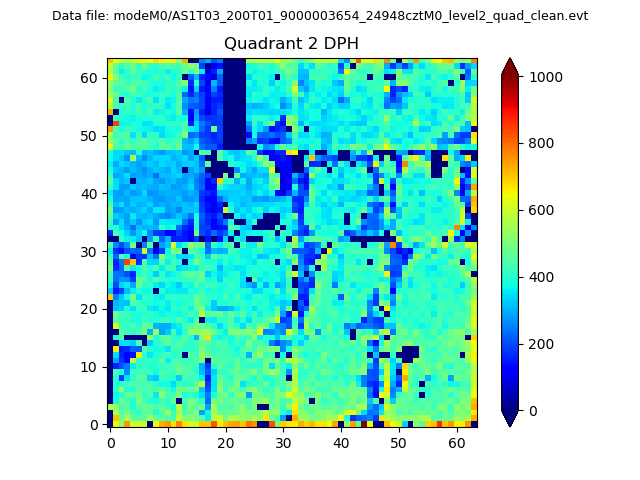
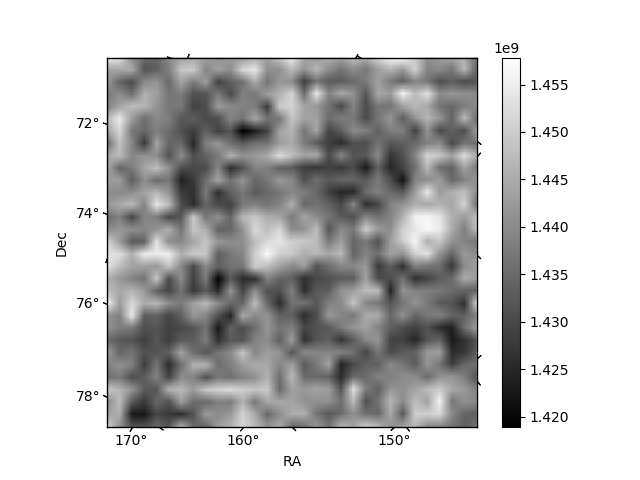
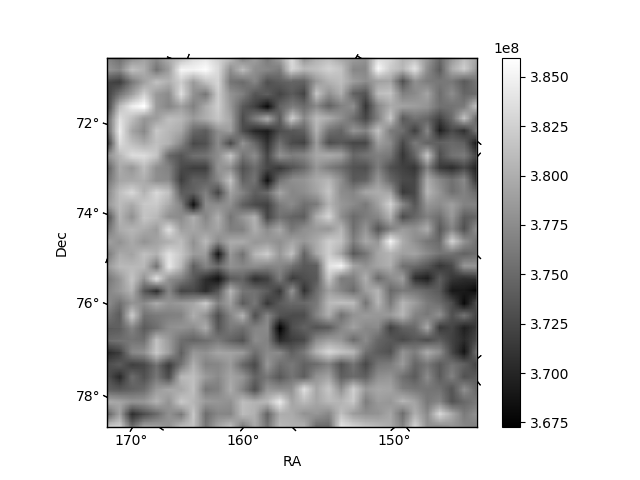
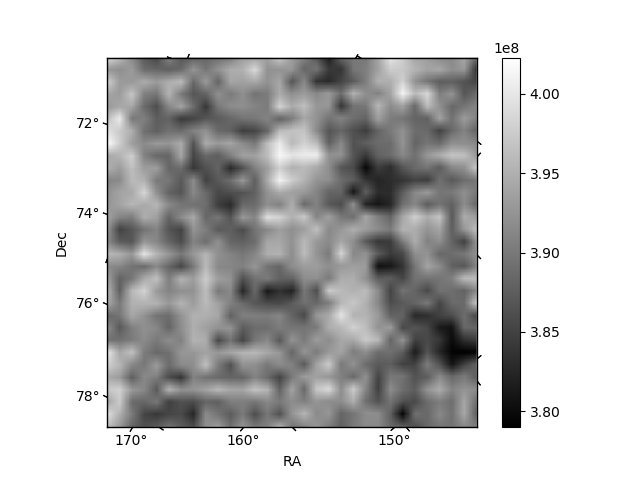
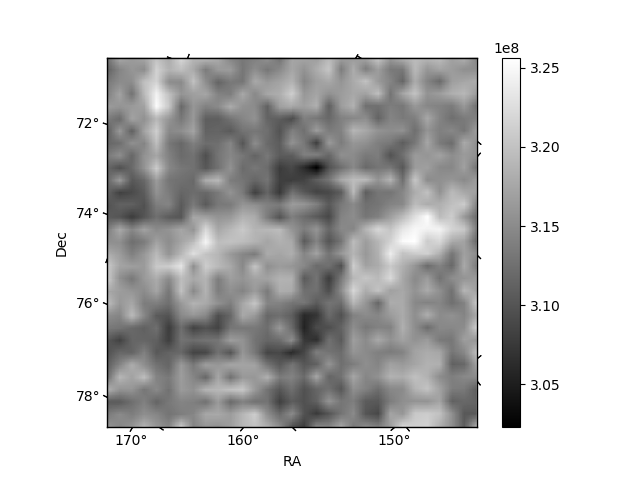
Histogram calculated using DETX and DETY for each event in the final _common_clean file
| Quadrant A |  |
 |
Quadrant B |
|---|---|---|---|
| Quadrant D | 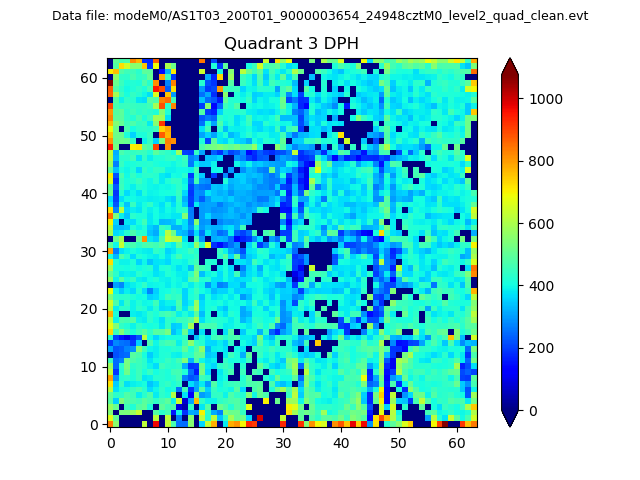 |
 |
Quadrant C |
| Plot type | Count rate plots | Images |
|---|---|---|
| Comparison with Poisson distribution Blue bars denote a histogram of data divided into 1 sec bins. Red curve is a Poisson curve with rate = median count rate of data. |
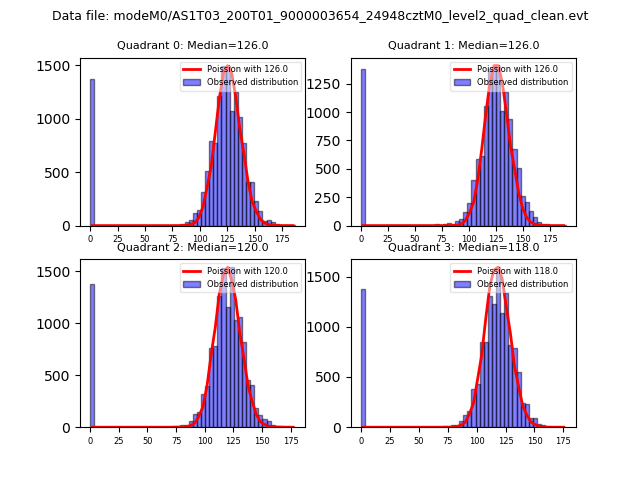 |
 |
| Quadrant-wise count rates Data is divided into 100 sec bins |
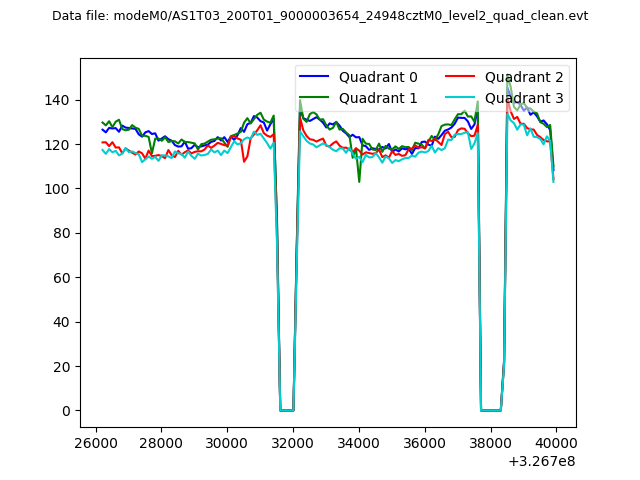 |
|
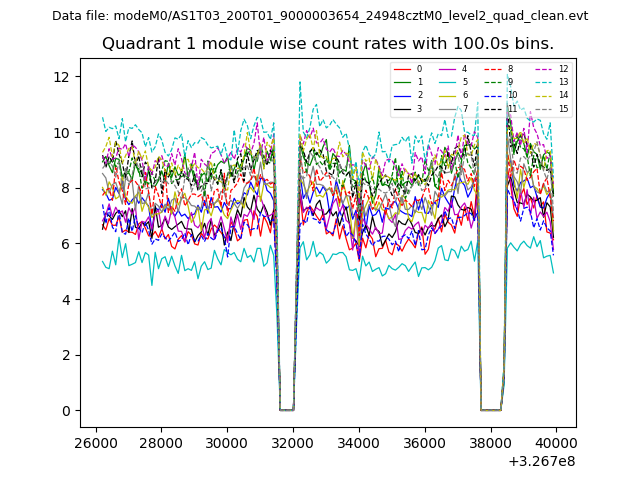
| Module-wise count rates for Quadrant A Data is divided into 100 sec bins |
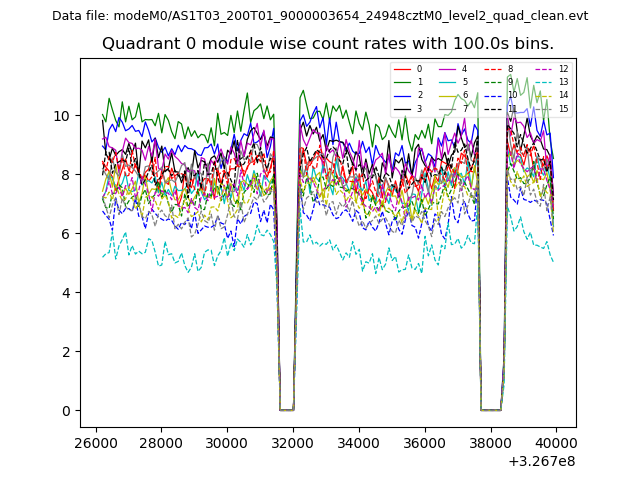 |
 |
| Module-wise count rates for Quadrant B Data is divided into 100 sec bins |
 |
 |
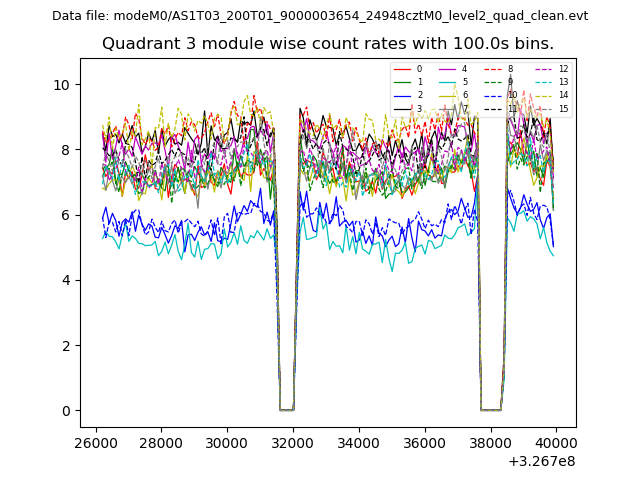
| Module-wise count rates for Quadrant C Data is divided into 100 sec bins |
 |
 |
| Module-wise count rates for Quadrant D Data is divided into 100 sec bins |
 |
 |
| Parameter | Plot |
|---|---|
| CZT HV Monitor |  |
| D_VDD | 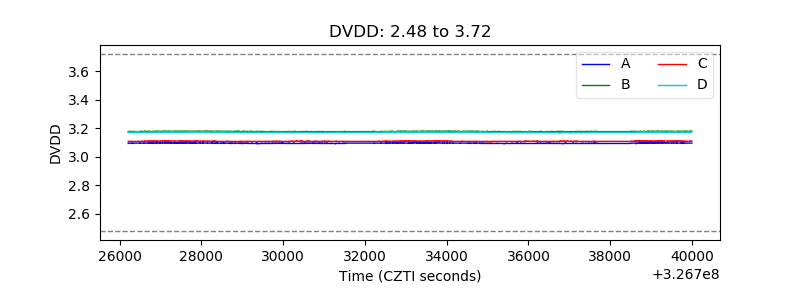 |
| Temperature 1 | 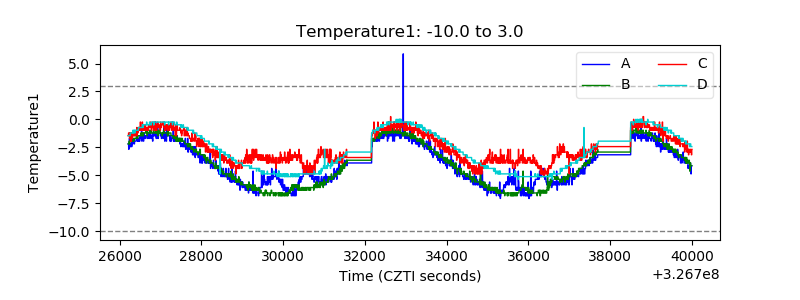 |
| Veto HV Monitor | 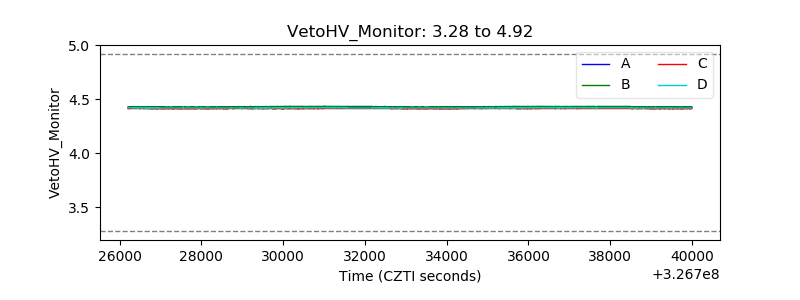 |
| Veto LLD | 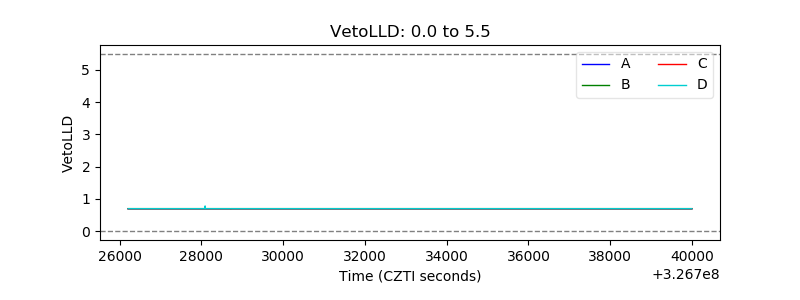 |
| Alpha Counter | 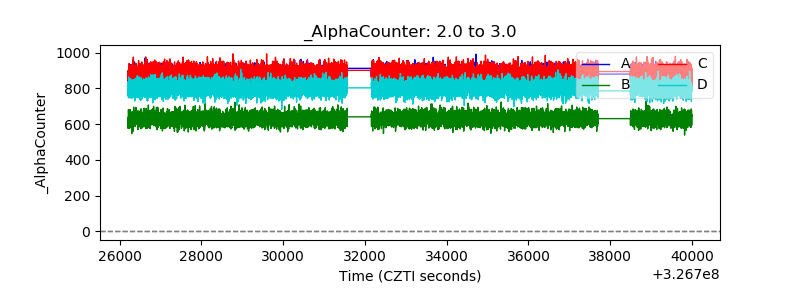 |
| _CPM_Rate | 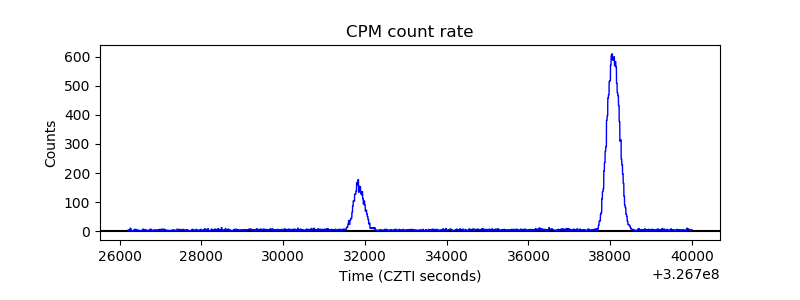 |
| CZT Counter | 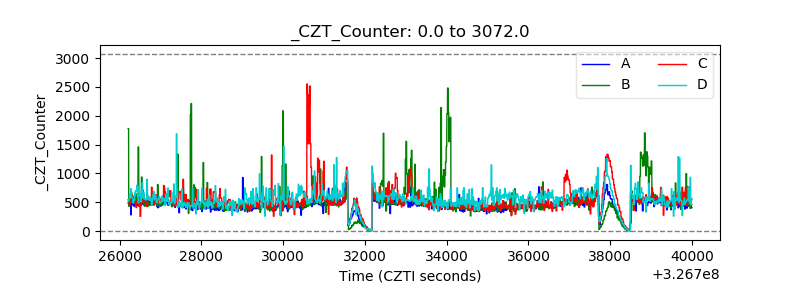 |
| +2.5 Volts monitor |  |
| +5 Volts monitor |  |
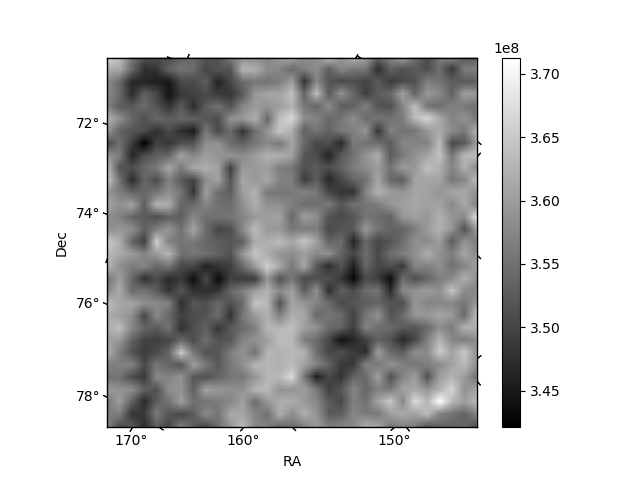
| _ROLL_ROT | 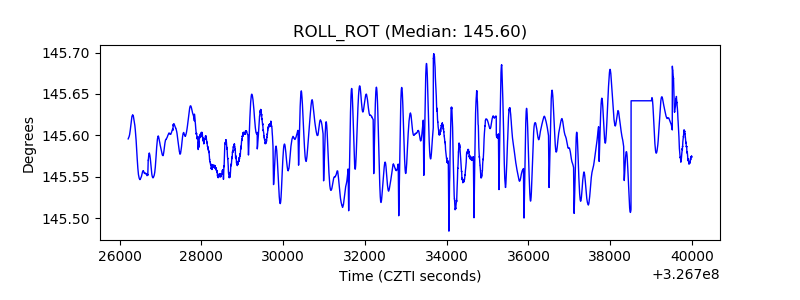 |
| _Roll_DEC | 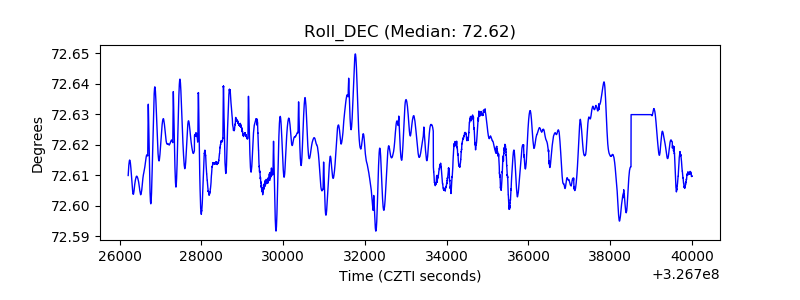 |
| _Roll_RA | 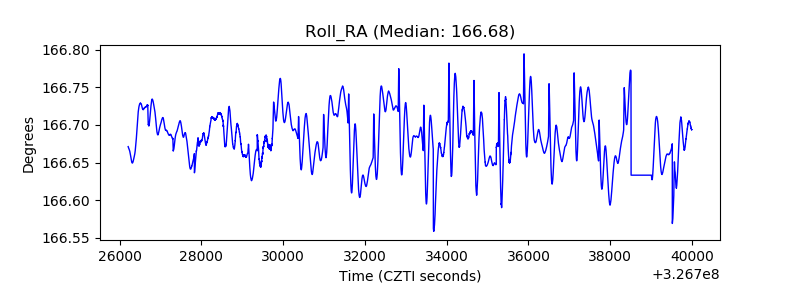 |
| Veto Counter | 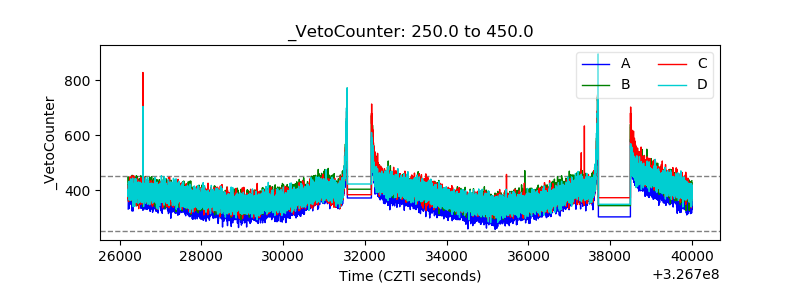 |