| Param | Original file | Final file |
|---|---|---|
| Filename | modeM0/AS1T03_200T01_9000003654_24950cztM0_level2.evt | modeM0/AS1T03_200T01_9000003654_24950cztM0_level2_quad_clean.evt |
| Size (bytes) | 462,873,600 | 127,486,080 |
| Size | 441.4 MB | 121.6 MB |
| Events in quadrant A | 3,089,957 | 861,515 |
| Events in quadrant B | 3,348,610 | 882,073 |
| Events in quadrant C | 3,191,399 | 850,069 |
| Events in quadrant D | 3,951,191 | 818,890 |
| Mode M9 | |||
|---|---|---|---|
| Quadrant | BADHDUFLAG | Total packets | Discarded packets |
| A | 0 | 15 | 0 |
| B | 0 | 16 | 0 |
| C | 0 | 16 | 0 |
| D | 0 | 16 | 0 |
| Mode SS | |||
|---|---|---|---|
| Quadrant | BADHDUFLAG | Total packets | Discarded packets |
| A | 0 | 132 | 0 |
| B | 0 | 132 | 0 |
| C | 0 | 132 | 0 |
| D | 0 | 132 | 0 |
| Mode M0 | |||
|---|---|---|---|
| Quadrant | BADHDUFLAG | Total packets | Discarded packets |
| A | 0 | 13520 | 2 |
| B | 0 | 14347 | 2 |
| C | 0 | 13804 | 2 |
| D | 0 | 16276 | 2 |
| Quadrant | Total seconds | Saturated seconds | Saturation percentage |
|---|---|---|---|
| A | 6430 | 20 | 0.311042% |
| B | 6429 | 71 | 1.104371% |
| C | 6429 | 85 | 1.322134% |
| D | 6429 | 49 | 0.762171% |
Noise dominated data is calculated using 1-second bins in cleaned event files. If a bin has >2000 counts, and if more than 50% of those come from <1% of pixels, then it is considered to be noise-dominated and hence unusable.
| Quadrant | # 1 sec bins | Bins with >0 counts | Bins with >2000 counts | High rate bins dominated by noise | Noise dominated (total time) | Noise dominated (detector-on time) | Marked lightcurve |
|---|---|---|---|---|---|---|---|
| A | 7545 | 6431 | 8 | 8 | 0.11% | 0.12% | 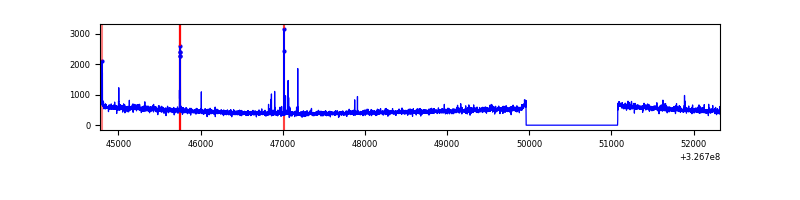 |
| B | 7544 | 6430 | 22 | 22 | 0.29% | 0.34% | 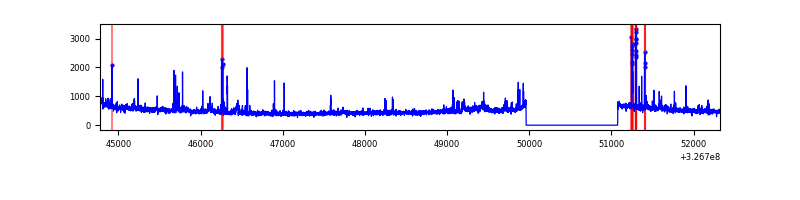 |
| C | 7544 | 6430 | 1 | 1 | 0.01% | 0.02% | 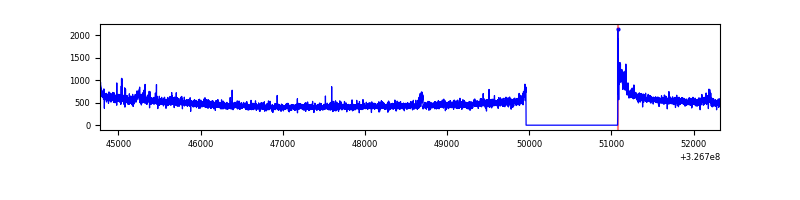 |
| D | 7544 | 6430 | 17 | 17 | 0.23% | 0.26% | 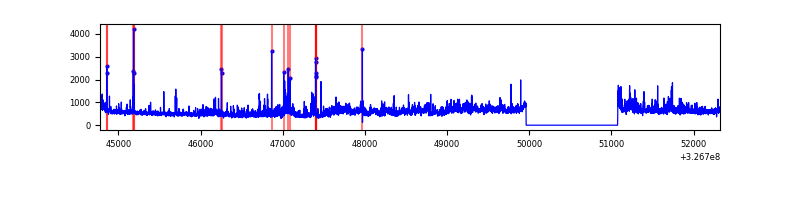 |
Top three noisy pixels from each quadrant. If the there are fewer than three noisy pixels in the level2.evt file, extra rows are filled as -1
| Pixel properties | Quadrant properties | ||||||
|---|---|---|---|---|---|---|---|
| Quadrant | DetID | PixID | Counts | Sigma | Mean | Median | Sigma |
| A | 6 | 16 | 47804 | 302.77 | 776 | 757 | 155.4 |
| A | 4 | 2 | 45827 | 290.04 | 776 | 757 | 155.4 |
| A | 13 | 254 | 10528 | 62.88 | 776 | 757 | 155.4 |
| B | 5 | 172 | 80558 | 548.97 | 782 | 763 | 145.4 |
| B | 0 | 230 | 59460 | 403.82 | 782 | 763 | 145.4 |
| B | 3 | 64 | 39065 | 263.51 | 782 | 763 | 145.4 |
| C | 14 | 238 | 120719 | 677.34 | 761 | 765 | 177.1 |
| C | 7 | 247 | 78863 | 440.99 | 761 | 765 | 177.1 |
| C | 2 | 16 | 11528 | 60.78 | 761 | 765 | 177.1 |
| D | 8 | 195 | 439182 | 2402.8 | 763 | 739 | 182.5 |
| D | 1 | 3 | 371505 | 2031.91 | 763 | 739 | 182.5 |
| D | 1 | 52 | 194593 | 1062.38 | 763 | 739 | 182.5 |
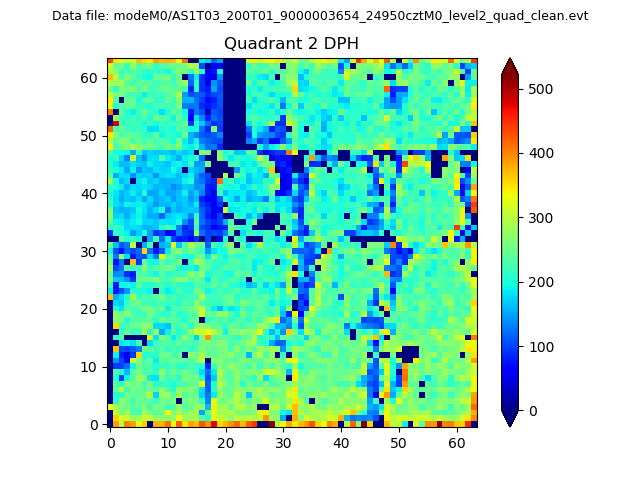
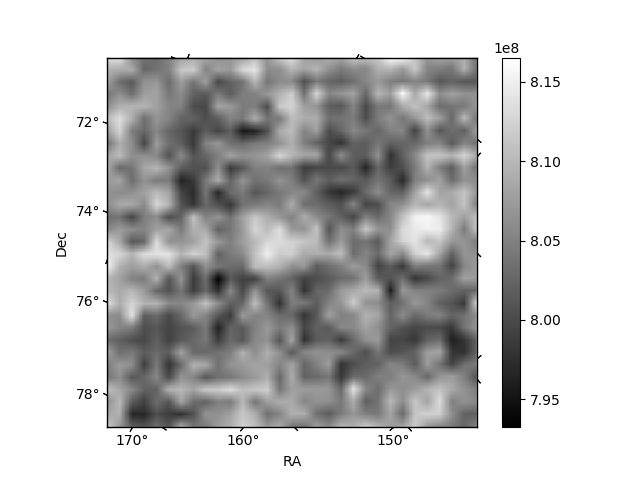
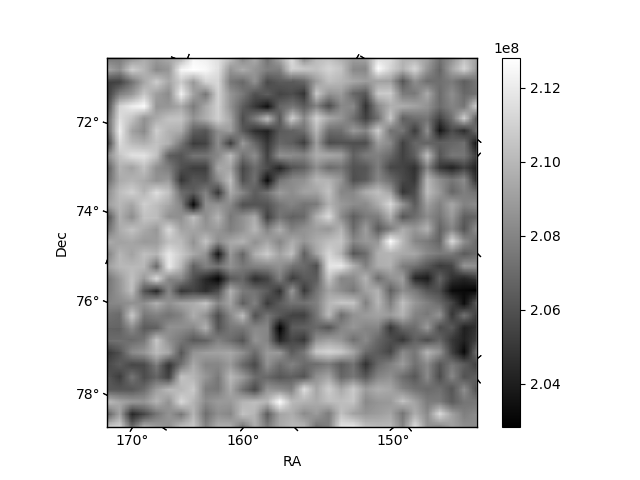
Histogram calculated using DETX and DETY for each event in the final _common_clean file
| Quadrant A | 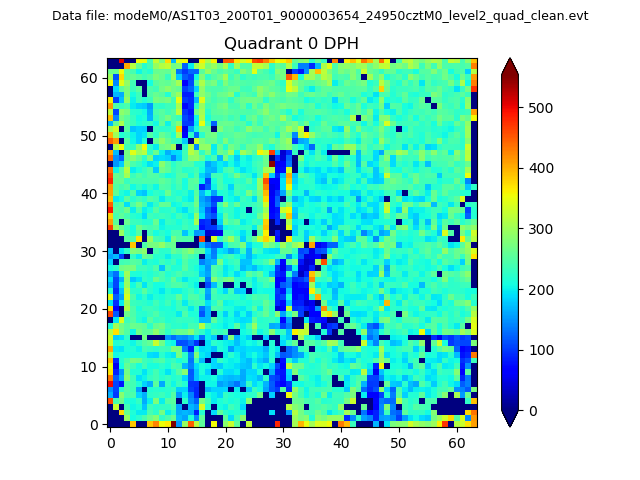 |
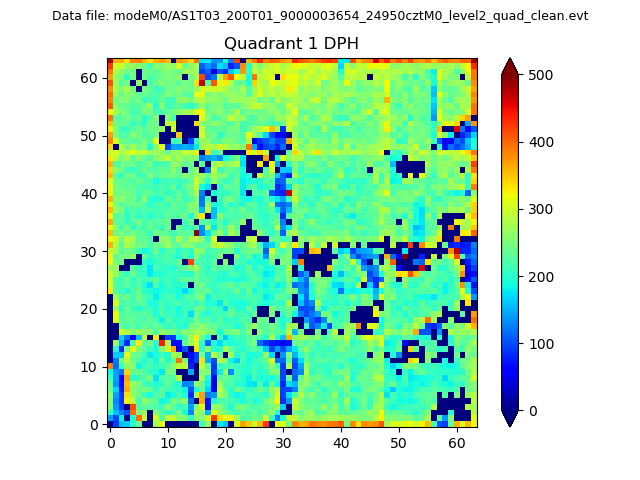 |
Quadrant B |
|---|---|---|---|
| Quadrant D | 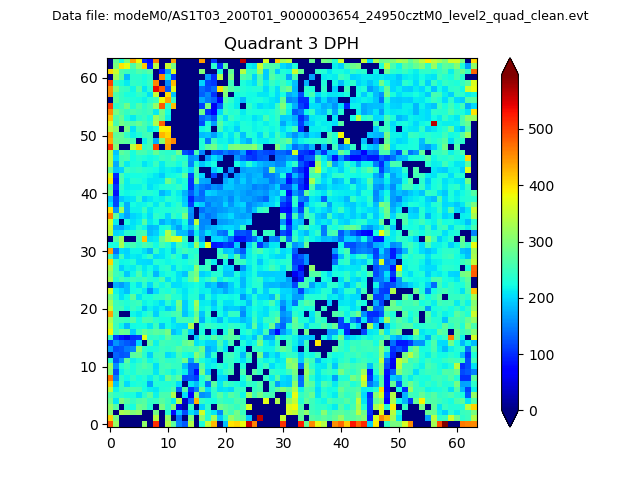 |
 |
Quadrant C |
| Plot type | Count rate plots | Images |
|---|---|---|
| Comparison with Poisson distribution Blue bars denote a histogram of data divided into 1 sec bins. Red curve is a Poisson curve with rate = median count rate of data. |
 |
 |
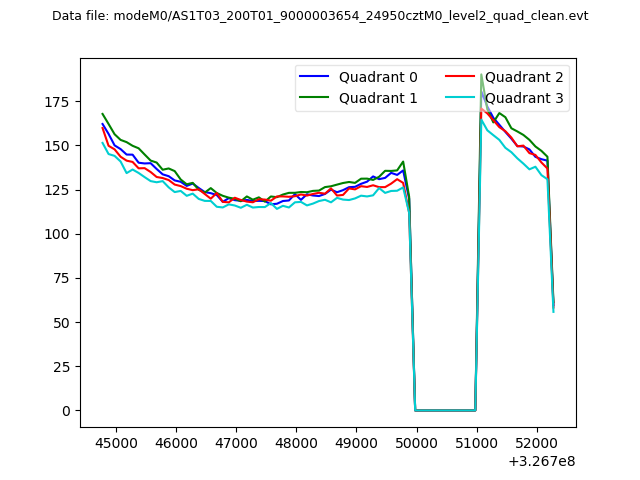
| Quadrant-wise count rates Data is divided into 100 sec bins |
 |
|
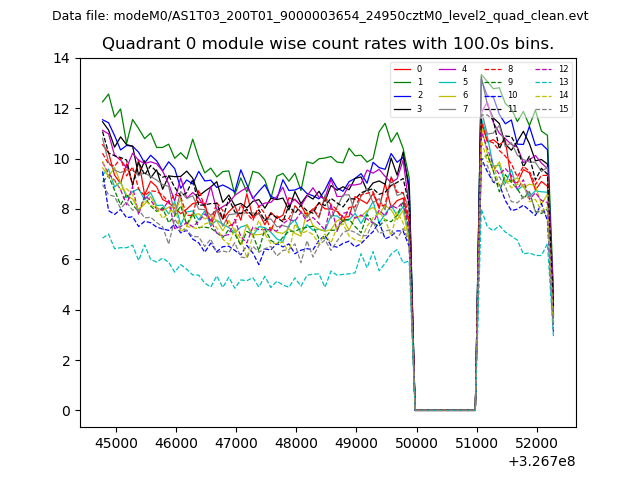
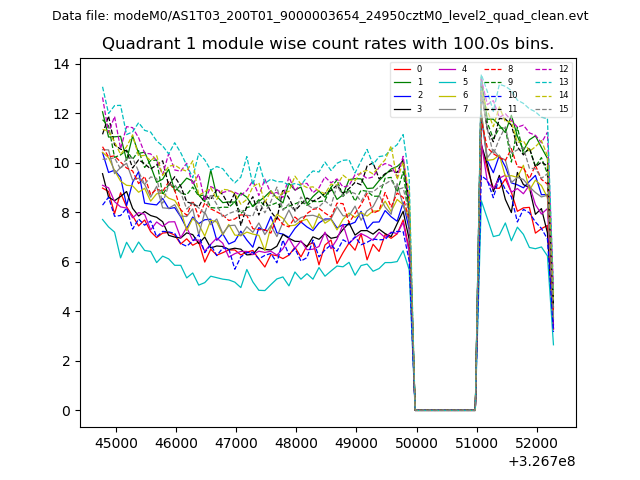
| Module-wise count rates for Quadrant A Data is divided into 100 sec bins |
 |
 |
| Module-wise count rates for Quadrant B Data is divided into 100 sec bins |
 |
 |
| Module-wise count rates for Quadrant C Data is divided into 100 sec bins |
 |
 |
| Module-wise count rates for Quadrant D Data is divided into 100 sec bins |
 |
 |
| Parameter | Plot |
|---|---|
| CZT HV Monitor |  |
| D_VDD | 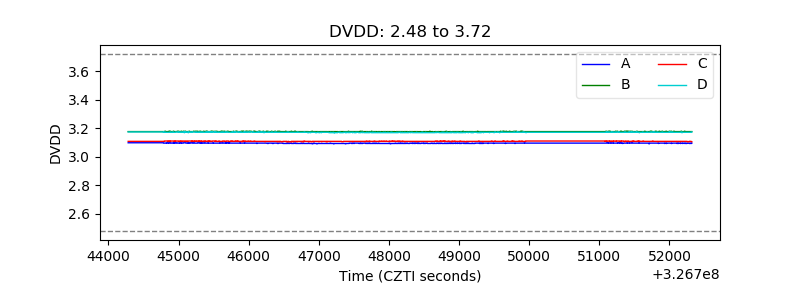 |
| Temperature 1 | 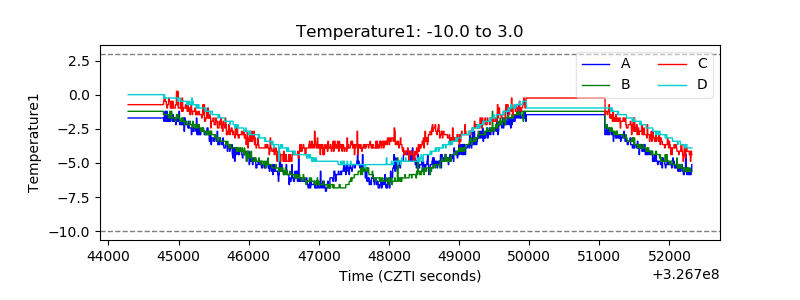 |
| Veto HV Monitor | 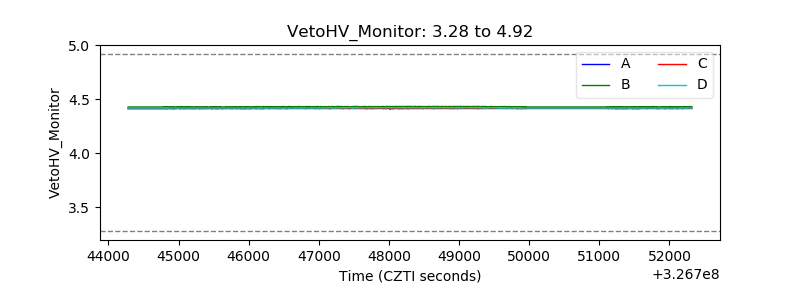 |
| Veto LLD | 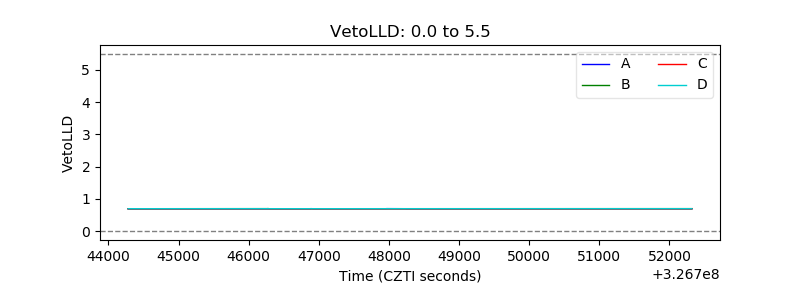 |
| Alpha Counter | 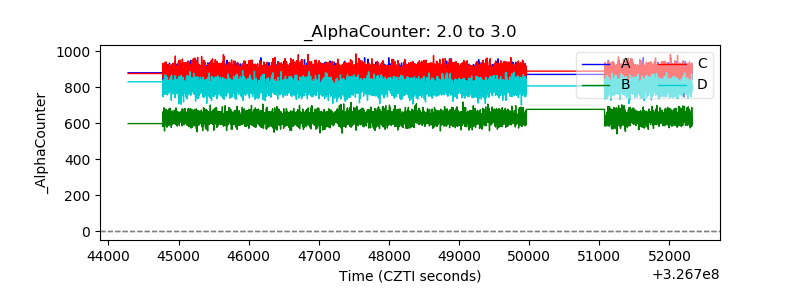 |
| _CPM_Rate | 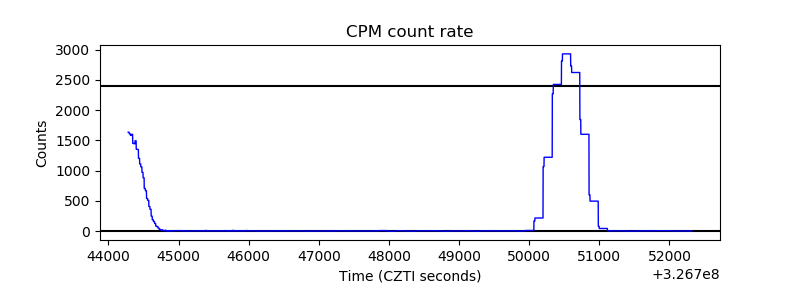 |
| CZT Counter | 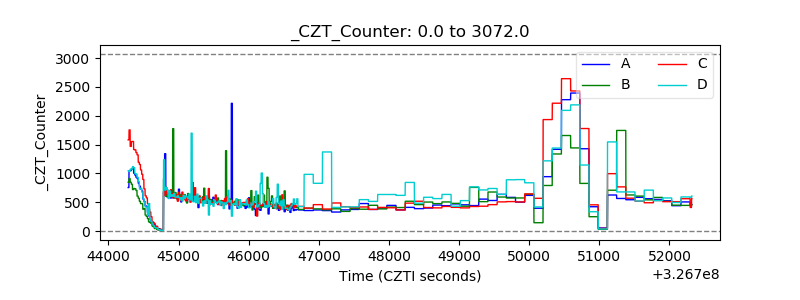 |
| +2.5 Volts monitor |  |
| +5 Volts monitor |  |
| _ROLL_ROT |  |
| _Roll_DEC | 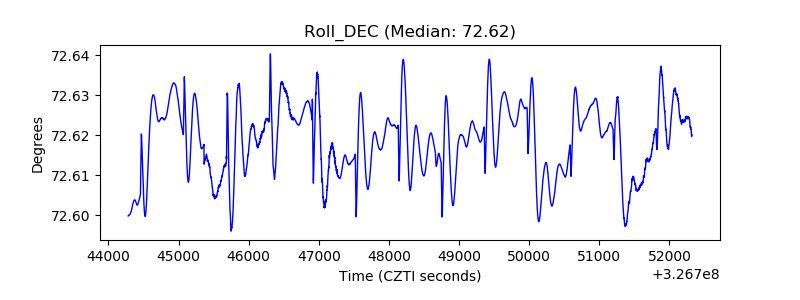 |
| _Roll_RA | 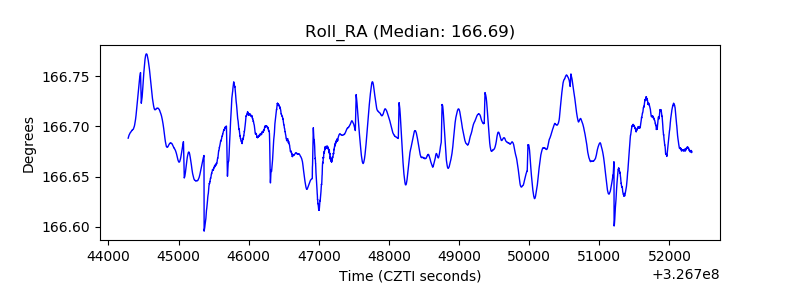 |
| Veto Counter | 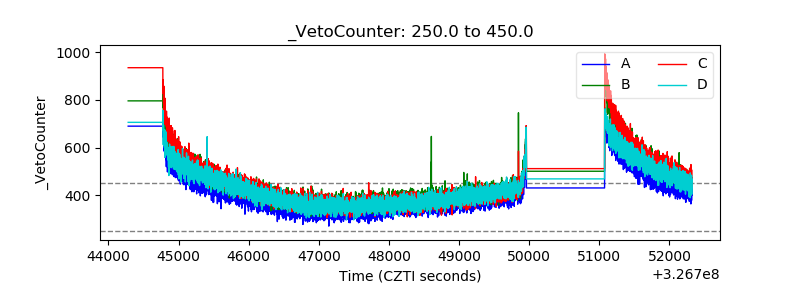 |