| Param | Original file | Final file |
|---|---|---|
| Filename | modeM0/AS1T03_200T01_9000003654_24953cztM0_level2.evt | modeM0/AS1T03_200T01_9000003654_24953cztM0_level2_quad_clean.evt |
| Size (bytes) | 470,715,840 | 133,246,080 |
| Size | 448.9 MB | 127.1 MB |
| Events in quadrant A | 3,017,426 | 912,049 |
| Events in quadrant B | 3,375,054 | 943,579 |
| Events in quadrant C | 3,388,822 | 900,335 |
| Events in quadrant D | 4,056,310 | 849,993 |
| Mode M9 | |||
|---|---|---|---|
| Quadrant | BADHDUFLAG | Total packets | Discarded packets |
| A | 0 | 17 | 0 |
| B | 0 | 17 | 0 |
| C | 0 | 18 | 0 |
| D | 0 | 18 | 0 |
| Mode SS | |||
|---|---|---|---|
| Quadrant | BADHDUFLAG | Total packets | Discarded packets |
| A | 0 | 124 | 0 |
| B | 0 | 124 | 0 |
| C | 0 | 124 | 0 |
| D | 0 | 124 | 0 |
| Mode M0 | |||
|---|---|---|---|
| Quadrant | BADHDUFLAG | Total packets | Discarded packets |
| A | 0 | 12990 | 2 |
| B | 0 | 13971 | 2 |
| C | 0 | 14141 | 2 |
| D | 0 | 16266 | 2 |
| Quadrant | Total seconds | Saturated seconds | Saturation percentage |
|---|---|---|---|
| A | 6164 | 13 | 0.210902% |
| B | 6165 | 62 | 1.005677% |
| C | 6165 | 63 | 1.021898% |
| D | 6164 | 84 | 1.362751% |
Noise dominated data is calculated using 1-second bins in cleaned event files. If a bin has >2000 counts, and if more than 50% of those come from <1% of pixels, then it is considered to be noise-dominated and hence unusable.
| Quadrant | # 1 sec bins | Bins with >0 counts | Bins with >2000 counts | High rate bins dominated by noise | Noise dominated (total time) | Noise dominated (detector-on time) | Marked lightcurve |
|---|---|---|---|---|---|---|---|
| A | 7495 | 6166 | 0 | 0 | 0.00% | 0.00% | 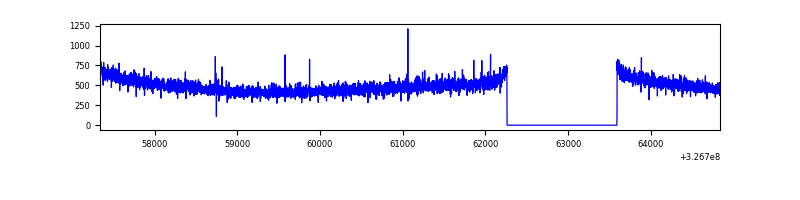 |
| B | 7495 | 6166 | 15 | 15 | 0.20% | 0.24% | 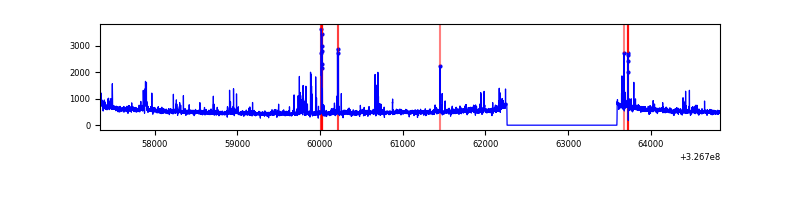 |
| C | 7495 | 6166 | 2 | 2 | 0.03% | 0.03% | 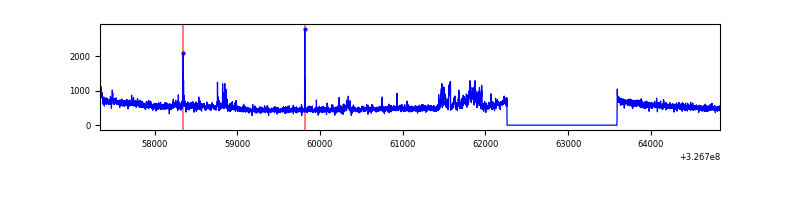 |
| D | 7494 | 6165 | 46 | 46 | 0.61% | 0.75% | 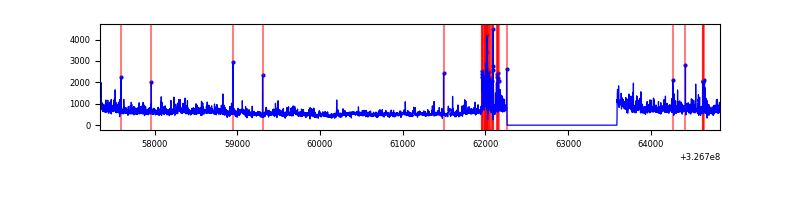 |
Top three noisy pixels from each quadrant. If the there are fewer than three noisy pixels in the level2.evt file, extra rows are filled as -1
| Pixel properties | Quadrant properties | ||||||
|---|---|---|---|---|---|---|---|
| Quadrant | DetID | PixID | Counts | Sigma | Mean | Median | Sigma |
| A | 13 | 254 | 9439 | 56.61 | 780 | 766 | 153.2 |
| A | 0 | 226 | 6759 | 39.11 | 780 | 766 | 153.2 |
| A | 11 | 208 | 6528 | 37.61 | 780 | 766 | 153.2 |
| B | 3 | 64 | 181161 | 1277.59 | 786 | 771 | 141.2 |
| B | 10 | 251 | 24564 | 168.51 | 786 | 771 | 141.2 |
| B | 4 | 80 | 18529 | 125.77 | 786 | 771 | 141.2 |
| C | 7 | 247 | 242645 | 1392.49 | 761 | 768 | 173.7 |
| C | 14 | 238 | 124154 | 710.33 | 761 | 768 | 173.7 |
| C | 7 | 252 | 29413 | 164.91 | 761 | 768 | 173.7 |
| D | 1 | 3 | 473989 | 2635.2 | 751 | 731 | 179.6 |
| D | 8 | 195 | 356390 | 1980.38 | 751 | 731 | 179.6 |
| D | 1 | 52 | 227285 | 1261.5 | 751 | 731 | 179.6 |
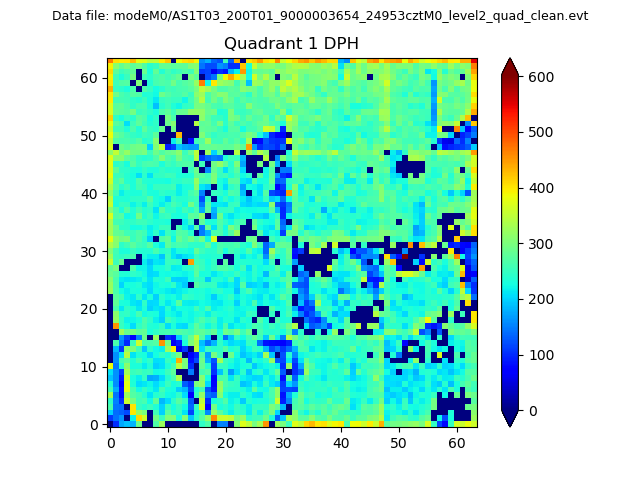
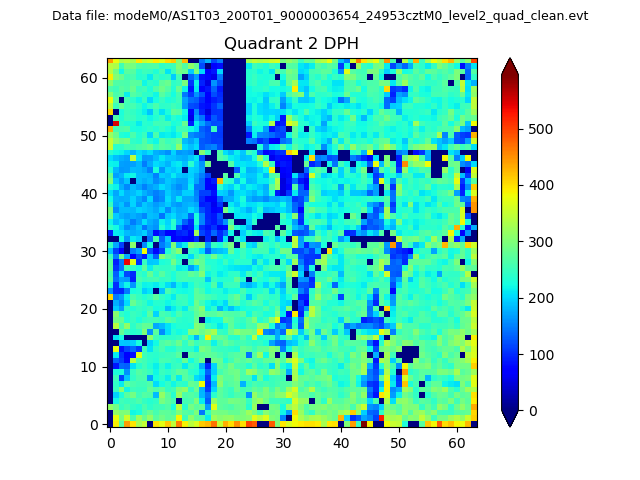
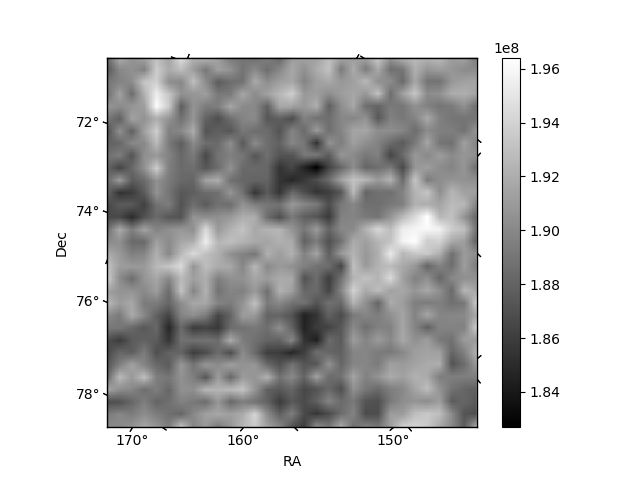
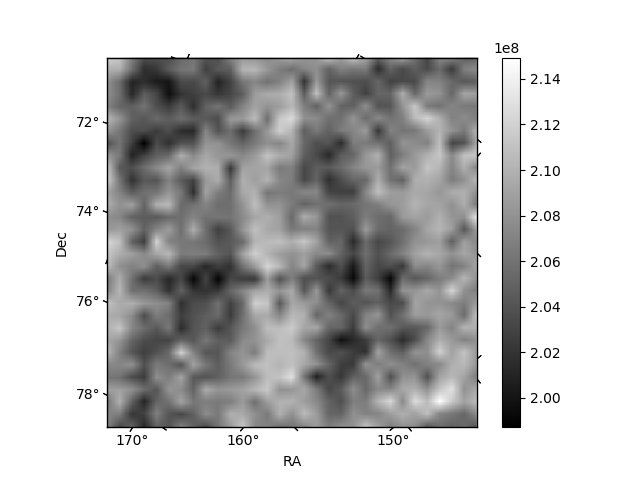
Histogram calculated using DETX and DETY for each event in the final _common_clean file
| Quadrant A |  |
 |
Quadrant B |
|---|---|---|---|
| Quadrant D |  |
 |
Quadrant C |
| Plot type | Count rate plots | Images |
|---|---|---|
| Comparison with Poisson distribution Blue bars denote a histogram of data divided into 1 sec bins. Red curve is a Poisson curve with rate = median count rate of data. |
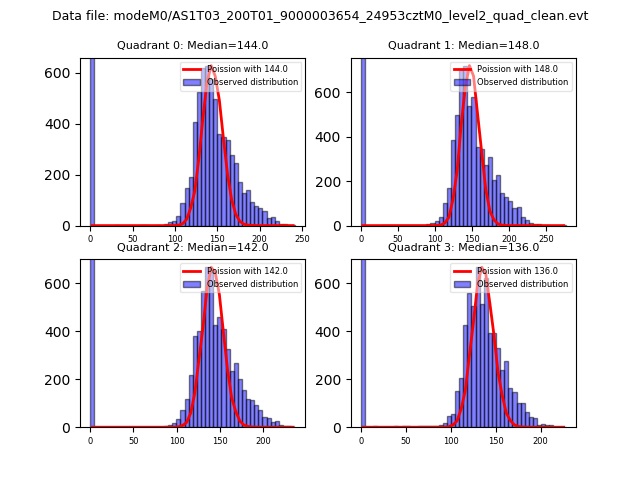 |
 |
| Quadrant-wise count rates Data is divided into 100 sec bins |
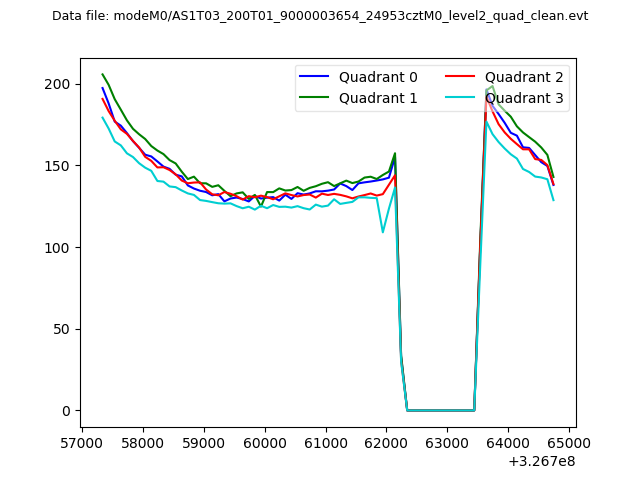 |
|
| Module-wise count rates for Quadrant A Data is divided into 100 sec bins |
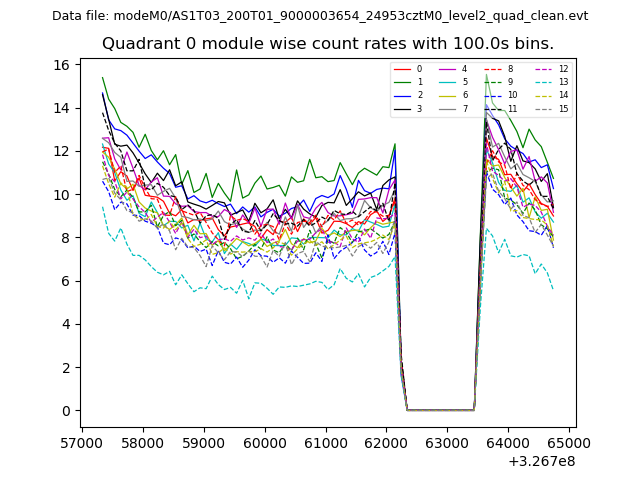 |
 |
| Module-wise count rates for Quadrant B Data is divided into 100 sec bins |
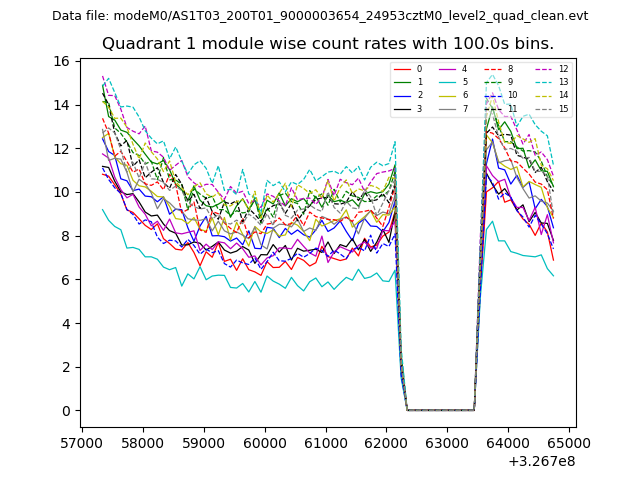 |
 |
| Module-wise count rates for Quadrant C Data is divided into 100 sec bins |
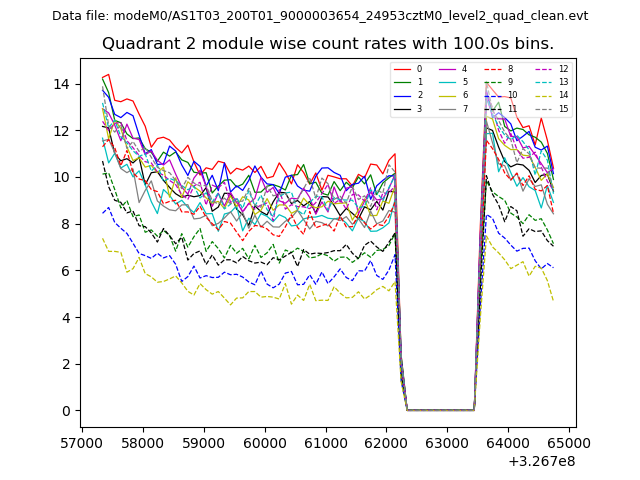 |
 |
| Module-wise count rates for Quadrant D Data is divided into 100 sec bins |
 |
 |
| Parameter | Plot |
|---|---|
| CZT HV Monitor | 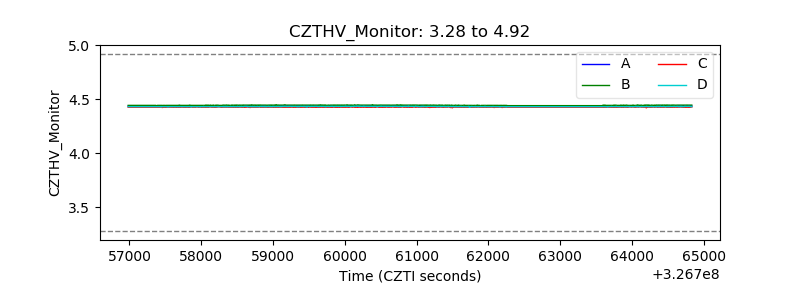 |
| D_VDD | 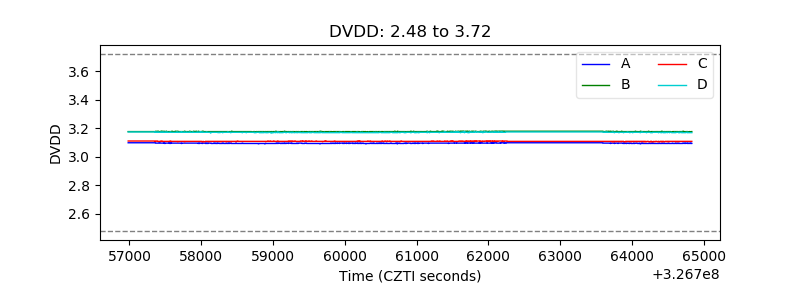 |
| Temperature 1 | 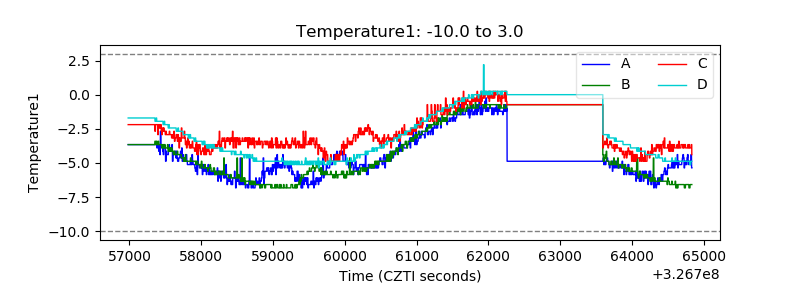 |
| Veto HV Monitor | 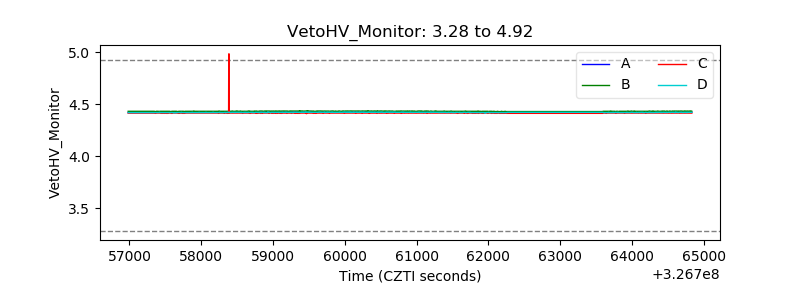 |
| Veto LLD | 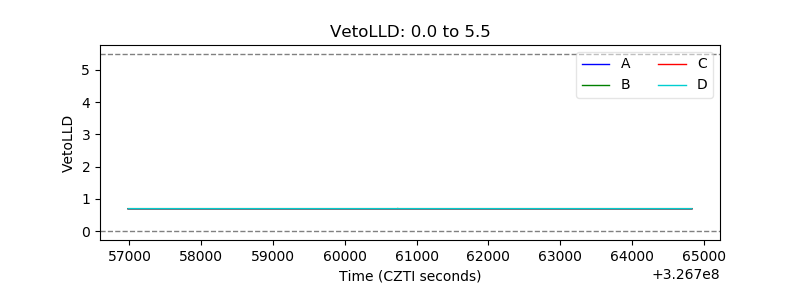 |
| Alpha Counter | 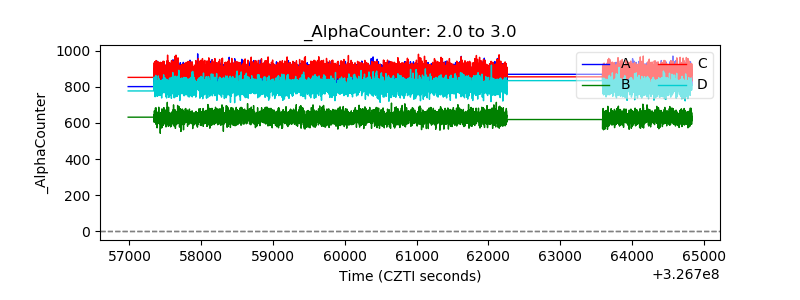 |
| _CPM_Rate |  |
| CZT Counter | 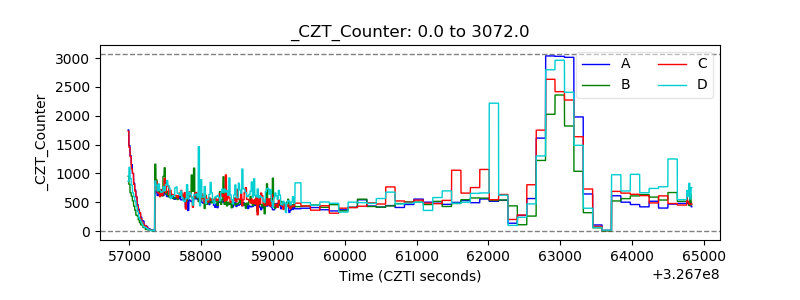 |
| +2.5 Volts monitor | 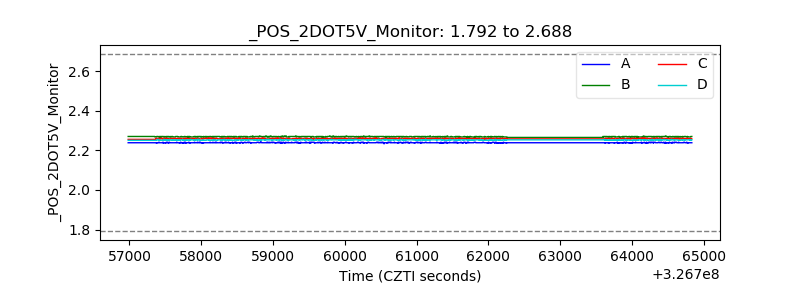 |
| +5 Volts monitor | 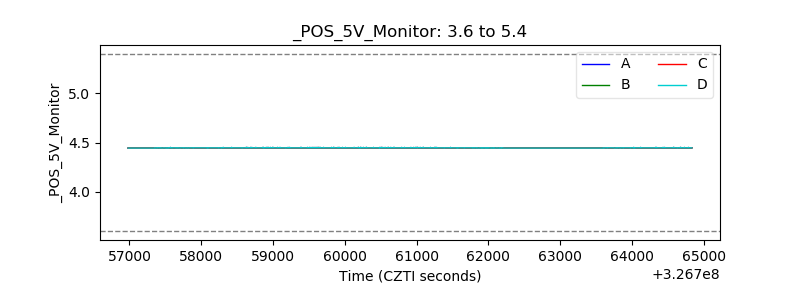 |
| _ROLL_ROT | 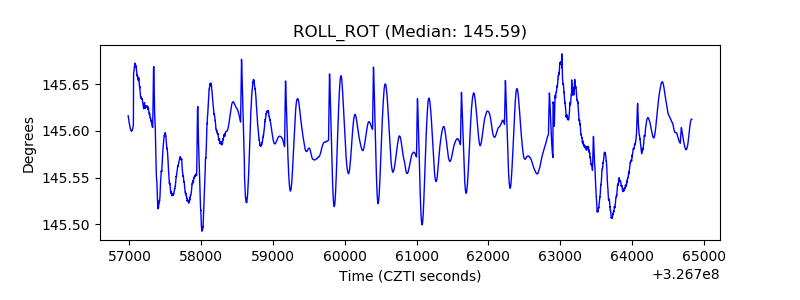 |
| _Roll_DEC | 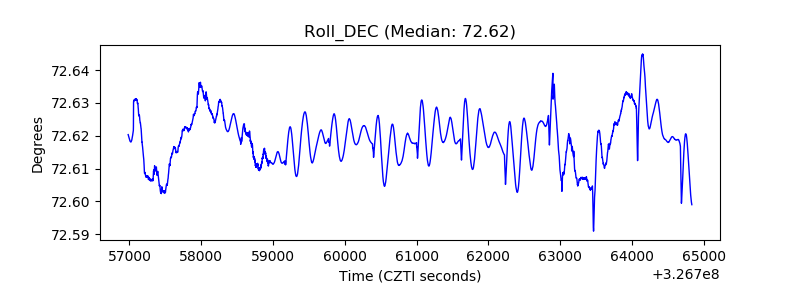 |
| _Roll_RA | 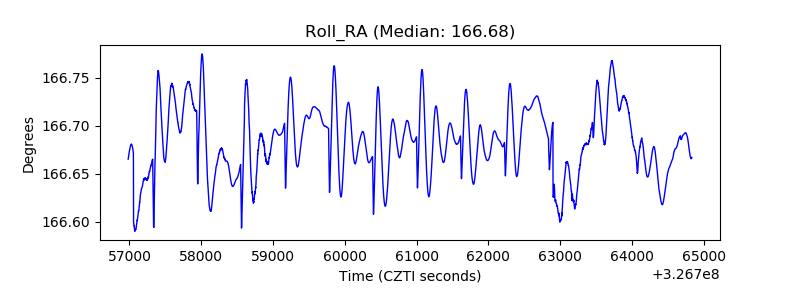 |
| Veto Counter | 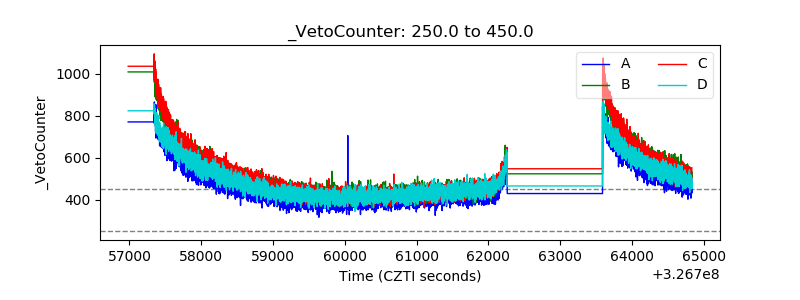 |