| Param | Original file | Final file |
|---|---|---|
| Filename | modeM0/AS1T03_200T01_9000003654_24954cztM0_level2.evt | modeM0/AS1T03_200T01_9000003654_24954cztM0_level2_quad_clean.evt |
| Size (bytes) | 495,054,720 | 139,996,800 |
| Size | 472.1 MB | 133.5 MB |
| Events in quadrant A | 3,157,741 | 964,971 |
| Events in quadrant B | 3,404,923 | 996,524 |
| Events in quadrant C | 3,477,908 | 940,732 |
| Events in quadrant D | 4,517,842 | 891,572 |
| Mode M9 | |||
|---|---|---|---|
| Quadrant | BADHDUFLAG | Total packets | Discarded packets |
| A | 0 | 24 | 0 |
| B | 0 | 25 | 0 |
| C | 0 | 25 | 0 |
| D | 0 | 25 | 0 |
| Mode SS | |||
|---|---|---|---|
| Quadrant | BADHDUFLAG | Total packets | Discarded packets |
| A | 0 | 128 | 0 |
| B | 0 | 128 | 0 |
| C | 0 | 128 | 0 |
| D | 0 | 128 | 0 |
| Mode M0 | |||
|---|---|---|---|
| Quadrant | BADHDUFLAG | Total packets | Discarded packets |
| A | 0 | 13423 | 2 |
| B | 0 | 14153 | 2 |
| C | 0 | 14325 | 2 |
| D | 0 | 18148 | 2 |
| Quadrant | Total seconds | Saturated seconds | Saturation percentage |
|---|---|---|---|
| A | 6411 | 17 | 0.265169% |
| B | 6411 | 72 | 1.123070% |
| C | 6411 | 97 | 1.513024% |
| D | 6411 | 59 | 0.920293% |
Noise dominated data is calculated using 1-second bins in cleaned event files. If a bin has >2000 counts, and if more than 50% of those come from <1% of pixels, then it is considered to be noise-dominated and hence unusable.
| Quadrant | # 1 sec bins | Bins with >0 counts | Bins with >2000 counts | High rate bins dominated by noise | Noise dominated (total time) | Noise dominated (detector-on time) | Marked lightcurve |
|---|---|---|---|---|---|---|---|
| A | 7781 | 6412 | 0 | 0 | 0.00% | 0.00% | 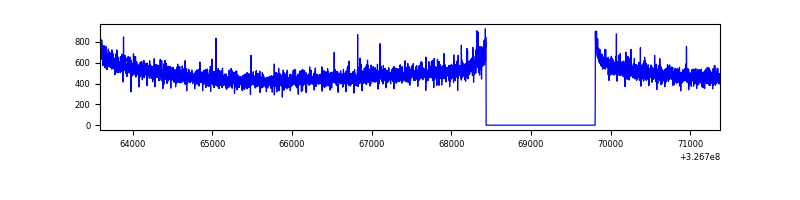 |
| B | 7781 | 6412 | 14 | 14 | 0.18% | 0.22% | 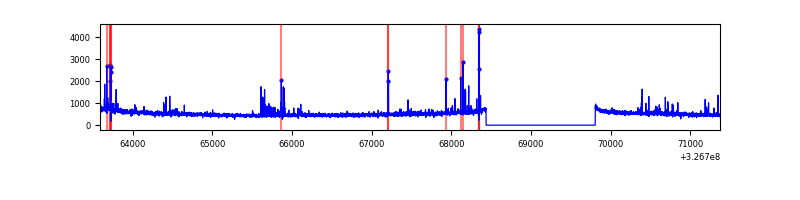 |
| C | 7781 | 6412 | 28 | 28 | 0.36% | 0.44% | 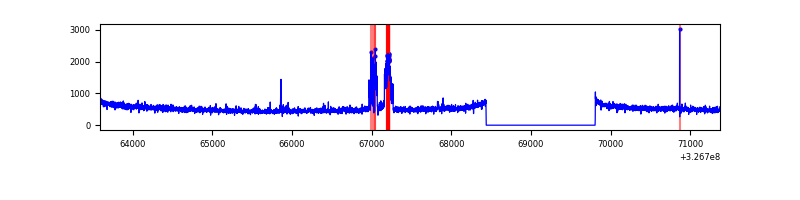 |
| D | 7781 | 6412 | 18 | 18 | 0.23% | 0.28% | 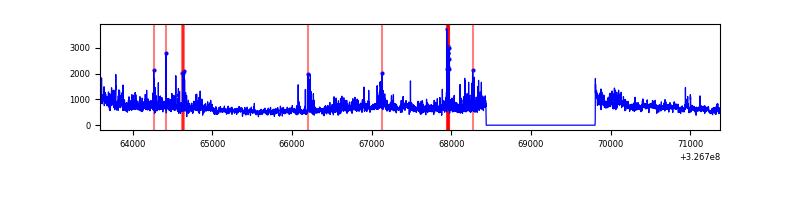 |
Top three noisy pixels from each quadrant. If the there are fewer than three noisy pixels in the level2.evt file, extra rows are filled as -1
| Pixel properties | Quadrant properties | ||||||
|---|---|---|---|---|---|---|---|
| Quadrant | DetID | PixID | Counts | Sigma | Mean | Median | Sigma |
| A | 13 | 254 | 9782 | 55.33 | 817 | 802 | 162.3 |
| A | 11 | 208 | 7424 | 40.8 | 817 | 802 | 162.3 |
| A | 0 | 226 | 7221 | 39.55 | 817 | 802 | 162.3 |
| B | 4 | 80 | 74976 | 499.49 | 822 | 806 | 148.5 |
| B | 5 | 172 | 33815 | 222.3 | 822 | 806 | 148.5 |
| B | 3 | 64 | 26712 | 174.46 | 822 | 806 | 148.5 |
| C | 7 | 247 | 253198 | 1388.55 | 790 | 795 | 181.8 |
| C | 14 | 238 | 129081 | 705.74 | 790 | 795 | 181.8 |
| C | 3 | 233 | 9703 | 49.0 | 790 | 795 | 181.8 |
| D | 1 | 3 | 801200 | 4292.12 | 781 | 761 | 186.5 |
| D | 8 | 195 | 351339 | 1879.87 | 781 | 761 | 186.5 |
| D | 1 | 52 | 270325 | 1445.46 | 781 | 761 | 186.5 |
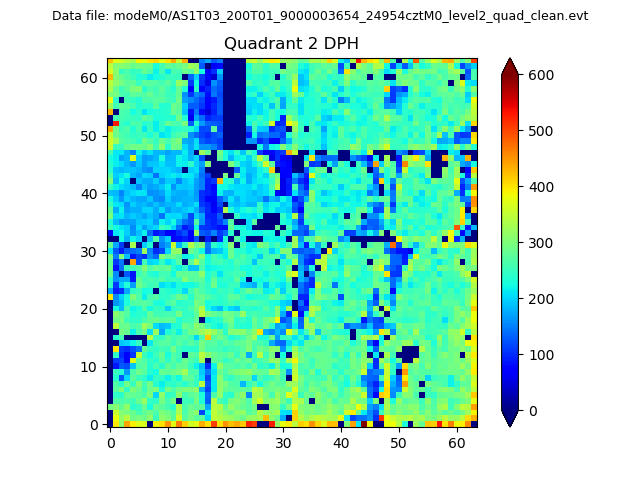
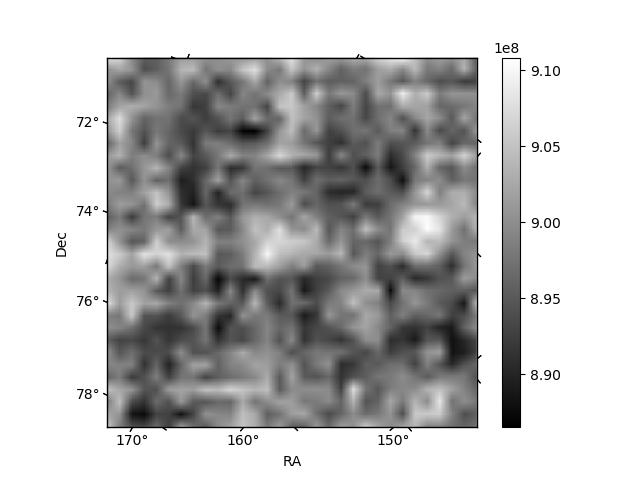
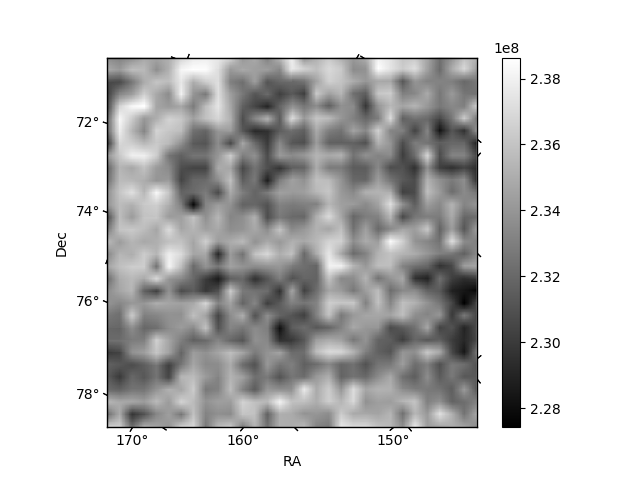
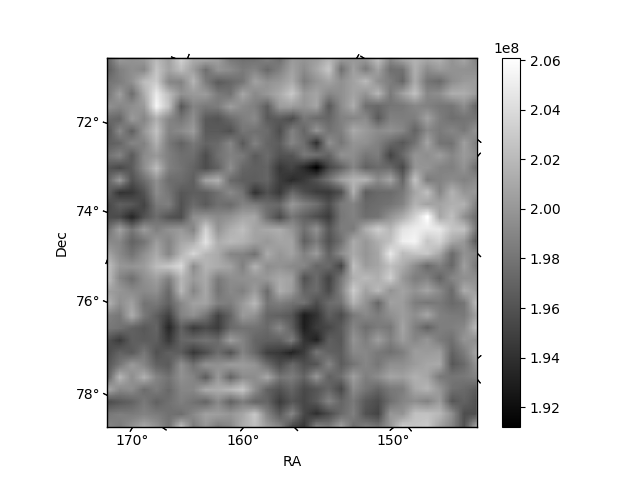
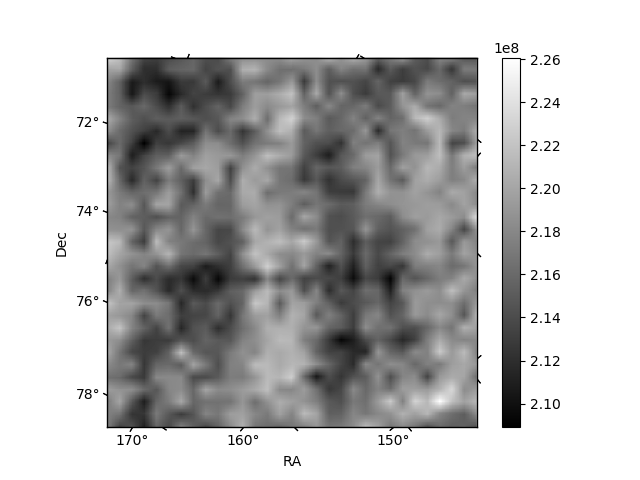
Histogram calculated using DETX and DETY for each event in the final _common_clean file
| Quadrant A | 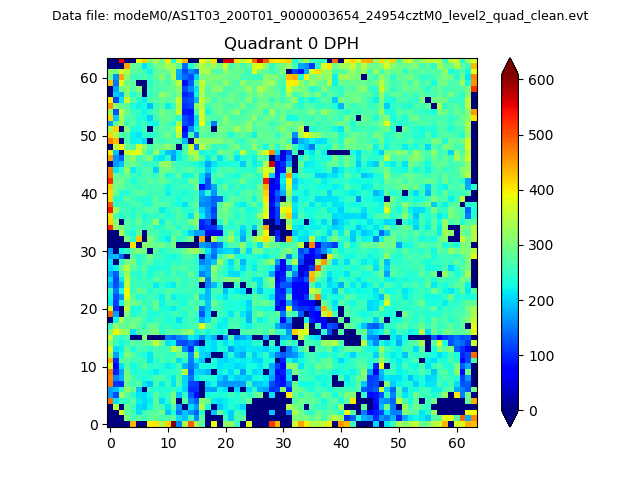 |
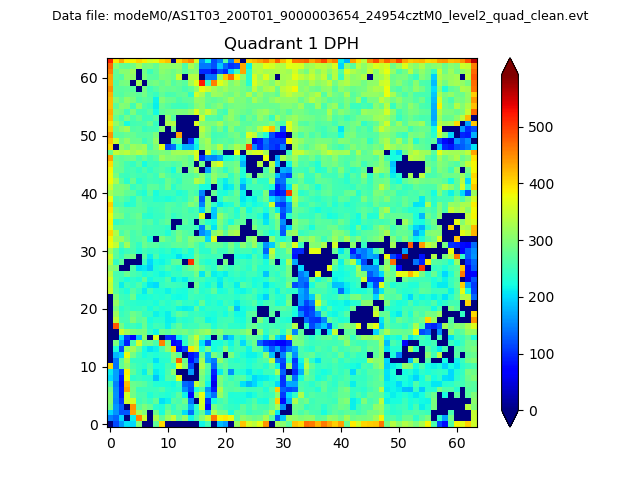 |
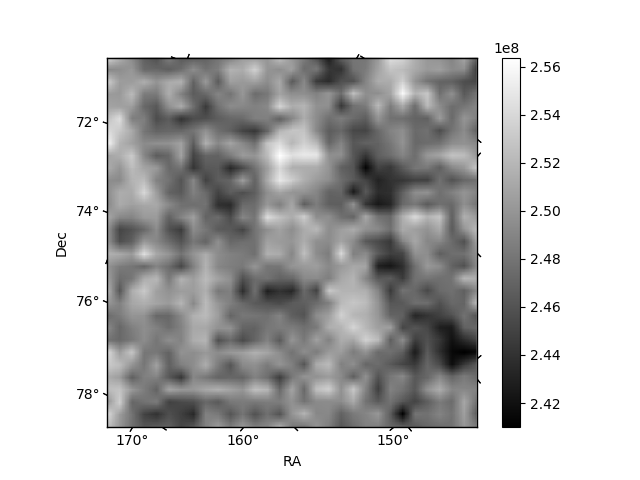
Quadrant B |
|---|---|---|---|
| Quadrant D | 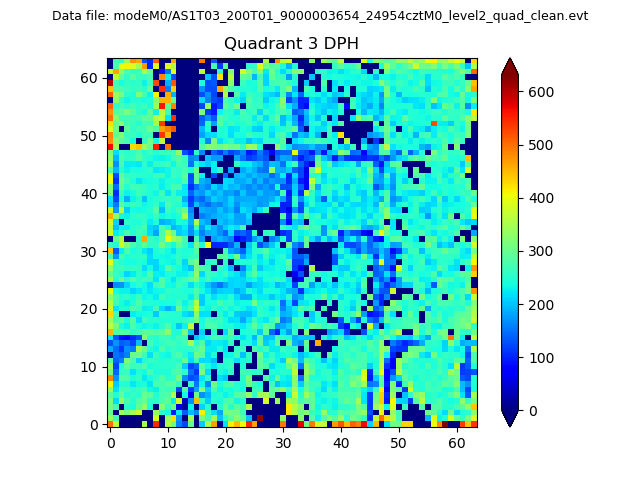 |
 |
Quadrant C |
| Plot type | Count rate plots | Images |
|---|---|---|
| Comparison with Poisson distribution Blue bars denote a histogram of data divided into 1 sec bins. Red curve is a Poisson curve with rate = median count rate of data. |
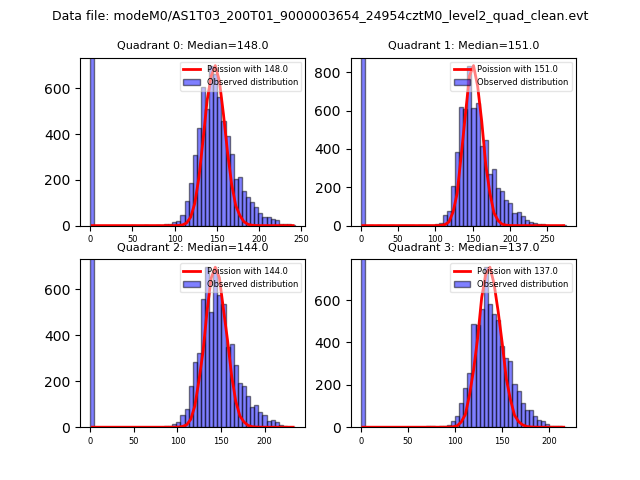 |
 |
| Quadrant-wise count rates Data is divided into 100 sec bins |
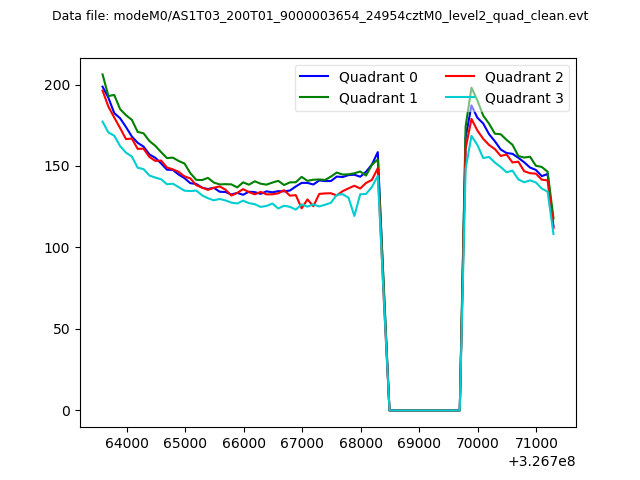 |
|
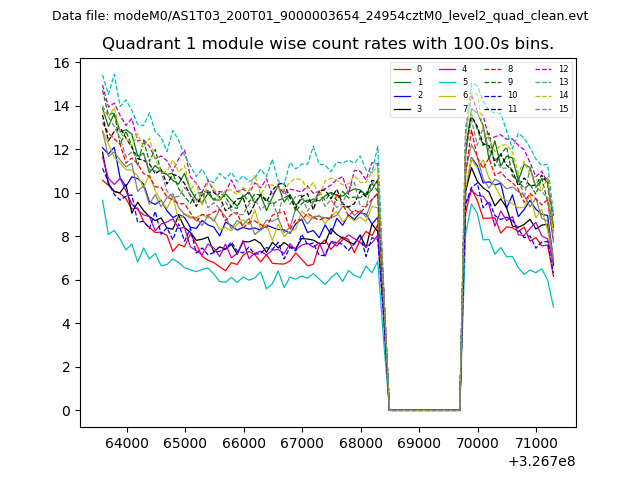
| Module-wise count rates for Quadrant A Data is divided into 100 sec bins |
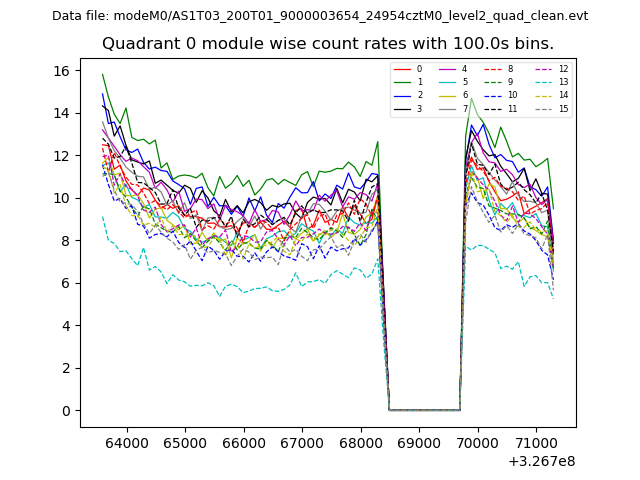 |
 |
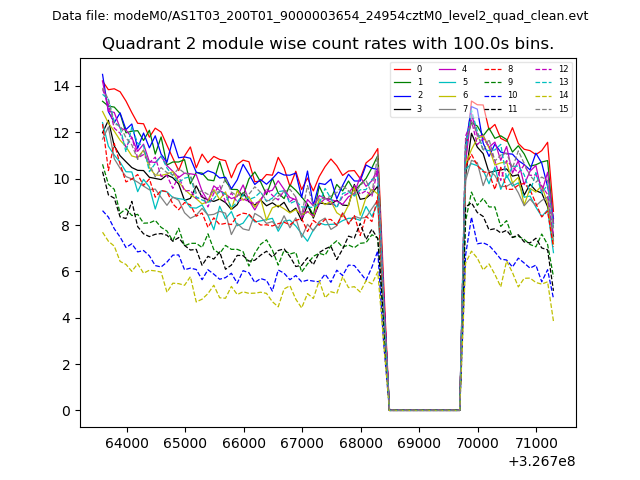
| Module-wise count rates for Quadrant B Data is divided into 100 sec bins |
 |
 |
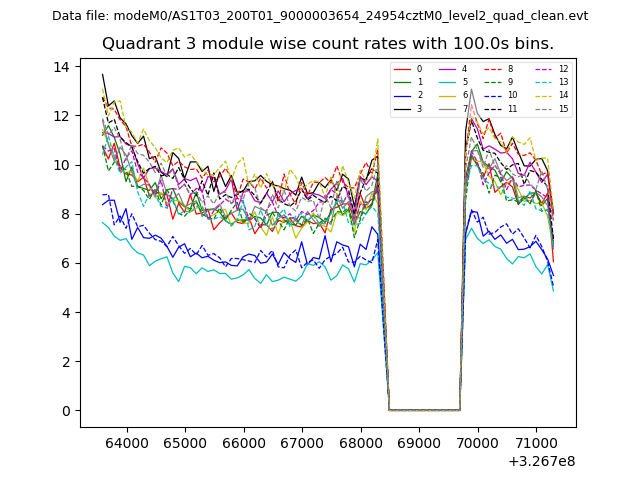
| Module-wise count rates for Quadrant C Data is divided into 100 sec bins |
 |
 |
| Module-wise count rates for Quadrant D Data is divided into 100 sec bins |
 |
 |
| Parameter | Plot |
|---|---|
| CZT HV Monitor | 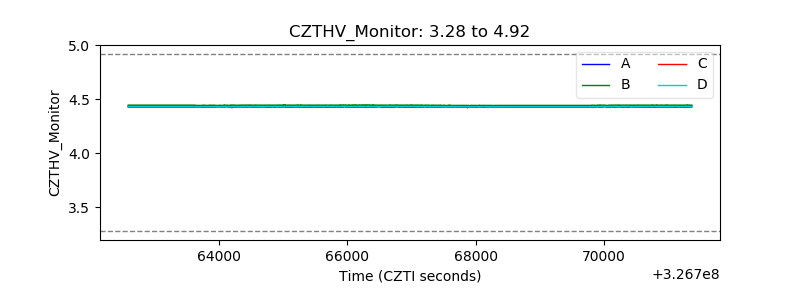 |
| D_VDD | 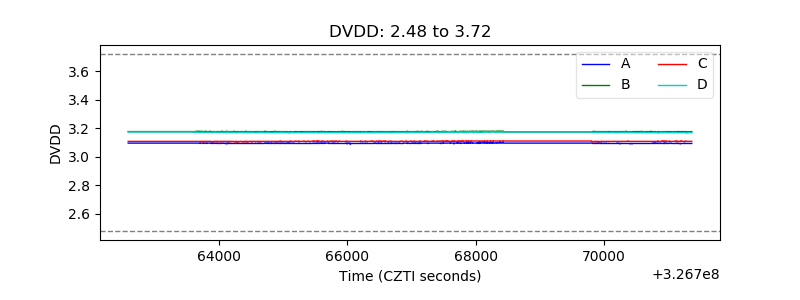 |
| Temperature 1 | 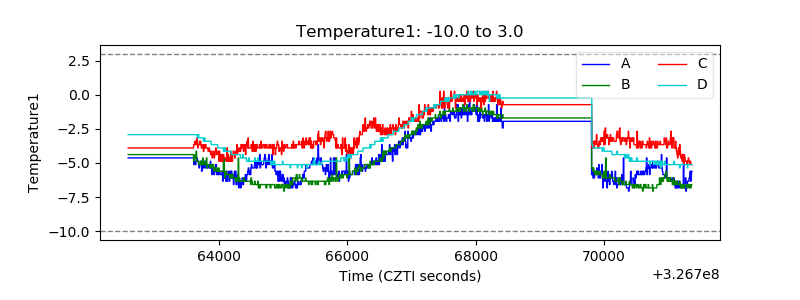 |
| Veto HV Monitor | 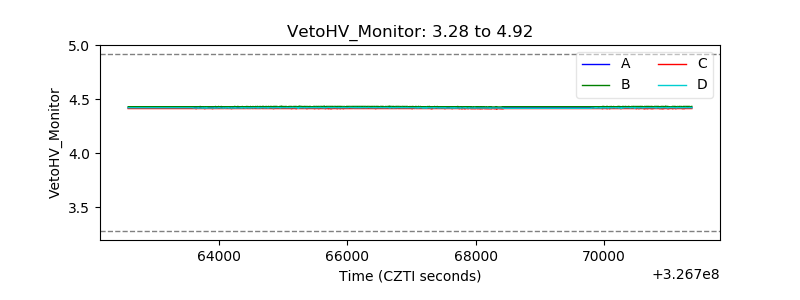 |
| Veto LLD | 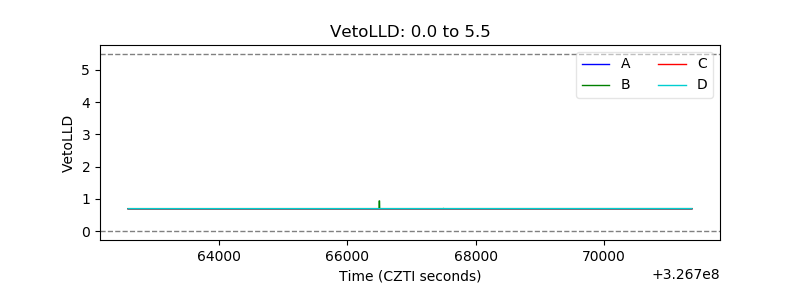 |
| Alpha Counter | 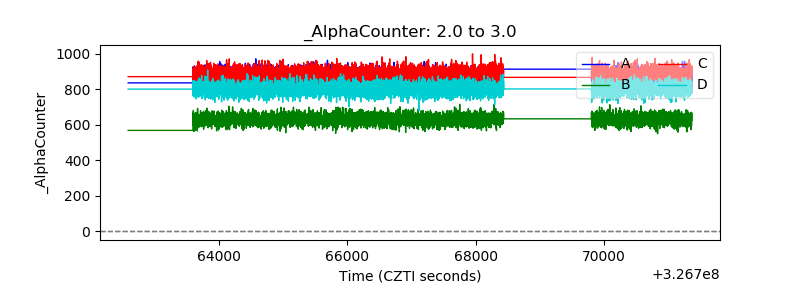 |
| _CPM_Rate | 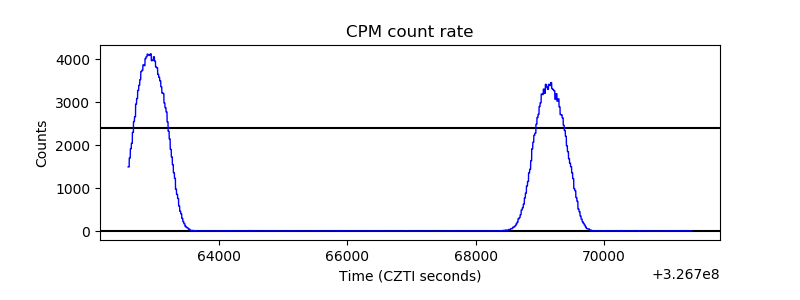 |
| CZT Counter | 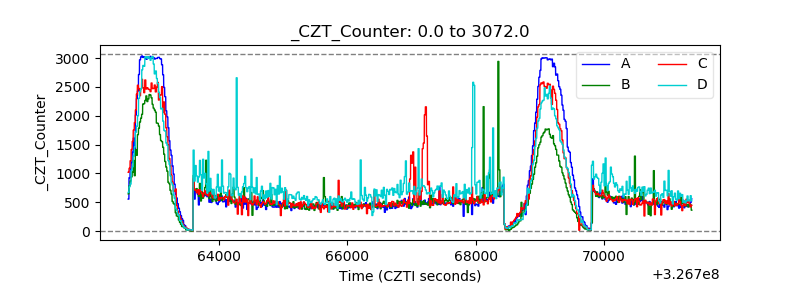 |
| +2.5 Volts monitor |  |
| +5 Volts monitor |  |
| _ROLL_ROT | 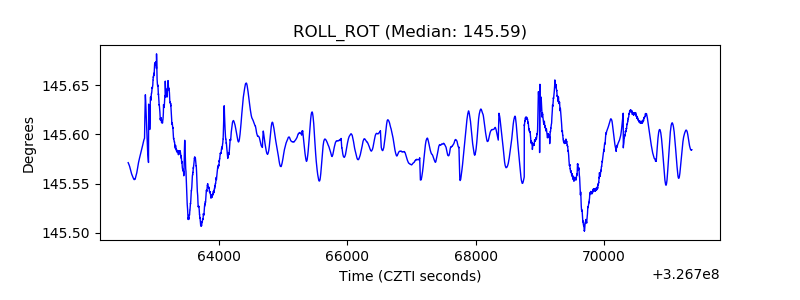 |
| _Roll_DEC | 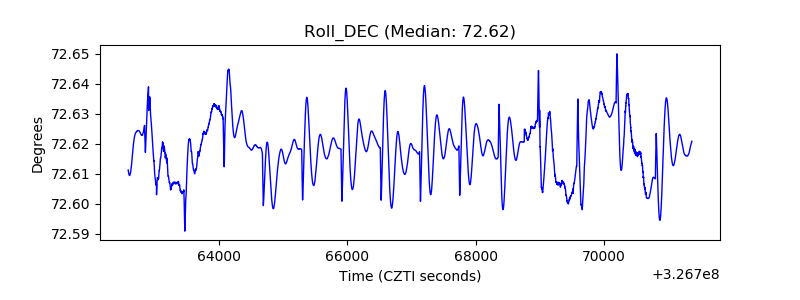 |
| _Roll_RA | 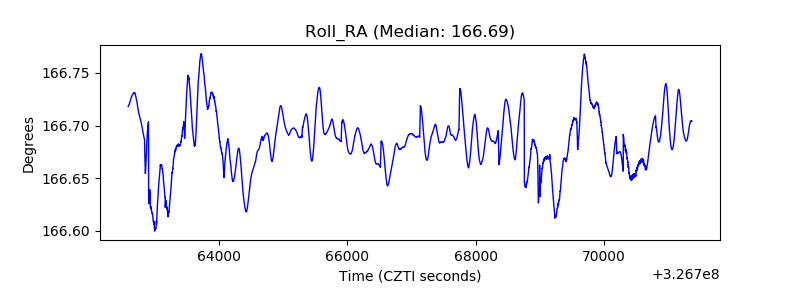 |
| Veto Counter | 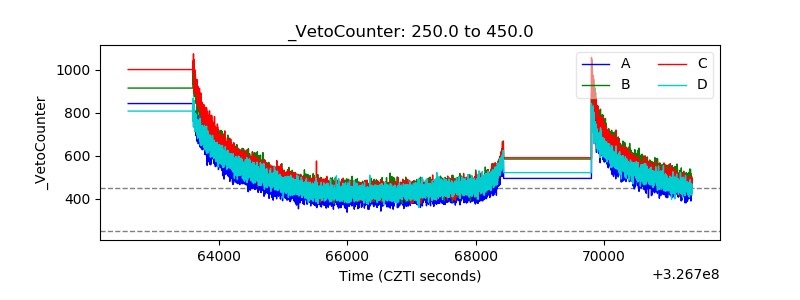 |