| Param | Original file | Final file |
|---|---|---|
| Filename | modeM0/AS1T03_200T01_9000003654_24958cztM0_level2.evt | modeM0/AS1T03_200T01_9000003654_24958cztM0_level2_quad_clean.evt |
| Size (bytes) | 487,270,080 | 130,366,080 |
| Size | 464.7 MB | 124.3 MB |
| Events in quadrant A | 3,214,092 | 882,615 |
| Events in quadrant B | 3,509,261 | 895,506 |
| Events in quadrant C | 3,294,576 | 856,542 |
| Events in quadrant D | 4,267,818 | 830,533 |
| Mode M9 | |||
|---|---|---|---|
| Quadrant | BADHDUFLAG | Total packets | Discarded packets |
| A | 0 | 3 | 0 |
| B | 0 | 3 | 0 |
| C | 0 | 3 | 0 |
| D | 0 | 3 | 0 |
| Mode SS | |||
|---|---|---|---|
| Quadrant | BADHDUFLAG | Total packets | Discarded packets |
| A | 0 | 140 | 0 |
| B | 0 | 140 | 0 |
| C | 0 | 140 | 0 |
| D | 0 | 140 | 0 |
| Mode M0 | |||
|---|---|---|---|
| Quadrant | BADHDUFLAG | Total packets | Discarded packets |
| A | 0 | 14253 | 1 |
| B | 0 | 14923 | 1 |
| C | 0 | 14276 | 1 |
| D | 0 | 17613 | 1 |
| Quadrant | Total seconds | Saturated seconds | Saturation percentage |
|---|---|---|---|
| A | 6937 | 134 | 1.931671% |
| B | 6938 | 127 | 1.830499% |
| C | 6938 | 117 | 1.686365% |
| D | 6938 | 103 | 1.484578% |
Noise dominated data is calculated using 1-second bins in cleaned event files. If a bin has >2000 counts, and if more than 50% of those come from <1% of pixels, then it is considered to be noise-dominated and hence unusable.
| Quadrant | # 1 sec bins | Bins with >0 counts | Bins with >2000 counts | High rate bins dominated by noise | Noise dominated (total time) | Noise dominated (detector-on time) | Marked lightcurve |
|---|---|---|---|---|---|---|---|
| A | 7262 | 6938 | 7 | 7 | 0.10% | 0.10% |  |
| B | 7263 | 6939 | 6 | 6 | 0.08% | 0.09% |  |
| C | 7263 | 6939 | 1 | 1 | 0.01% | 0.01% |  |
| D | 7263 | 6939 | 10 | 10 | 0.14% | 0.14% |  |
Top three noisy pixels from each quadrant. If the there are fewer than three noisy pixels in the level2.evt file, extra rows are filled as -1
| Pixel properties | Quadrant properties | ||||||
|---|---|---|---|---|---|---|---|
| Quadrant | DetID | PixID | Counts | Sigma | Mean | Median | Sigma |
| A | 6 | 16 | 36922 | 219.04 | 817 | 799 | 164.9 |
| A | 11 | 208 | 27816 | 163.82 | 817 | 799 | 164.9 |
| A | 13 | 254 | 9686 | 53.89 | 817 | 799 | 164.9 |
| B | 0 | 229 | 82288 | 523.76 | 816 | 796 | 155.6 |
| B | 4 | 80 | 76035 | 483.57 | 816 | 796 | 155.6 |
| B | 15 | 33 | 38405 | 241.72 | 816 | 796 | 155.6 |
| C | 14 | 238 | 125174 | 683.06 | 780 | 782 | 182.1 |
| C | 7 | 247 | 89876 | 489.24 | 780 | 782 | 182.1 |
| C | 3 | 233 | 21157 | 111.88 | 780 | 782 | 182.1 |
| D | 1 | 3 | 921416 | 4801.68 | 789 | 764 | 191.7 |
| D | 1 | 52 | 199155 | 1034.71 | 789 | 764 | 191.7 |
| D | 8 | 195 | 110479 | 572.22 | 789 | 764 | 191.7 |
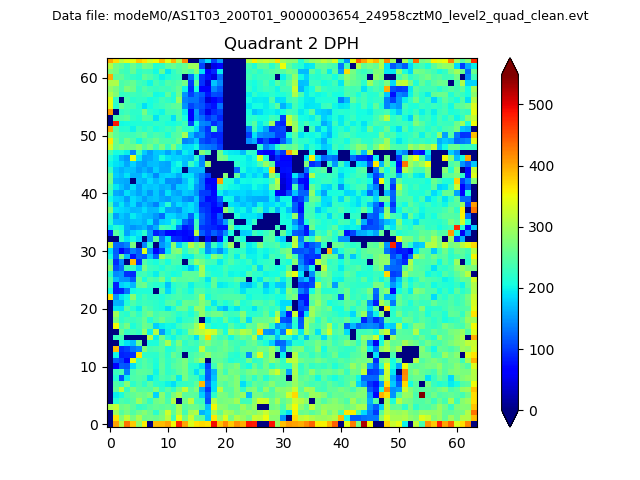
Histogram calculated using DETX and DETY for each event in the final _common_clean file
| Quadrant A | 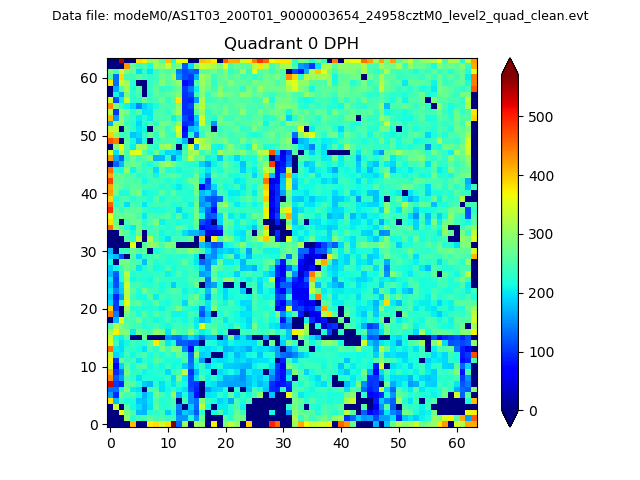 |
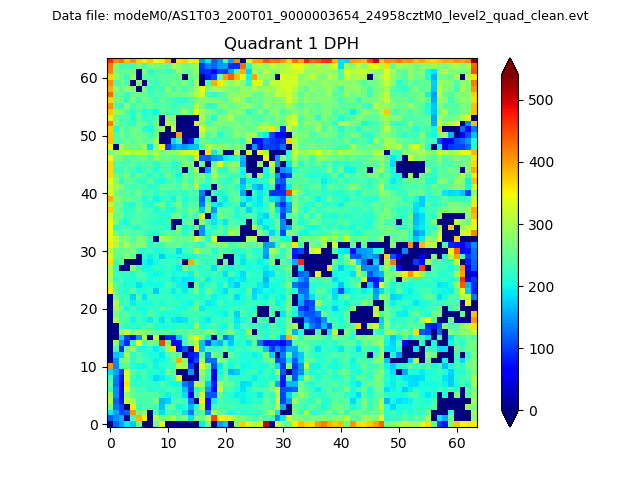 |
Quadrant B |
|---|---|---|---|
| Quadrant D | 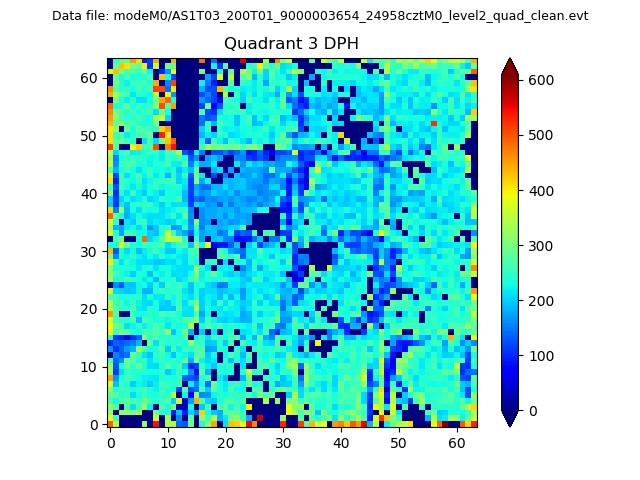 |
 |
Quadrant C |
| Plot type | Count rate plots | Images |
|---|---|---|
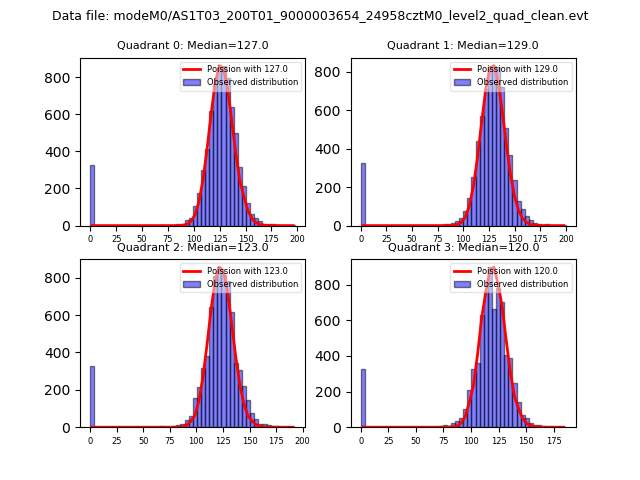
| Comparison with Poisson distribution Blue bars denote a histogram of data divided into 1 sec bins. Red curve is a Poisson curve with rate = median count rate of data. |
 |
 |
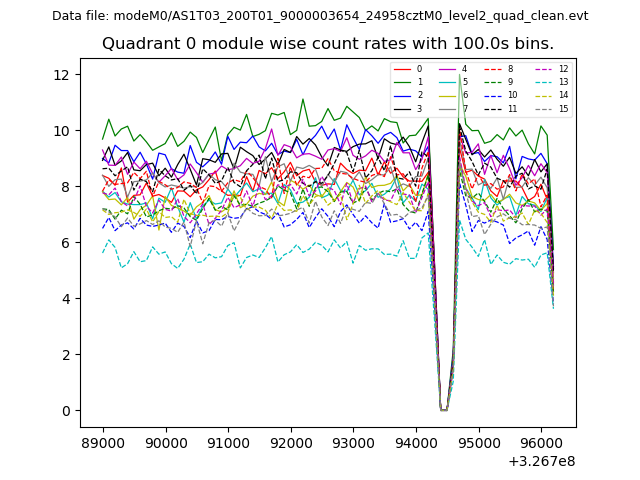
| Quadrant-wise count rates Data is divided into 100 sec bins |
 |
|
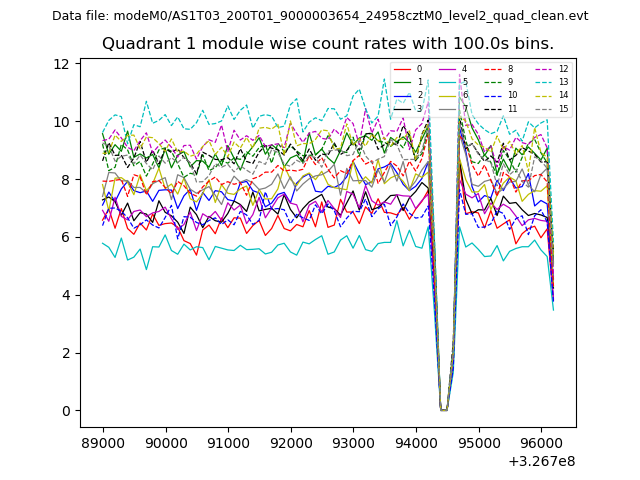
| Module-wise count rates for Quadrant A Data is divided into 100 sec bins |
 |
 |
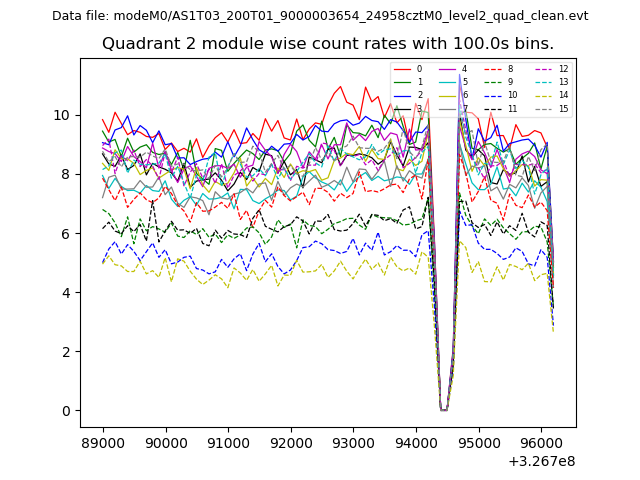
| Module-wise count rates for Quadrant B Data is divided into 100 sec bins |
 |
 |
| Module-wise count rates for Quadrant C Data is divided into 100 sec bins |
 |
 |
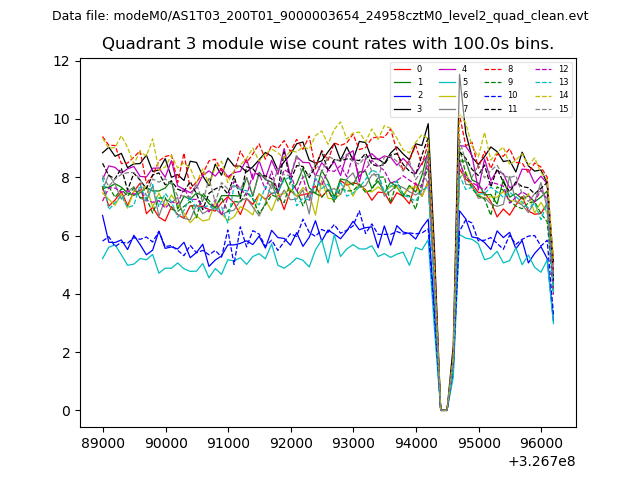
| Module-wise count rates for Quadrant D Data is divided into 100 sec bins |
 |
 |
| Parameter | Plot |
|---|---|
| CZT HV Monitor | 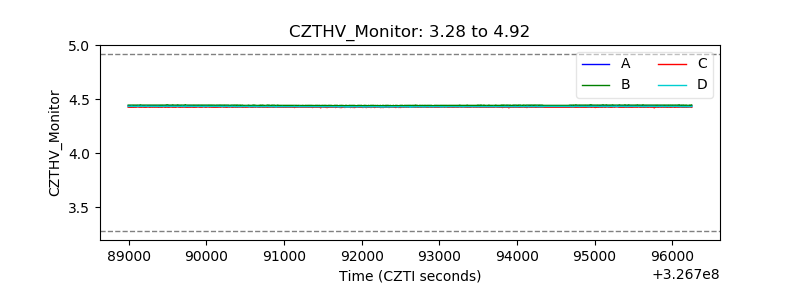 |
| D_VDD | 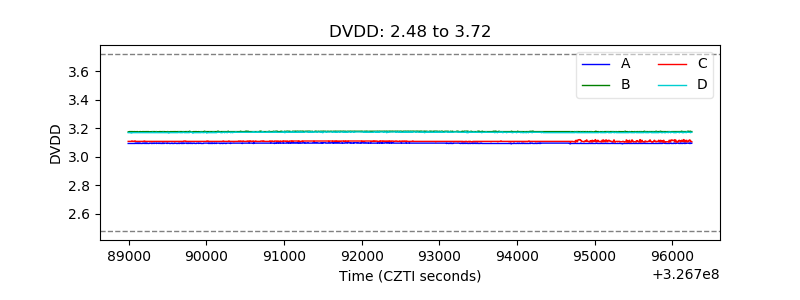 |
| Temperature 1 | 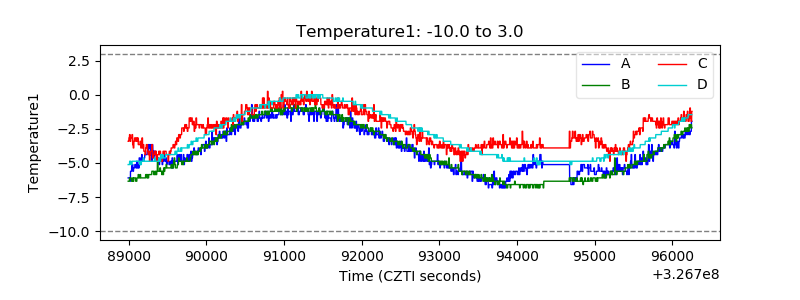 |
| Veto HV Monitor | 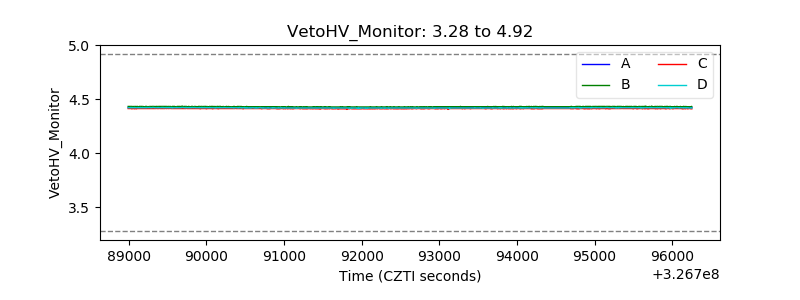 |
| Veto LLD | 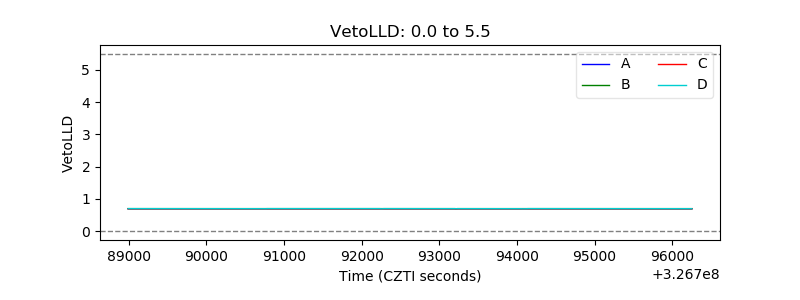 |
| Alpha Counter | 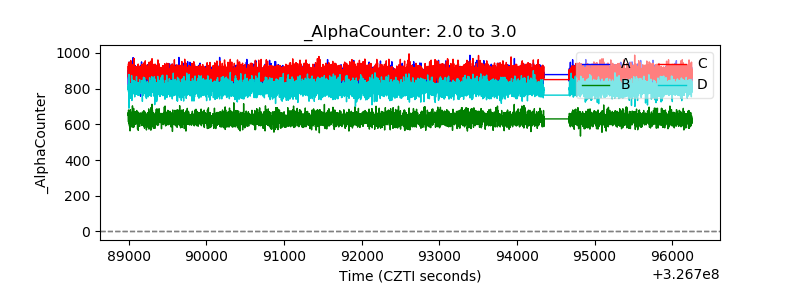 |
| _CPM_Rate | 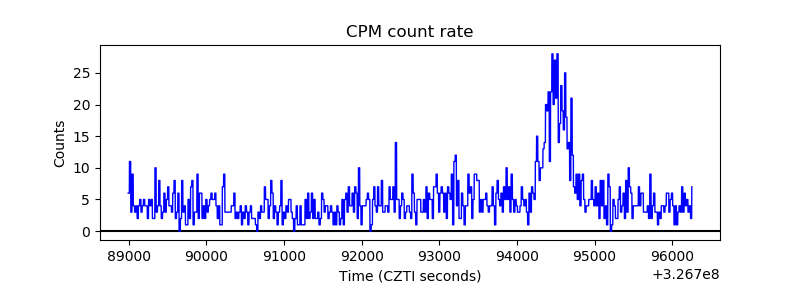 |
| CZT Counter | 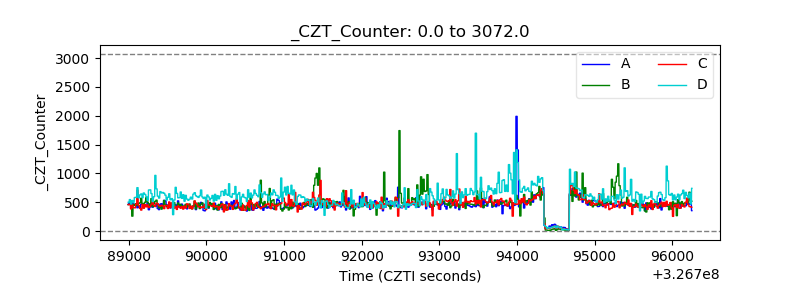 |
| +2.5 Volts monitor |  |
| +5 Volts monitor |  |
| _ROLL_ROT |  |
| _Roll_DEC | 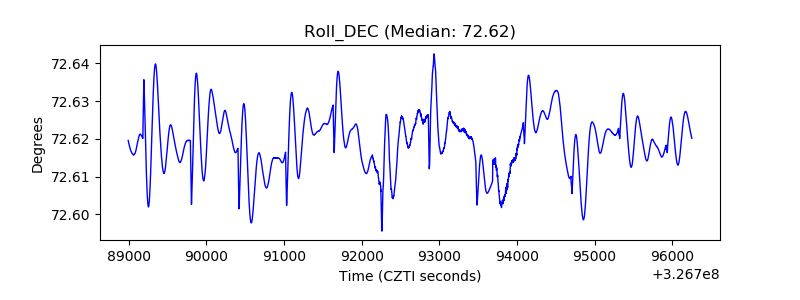 |
| _Roll_RA | 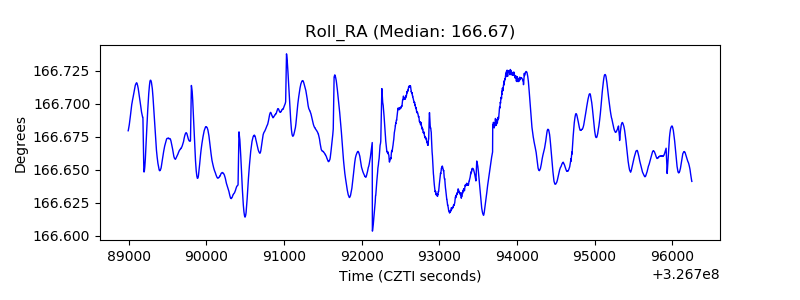 |
| Veto Counter | 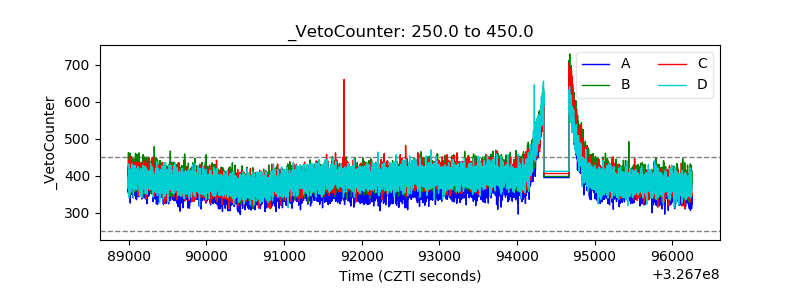 |