| Param | Original file | Final file |
|---|---|---|
| Filename | modeM0/AS1T03_200T01_9000003654_24959cztM0_level2.evt | modeM0/AS1T03_200T01_9000003654_24959cztM0_level2_quad_clean.evt |
| Size (bytes) | 495,051,840 | 131,978,880 |
| Size | 472.1 MB | 125.9 MB |
| Events in quadrant A | 3,262,372 | 893,238 |
| Events in quadrant B | 3,707,007 | 905,906 |
| Events in quadrant C | 3,372,602 | 862,982 |
| Events in quadrant D | 4,168,590 | 841,002 |
| Mode SS | |||
|---|---|---|---|
| Quadrant | BADHDUFLAG | Total packets | Discarded packets |
| A | 0 | 142 | 0 |
| B | 0 | 142 | 0 |
| C | 0 | 142 | 0 |
| D | 0 | 142 | 0 |
| Mode M0 | |||
|---|---|---|---|
| Quadrant | BADHDUFLAG | Total packets | Discarded packets |
| A | 0 | 14583 | 1 |
| B | 0 | 15637 | 1 |
| C | 0 | 14642 | 1 |
| D | 0 | 17124 | 1 |
| Quadrant | Total seconds | Saturated seconds | Saturation percentage |
|---|---|---|---|
| A | 7092 | 187 | 2.636774% |
| B | 7093 | 226 | 3.186240% |
| C | 7093 | 167 | 2.354434% |
| D | 7093 | 163 | 2.298040% |
Noise dominated data is calculated using 1-second bins in cleaned event files. If a bin has >2000 counts, and if more than 50% of those come from <1% of pixels, then it is considered to be noise-dominated and hence unusable.
| Quadrant | # 1 sec bins | Bins with >0 counts | Bins with >2000 counts | High rate bins dominated by noise | Noise dominated (total time) | Noise dominated (detector-on time) | Marked lightcurve |
|---|---|---|---|---|---|---|---|
| A | 7117 | 7093 | 0 | 0 | 0.00% | 0.00% | 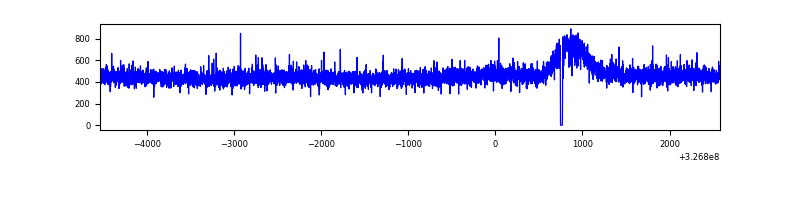 |
| B | 7118 | 7094 | 21 | 21 | 0.30% | 0.30% | 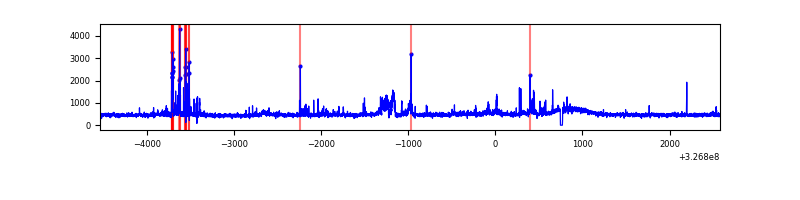 |
| C | 7118 | 7094 | 0 | 0 | 0.00% | 0.00% | 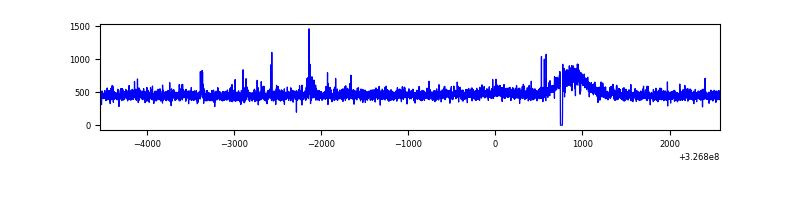 |
| D | 7118 | 7094 | 18 | 18 | 0.25% | 0.25% | 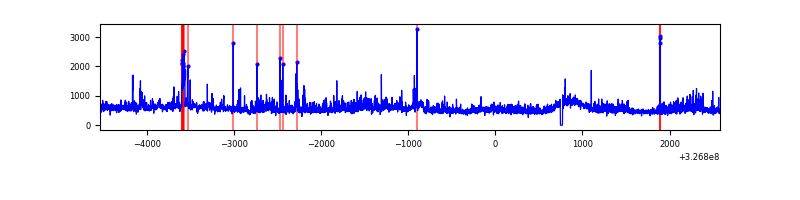 |
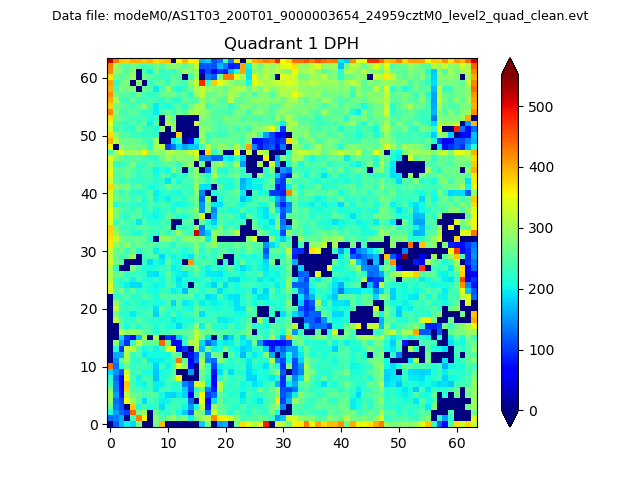
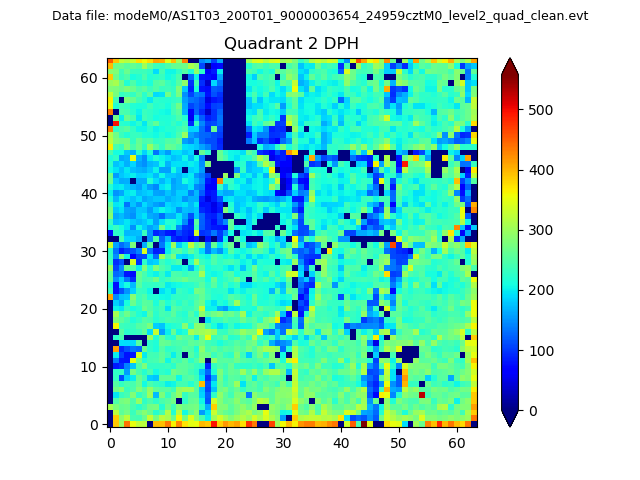
Top three noisy pixels from each quadrant. If the there are fewer than three noisy pixels in the level2.evt file, extra rows are filled as -1
| Pixel properties | Quadrant properties | ||||||
|---|---|---|---|---|---|---|---|
| Quadrant | DetID | PixID | Counts | Sigma | Mean | Median | Sigma |
| A | 13 | 254 | 10318 | 55.56 | 846 | 827 | 170.8 |
| A | 3 | 137 | 7709 | 40.29 | 846 | 827 | 170.8 |
| A | 0 | 226 | 7382 | 38.37 | 846 | 827 | 170.8 |
| B | 3 | 64 | 159079 | 999.91 | 837 | 816 | 158.3 |
| B | 0 | 229 | 145312 | 912.93 | 837 | 816 | 158.3 |
| B | 0 | 190 | 25061 | 153.18 | 837 | 816 | 158.3 |
| C | 14 | 238 | 127437 | 674.13 | 806 | 808 | 187.8 |
| C | 7 | 247 | 46380 | 242.61 | 806 | 808 | 187.8 |
| C | 3 | 233 | 33338 | 173.18 | 806 | 808 | 187.8 |
| D | 1 | 52 | 422216 | 2133.66 | 816 | 789 | 197.5 |
| D | 8 | 195 | 309815 | 1564.58 | 816 | 789 | 197.5 |
| D | 1 | 3 | 289303 | 1460.73 | 816 | 789 | 197.5 |
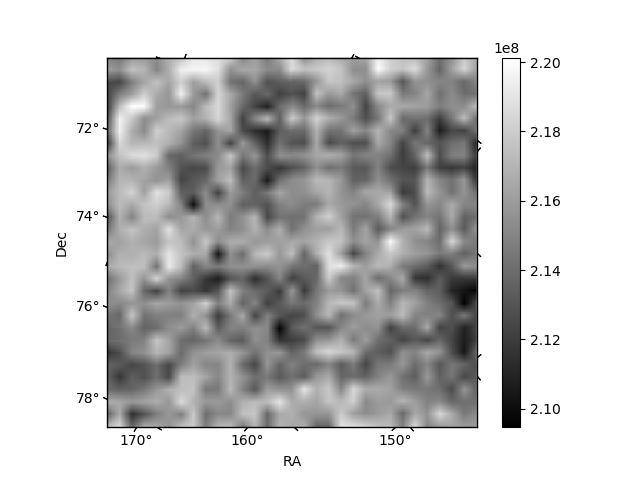
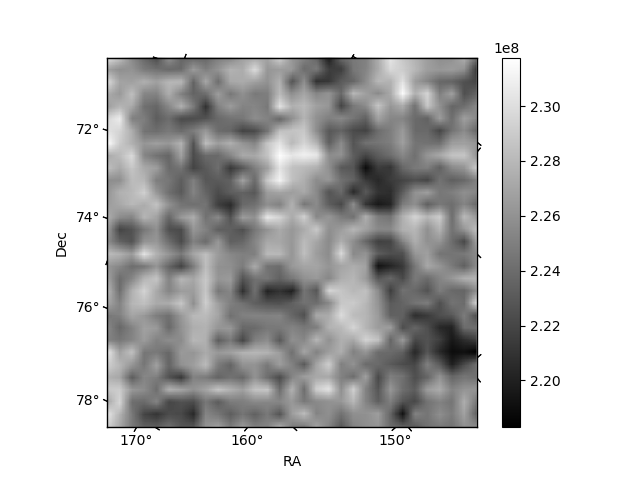
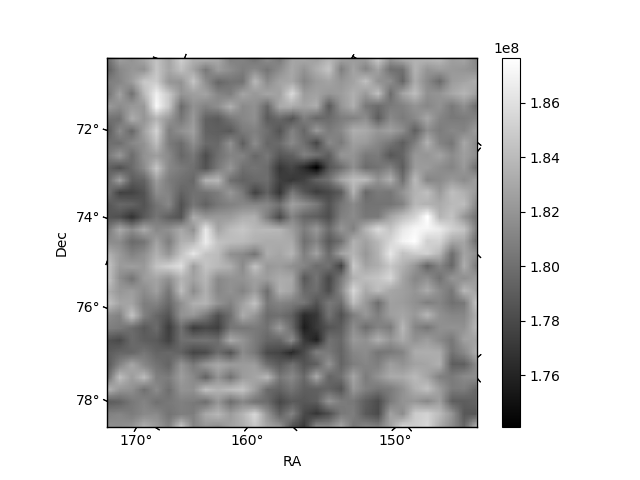
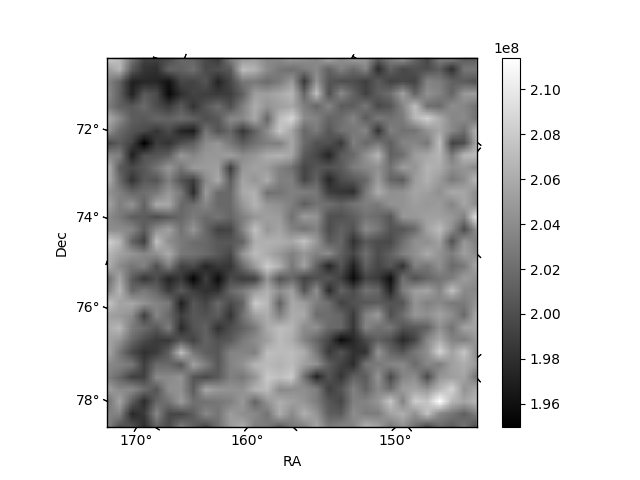
Histogram calculated using DETX and DETY for each event in the final _common_clean file
| Quadrant A | 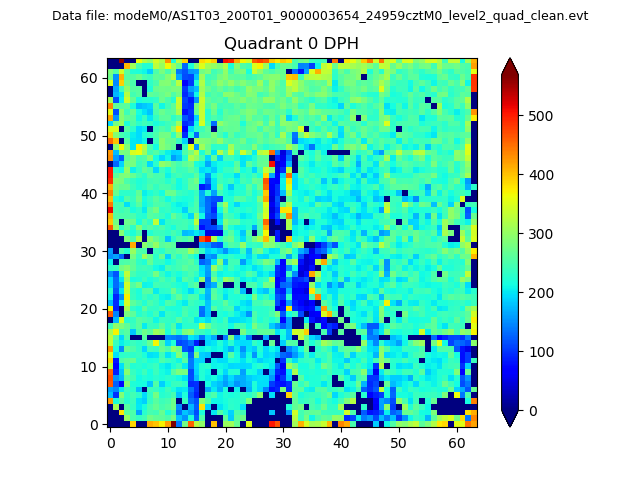 |
 |
Quadrant B |
|---|---|---|---|
| Quadrant D | 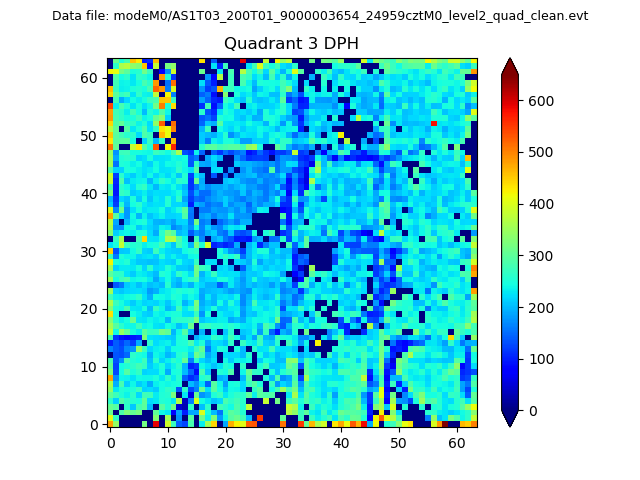 |
 |
Quadrant C |
| Plot type | Count rate plots | Images |
|---|---|---|
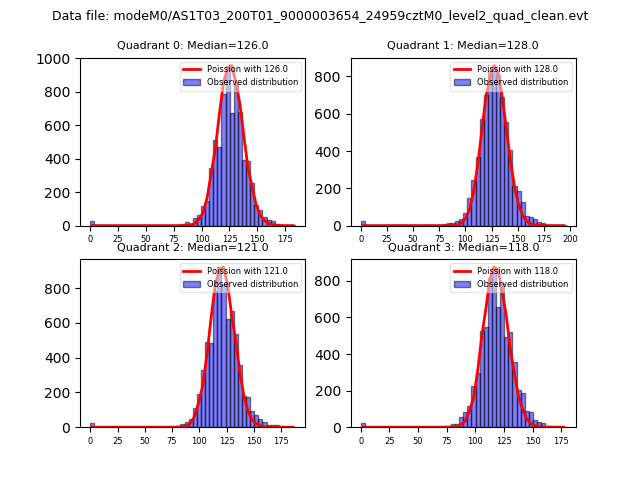
| Comparison with Poisson distribution Blue bars denote a histogram of data divided into 1 sec bins. Red curve is a Poisson curve with rate = median count rate of data. |
 |
 |
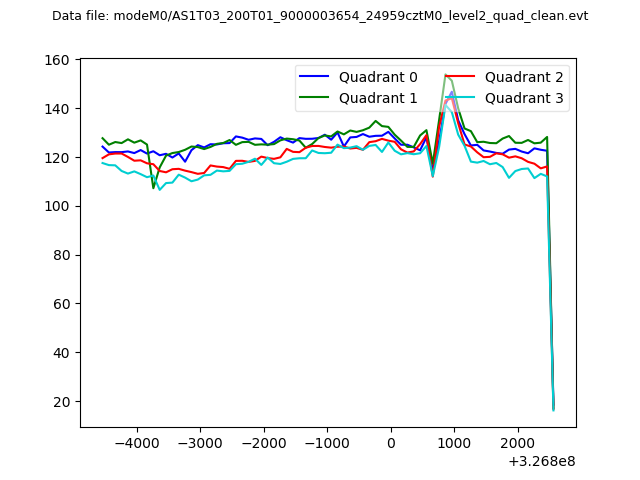
| Quadrant-wise count rates Data is divided into 100 sec bins |
 |
|
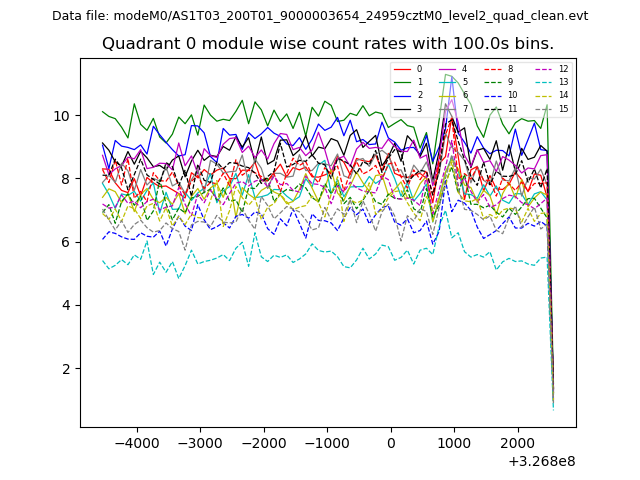
| Module-wise count rates for Quadrant A Data is divided into 100 sec bins |
 |
 |
| Module-wise count rates for Quadrant B Data is divided into 100 sec bins |
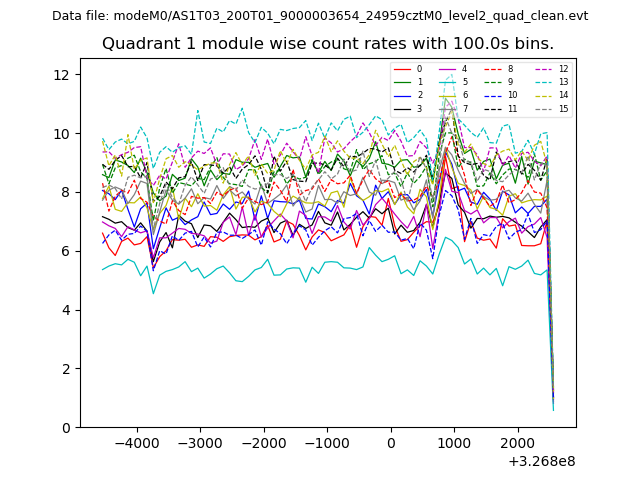 |
 |
| Module-wise count rates for Quadrant C Data is divided into 100 sec bins |
 |
 |
| Module-wise count rates for Quadrant D Data is divided into 100 sec bins |
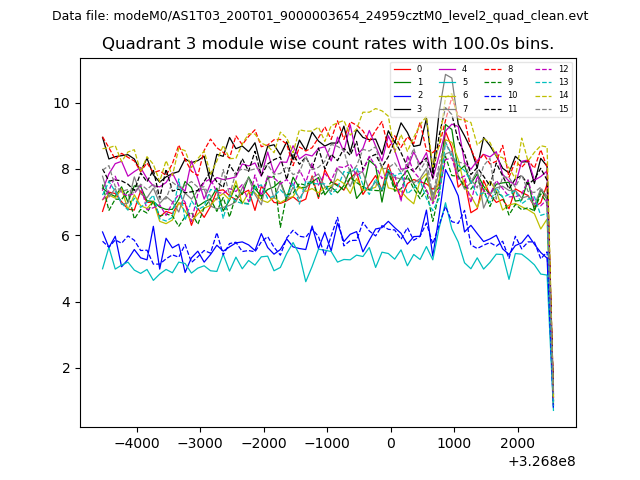 |
 |
| Parameter | Plot |
|---|---|
| CZT HV Monitor | 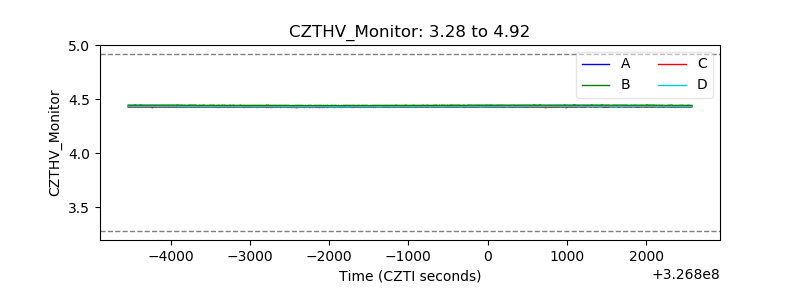 |
| D_VDD | 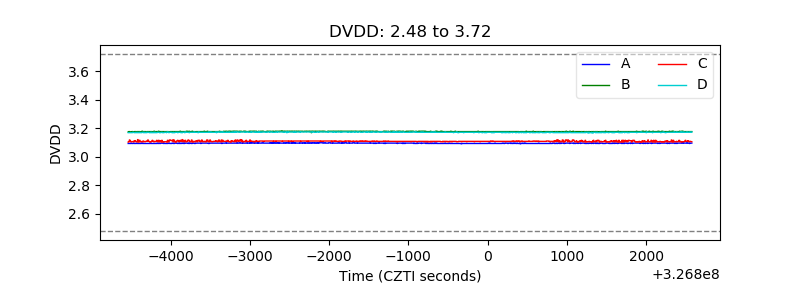 |
| Temperature 1 | 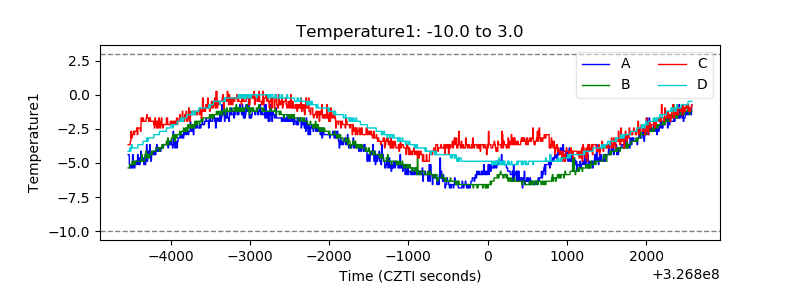 |
| Veto HV Monitor |  |
| Veto LLD | 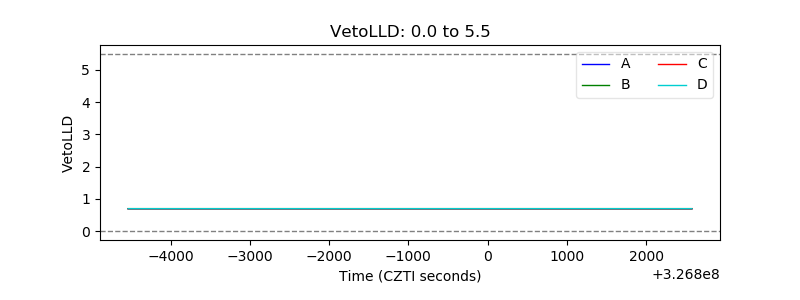 |
| Alpha Counter | 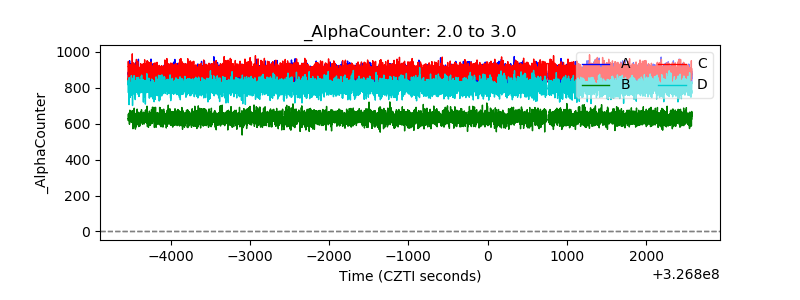 |
| _CPM_Rate | 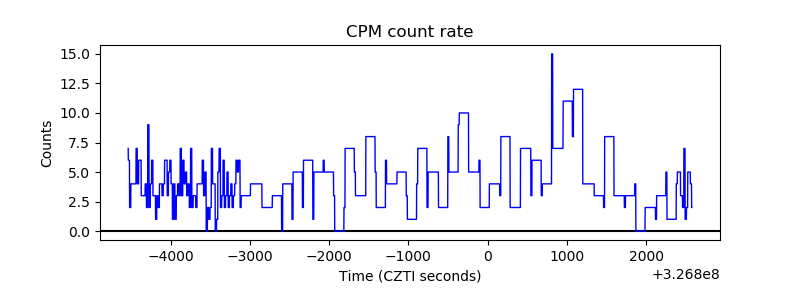 |
| CZT Counter | 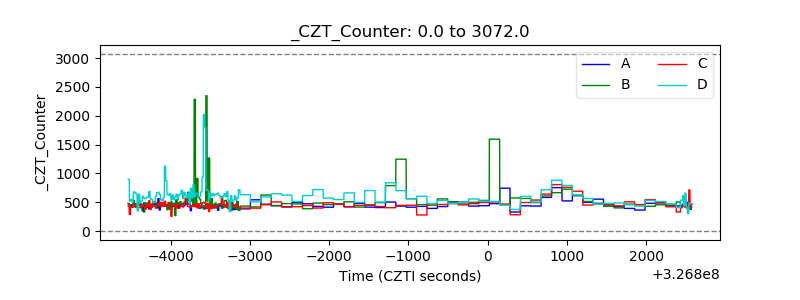 |
| +2.5 Volts monitor | 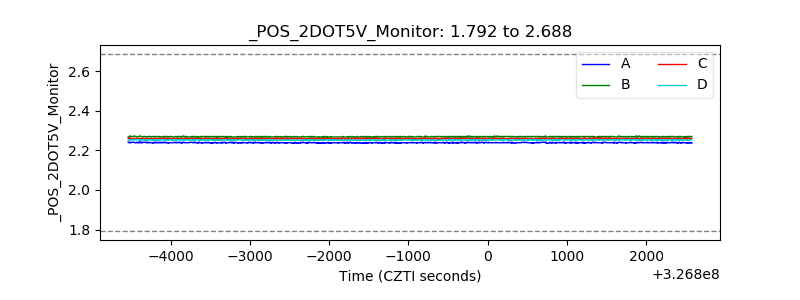 |
| +5 Volts monitor | 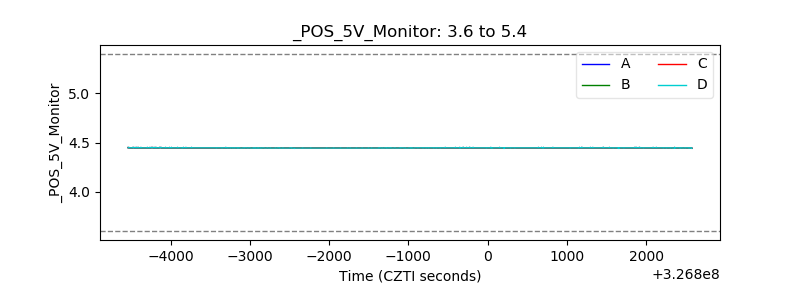 |
| _ROLL_ROT | 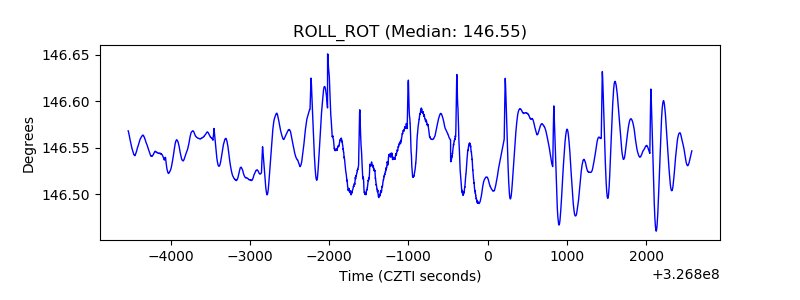 |
| _Roll_DEC |  |
| _Roll_RA | 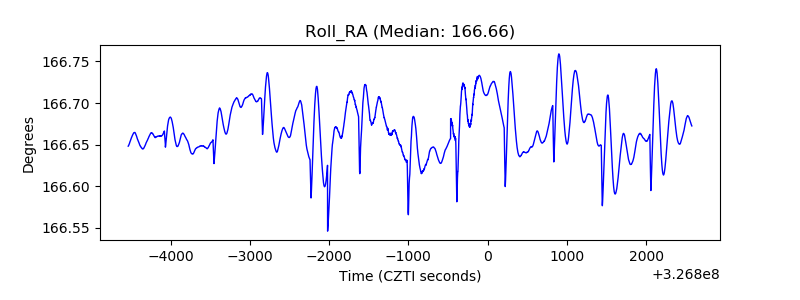 |
| Veto Counter | 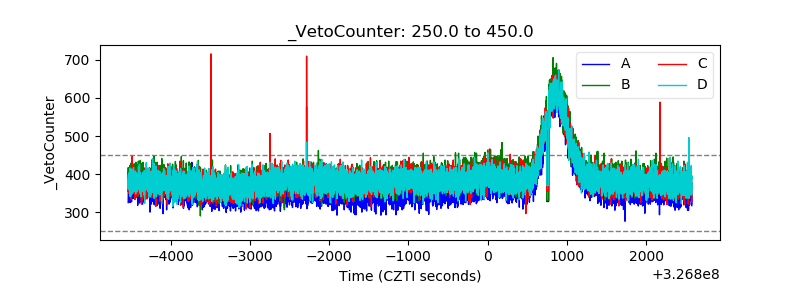 |