| Param | Original file | Final file |
|---|---|---|
| Filename | modeM0/AS1T03_200T01_9000003654_24960cztM0_level2.evt | modeM0/AS1T03_200T01_9000003654_24960cztM0_level2_quad_clean.evt |
| Size (bytes) | 491,025,600 | 127,958,400 |
| Size | 468.3 MB | 122.0 MB |
| Events in quadrant A | 3,184,076 | 869,894 |
| Events in quadrant B | 3,715,939 | 874,824 |
| Events in quadrant C | 3,273,905 | 832,723 |
| Events in quadrant D | 4,225,709 | 814,868 |
| Mode M9 | |||
|---|---|---|---|
| Quadrant | BADHDUFLAG | Total packets | Discarded packets |
| A | 0 | 3 | 0 |
| B | 0 | 3 | 0 |
| C | 0 | 3 | 0 |
| D | 0 | 3 | 0 |
| Mode SS | |||
|---|---|---|---|
| Quadrant | BADHDUFLAG | Total packets | Discarded packets |
| A | 0 | 140 | 0 |
| B | 0 | 140 | 0 |
| C | 0 | 140 | 0 |
| D | 0 | 140 | 0 |
| Mode M0 | |||
|---|---|---|---|
| Quadrant | BADHDUFLAG | Total packets | Discarded packets |
| A | 0 | 14175 | 1 |
| B | 0 | 15588 | 1 |
| C | 0 | 14273 | 1 |
| D | 0 | 17020 | 1 |
| Quadrant | Total seconds | Saturated seconds | Saturation percentage |
|---|---|---|---|
| A | 6934 | 126 | 1.817133% |
| B | 6935 | 212 | 3.056957% |
| C | 6935 | 147 | 2.119683% |
| D | 6935 | 146 | 2.105263% |
Noise dominated data is calculated using 1-second bins in cleaned event files. If a bin has >2000 counts, and if more than 50% of those come from <1% of pixels, then it is considered to be noise-dominated and hence unusable.
| Quadrant | # 1 sec bins | Bins with >0 counts | Bins with >2000 counts | High rate bins dominated by noise | Noise dominated (total time) | Noise dominated (detector-on time) | Marked lightcurve |
|---|---|---|---|---|---|---|---|
| A | 7159 | 6936 | 0 | 0 | 0.00% | 0.00% | 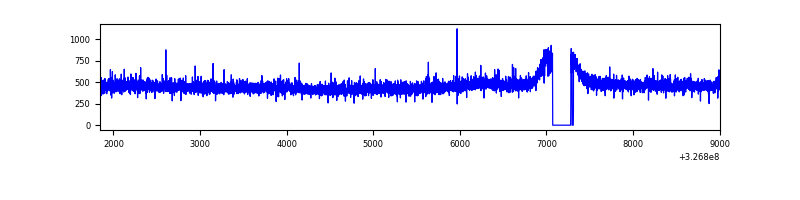 |
| B | 7160 | 6937 | 36 | 36 | 0.50% | 0.52% | 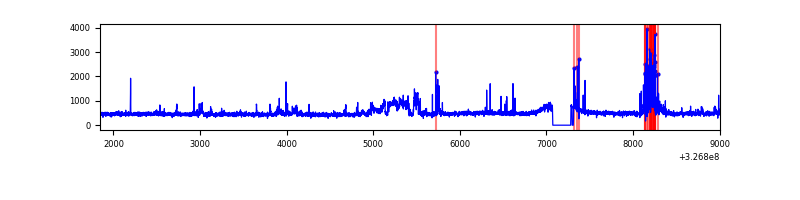 |
| C | 7160 | 6937 | 0 | 0 | 0.00% | 0.00% | 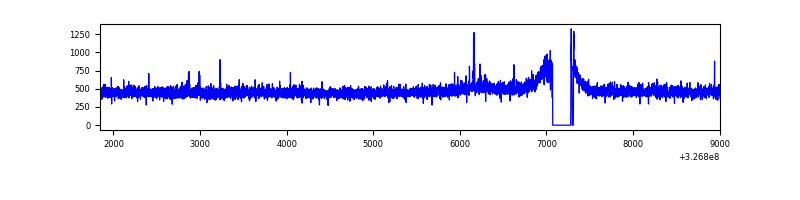 |
| D | 7160 | 6937 | 25 | 25 | 0.35% | 0.36% | 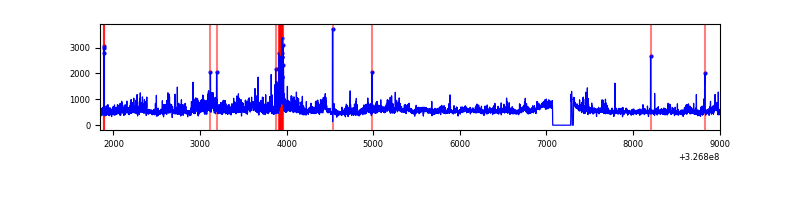 |
Top three noisy pixels from each quadrant. If the there are fewer than three noisy pixels in the level2.evt file, extra rows are filled as -1
| Pixel properties | Quadrant properties | ||||||
|---|---|---|---|---|---|---|---|
| Quadrant | DetID | PixID | Counts | Sigma | Mean | Median | Sigma |
| A | 13 | 254 | 11309 | 62.85 | 824 | 805 | 167.1 |
| A | 3 | 137 | 7576 | 40.52 | 824 | 805 | 167.1 |
| A | 0 | 226 | 7027 | 37.23 | 824 | 805 | 167.1 |
| B | 0 | 229 | 217858 | 1408.7 | 812 | 789 | 154.1 |
| B | 3 | 64 | 152779 | 986.36 | 812 | 789 | 154.1 |
| B | 4 | 80 | 57829 | 370.17 | 812 | 789 | 154.1 |
| C | 14 | 238 | 123961 | 669.99 | 784 | 787 | 183.8 |
| C | 7 | 247 | 50409 | 269.91 | 784 | 787 | 183.8 |
| C | 3 | 233 | 24685 | 129.99 | 784 | 787 | 183.8 |
| D | 8 | 195 | 516710 | 2720.29 | 794 | 769 | 189.7 |
| D | 1 | 52 | 343721 | 1808.21 | 794 | 769 | 189.7 |
| D | 1 | 3 | 165960 | 870.97 | 794 | 769 | 189.7 |
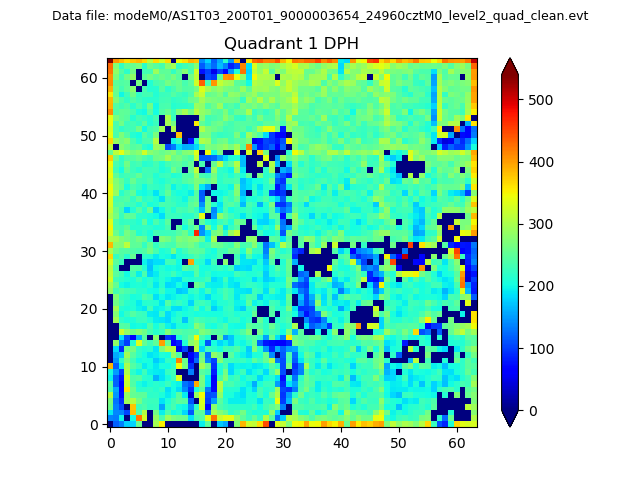
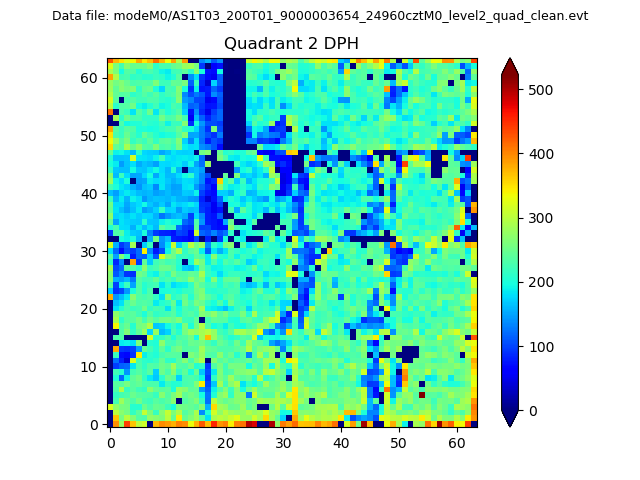
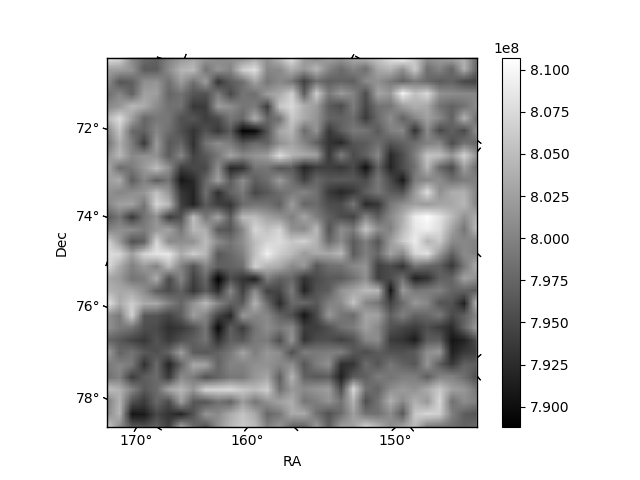
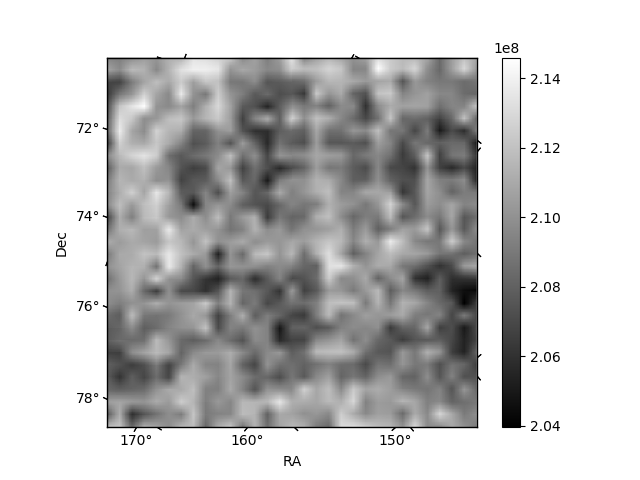
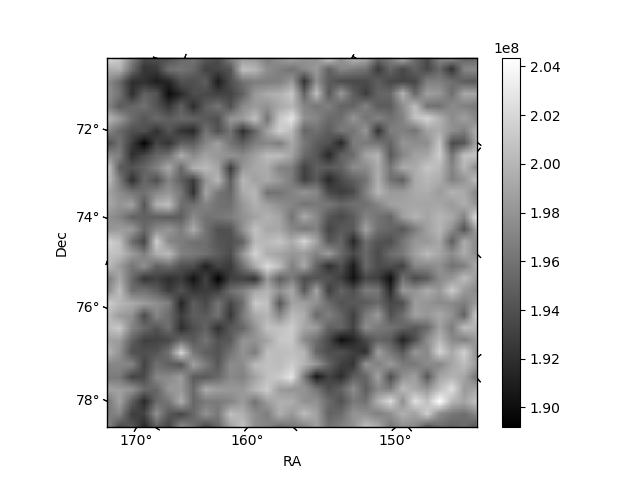
Histogram calculated using DETX and DETY for each event in the final _common_clean file
| Quadrant A |  |
 |
Quadrant B |
|---|---|---|---|
| Quadrant D | 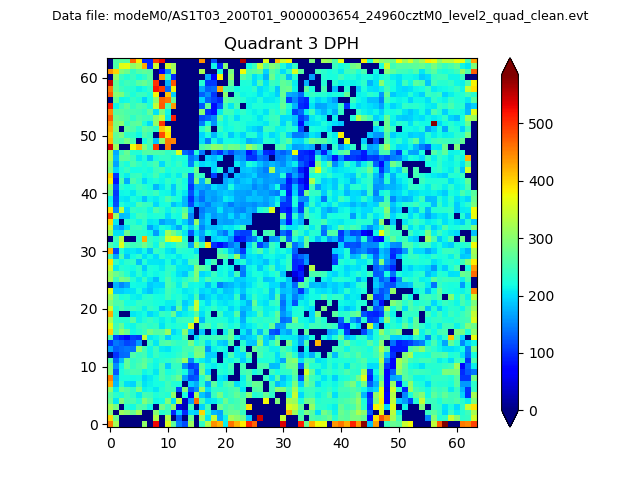 |
 |
Quadrant C |
| Plot type | Count rate plots | Images |
|---|---|---|
| Comparison with Poisson distribution Blue bars denote a histogram of data divided into 1 sec bins. Red curve is a Poisson curve with rate = median count rate of data. |
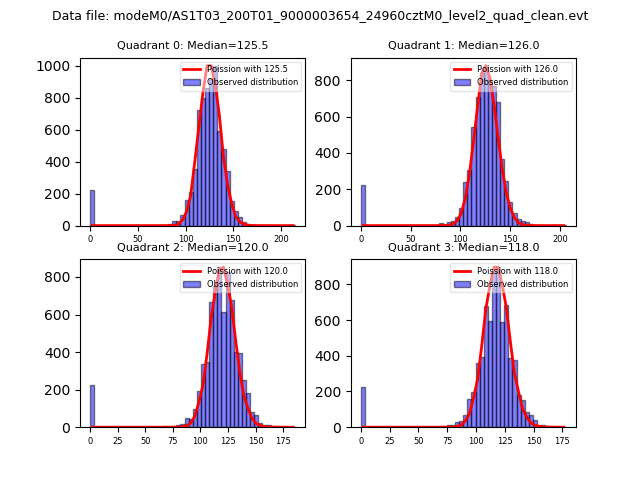 |
 |
| Quadrant-wise count rates Data is divided into 100 sec bins |
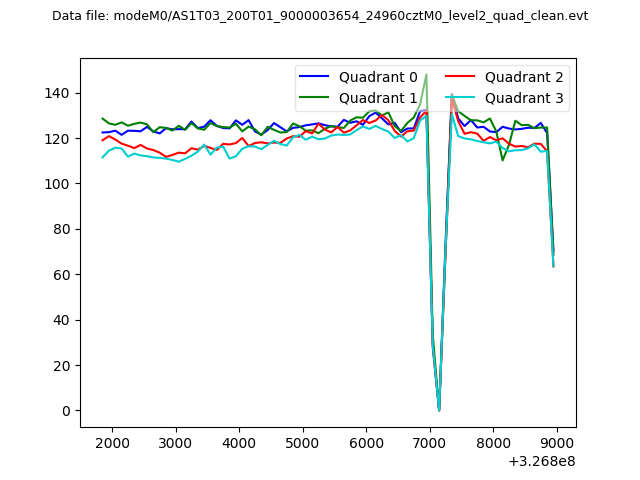 |
|
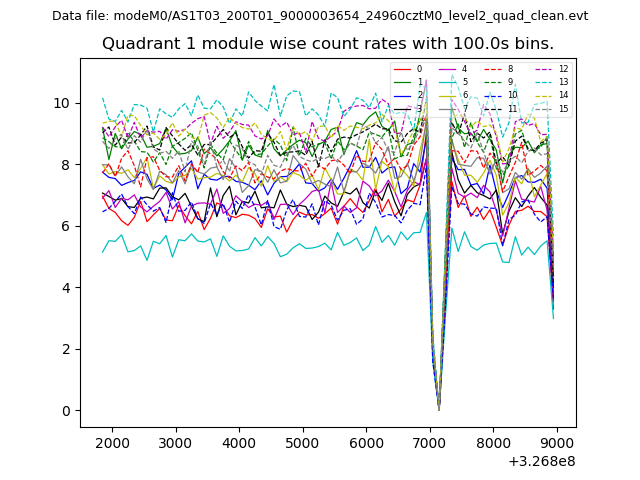
| Module-wise count rates for Quadrant A Data is divided into 100 sec bins |
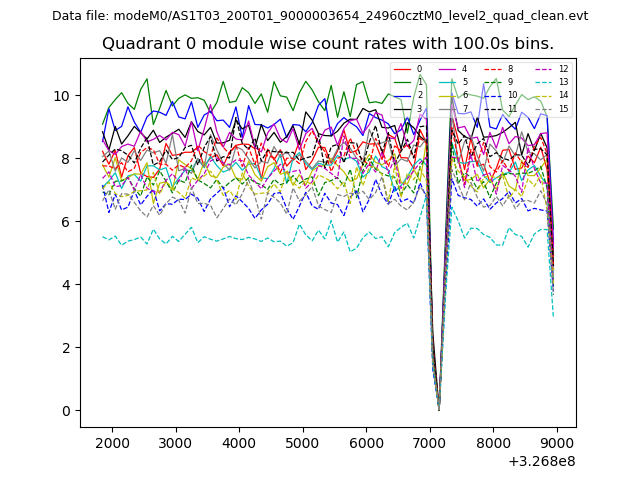 |
 |
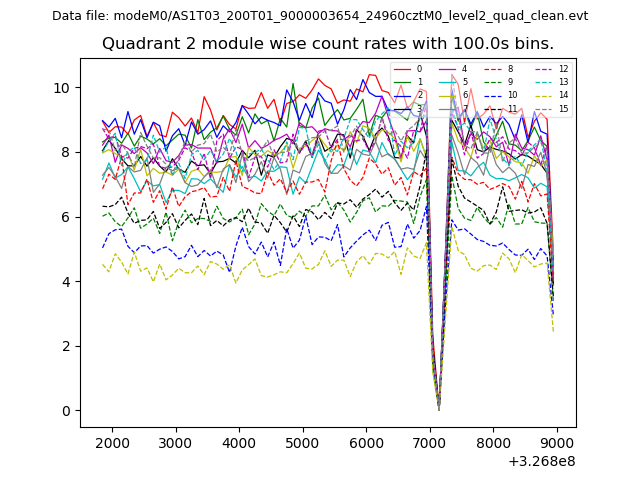
| Module-wise count rates for Quadrant B Data is divided into 100 sec bins |
 |
 |
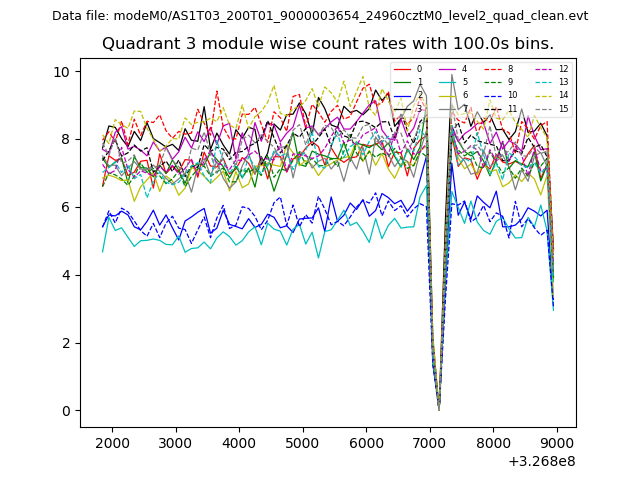
| Module-wise count rates for Quadrant C Data is divided into 100 sec bins |
 |
 |
| Module-wise count rates for Quadrant D Data is divided into 100 sec bins |
 |
 |
| Parameter | Plot |
|---|---|
| CZT HV Monitor | 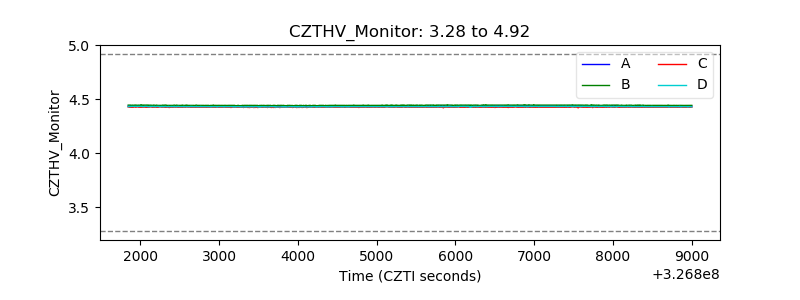 |
| D_VDD | 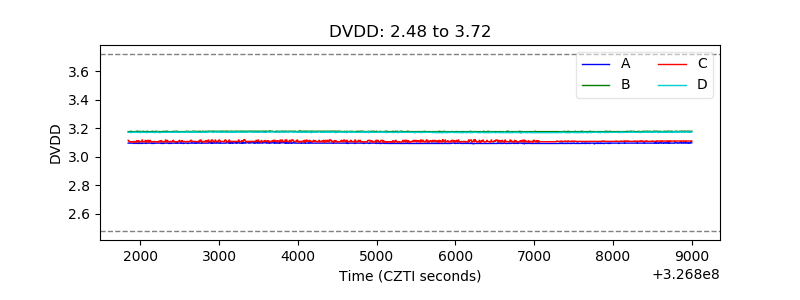 |
| Temperature 1 | 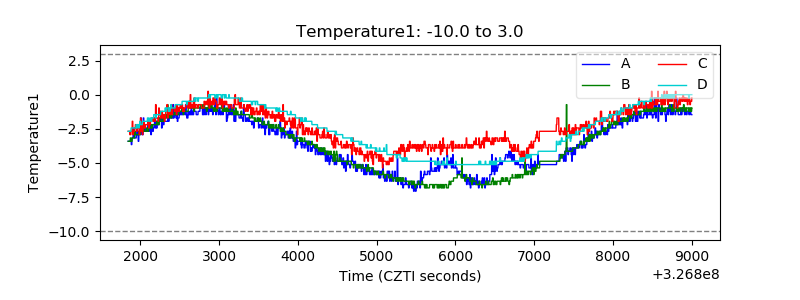 |
| Veto HV Monitor | 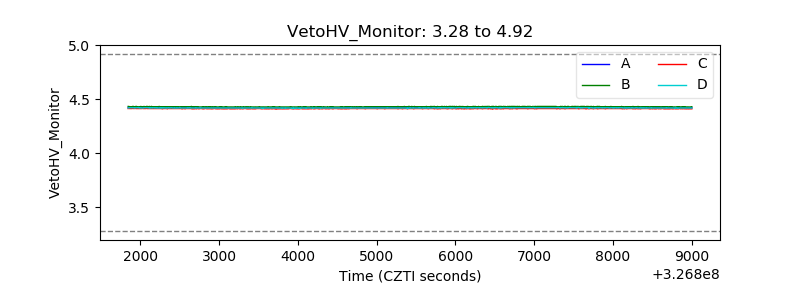 |
| Veto LLD | 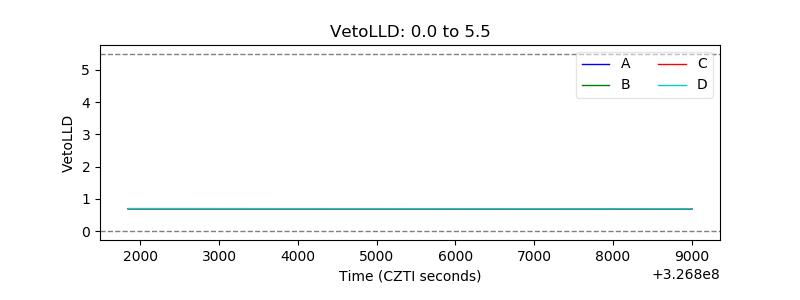 |
| Alpha Counter | 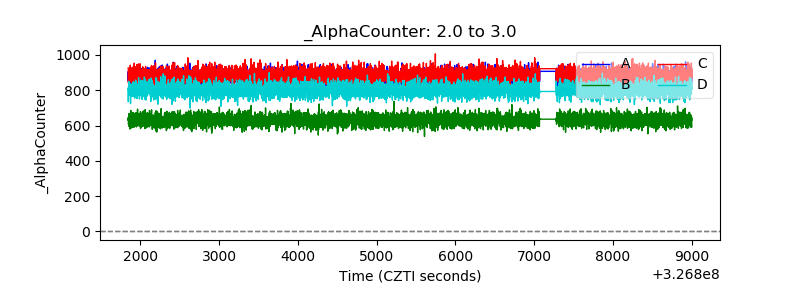 |
| _CPM_Rate | 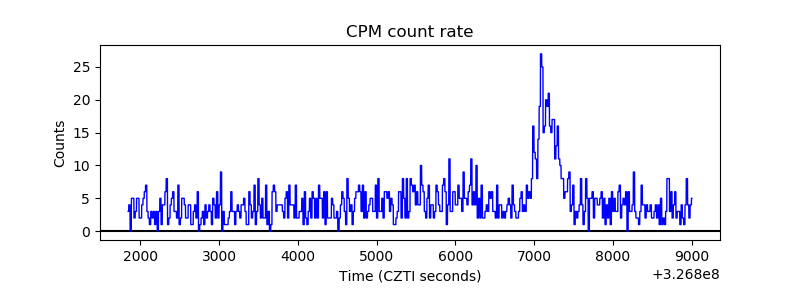 |
| CZT Counter | 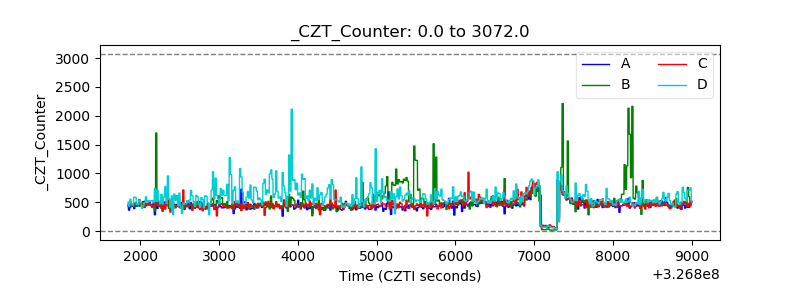 |
| +2.5 Volts monitor |  |
| +5 Volts monitor |  |
| _ROLL_ROT | 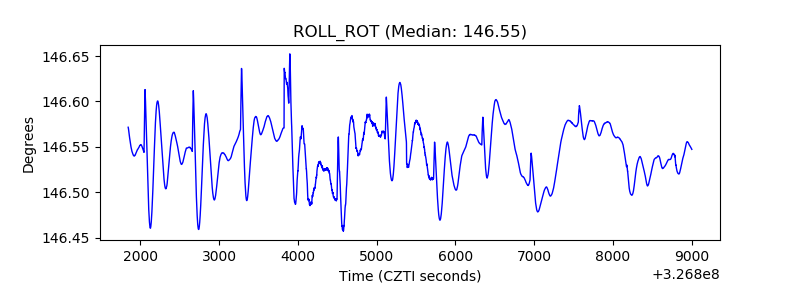 |
| _Roll_DEC | 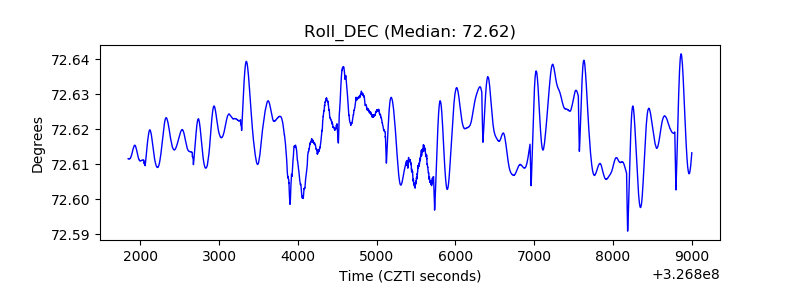 |
| _Roll_RA | 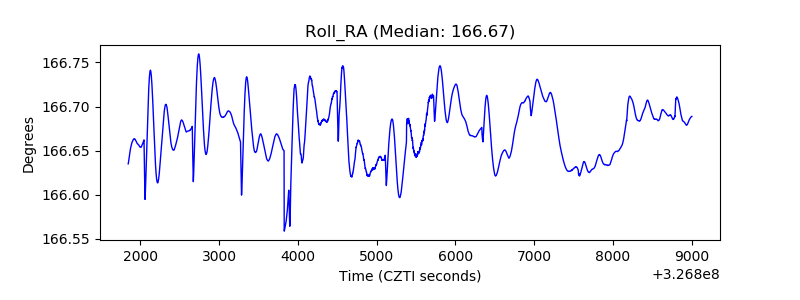 |
| Veto Counter | 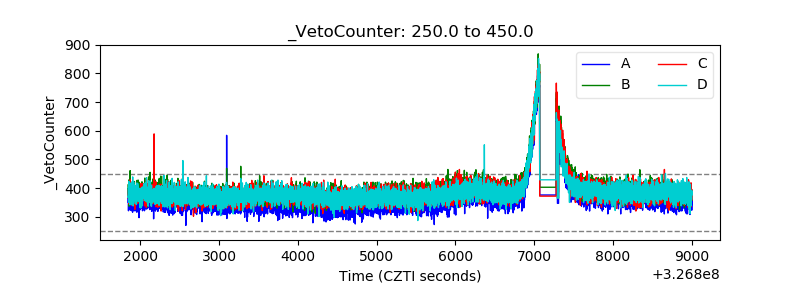 |