| Param | Original file | Final file |
|---|---|---|
| Filename | modeM0/AS1T03_200T01_9000003654_24964cztM0_level2.evt | modeM0/AS1T03_200T01_9000003654_24964cztM0_level2_quad_clean.evt |
| Size (bytes) | 459,472,320 | 124,793,280 |
| Size | 438.2 MB | 119.0 MB |
| Events in quadrant A | 2,975,745 | 844,561 |
| Events in quadrant B | 3,315,877 | 855,526 |
| Events in quadrant C | 3,336,067 | 825,819 |
| Events in quadrant D | 3,848,677 | 803,395 |
| Mode M9 | |||
|---|---|---|---|
| Quadrant | BADHDUFLAG | Total packets | Discarded packets |
| A | 0 | 10 | 0 |
| B | 0 | 10 | 0 |
| C | 0 | 10 | 0 |
| D | 0 | 10 | 0 |
| Mode SS | |||
|---|---|---|---|
| Quadrant | BADHDUFLAG | Total packets | Discarded packets |
| A | 0 | 132 | 0 |
| B | 0 | 132 | 0 |
| C | 0 | 132 | 0 |
| D | 0 | 132 | 0 |
| Mode M0 | |||
|---|---|---|---|
| Quadrant | BADHDUFLAG | Total packets | Discarded packets |
| A | 0 | 13235 | 1 |
| B | 0 | 14265 | 1 |
| C | 0 | 14365 | 1 |
| D | 0 | 15854 | 1 |
| Quadrant | Total seconds | Saturated seconds | Saturation percentage |
|---|---|---|---|
| A | 6456 | 13 | 0.201363% |
| B | 6457 | 75 | 1.161530% |
| C | 6457 | 68 | 1.053121% |
| D | 6457 | 52 | 0.805328% |
Noise dominated data is calculated using 1-second bins in cleaned event files. If a bin has >2000 counts, and if more than 50% of those come from <1% of pixels, then it is considered to be noise-dominated and hence unusable.
| Quadrant | # 1 sec bins | Bins with >0 counts | Bins with >2000 counts | High rate bins dominated by noise | Noise dominated (total time) | Noise dominated (detector-on time) | Marked lightcurve |
|---|---|---|---|---|---|---|---|
| A | 7501 | 6457 | 0 | 0 | 0.00% | 0.00% | 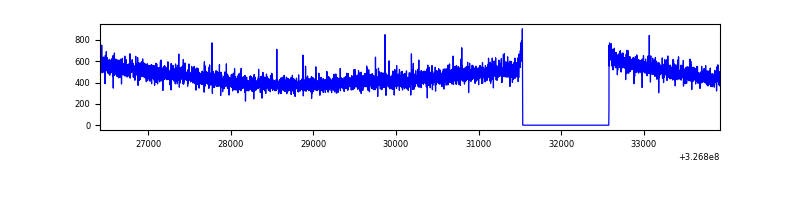 |
| B | 7502 | 6458 | 28 | 28 | 0.37% | 0.43% | 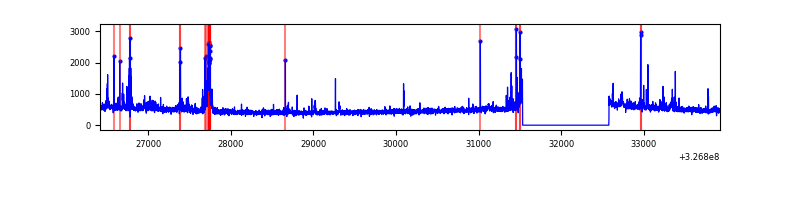 |
| C | 7502 | 6458 | 1 | 1 | 0.01% | 0.02% | 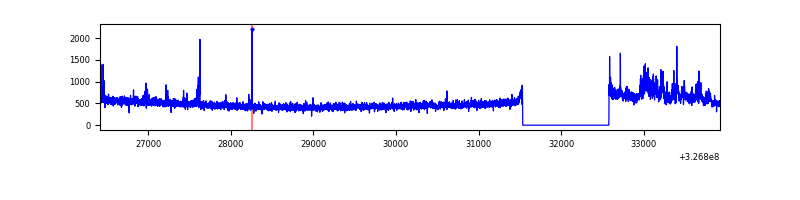 |
| D | 7502 | 6458 | 18 | 18 | 0.24% | 0.28% | 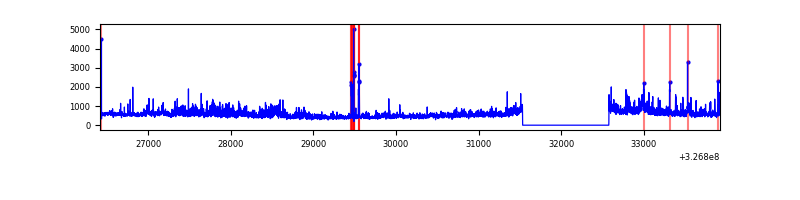 |
Top three noisy pixels from each quadrant. If the there are fewer than three noisy pixels in the level2.evt file, extra rows are filled as -1
| Pixel properties | Quadrant properties | ||||||
|---|---|---|---|---|---|---|---|
| Quadrant | DetID | PixID | Counts | Sigma | Mean | Median | Sigma |
| A | 13 | 254 | 10655 | 63.98 | 770 | 753 | 154.8 |
| A | 3 | 137 | 6691 | 38.36 | 770 | 753 | 154.8 |
| A | 0 | 226 | 6669 | 38.22 | 770 | 753 | 154.8 |
| B | 5 | 172 | 81128 | 552.97 | 769 | 748 | 145.4 |
| B | 3 | 64 | 53142 | 360.44 | 769 | 748 | 145.4 |
| B | 0 | 190 | 40459 | 273.19 | 769 | 748 | 145.4 |
| C | 7 | 247 | 241051 | 1381.66 | 750 | 755 | 173.9 |
| C | 14 | 238 | 119032 | 680.07 | 750 | 755 | 173.9 |
| C | 2 | 16 | 20691 | 114.63 | 750 | 755 | 173.9 |
| D | 8 | 195 | 455783 | 2499.35 | 756 | 733 | 182.1 |
| D | 1 | 52 | 448658 | 2460.22 | 756 | 733 | 182.1 |
| D | 2 | 234 | 26715 | 142.71 | 756 | 733 | 182.1 |
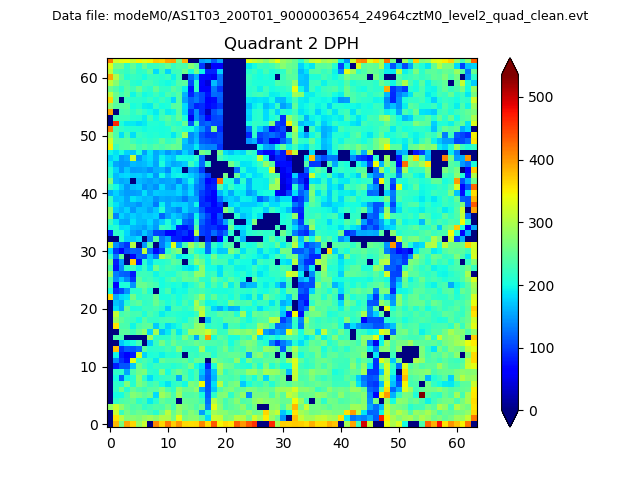
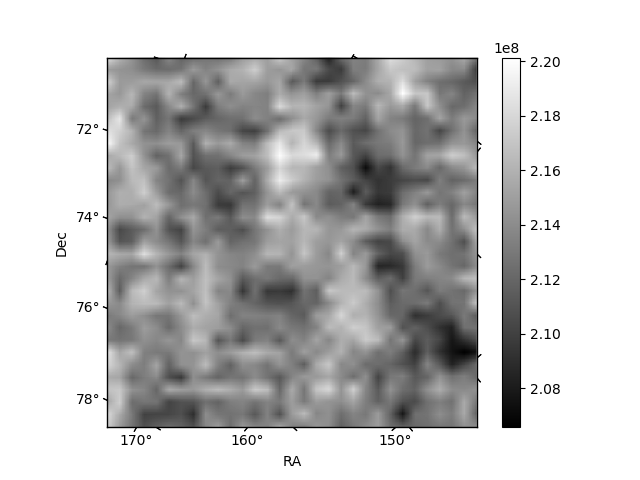
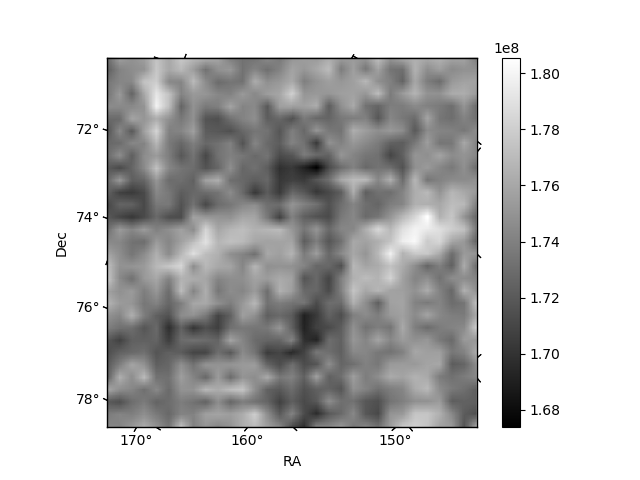
Histogram calculated using DETX and DETY for each event in the final _common_clean file
| Quadrant A | 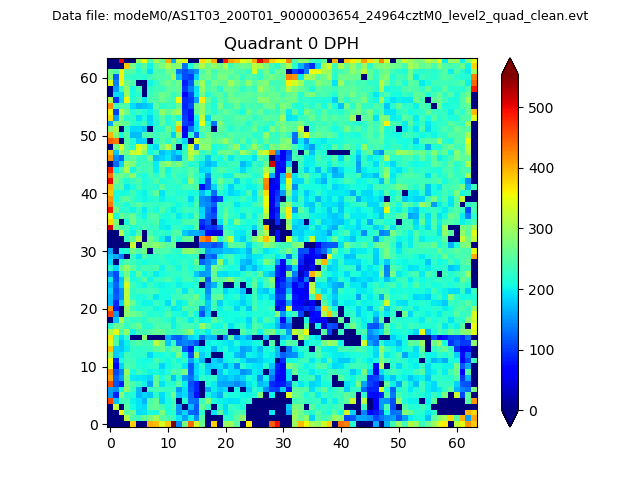 |
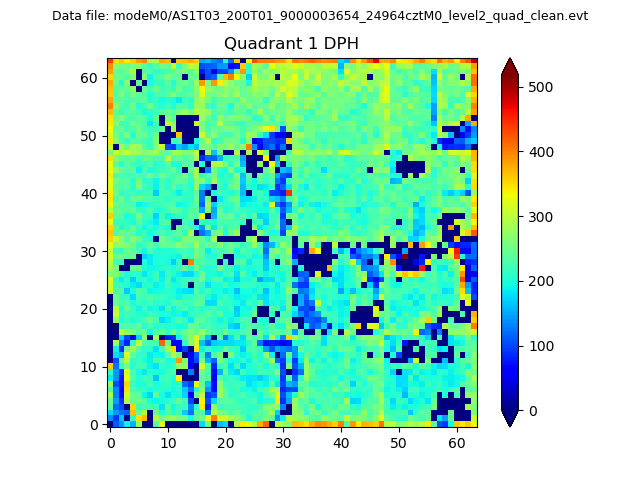 |
Quadrant B |
|---|---|---|---|
| Quadrant D | 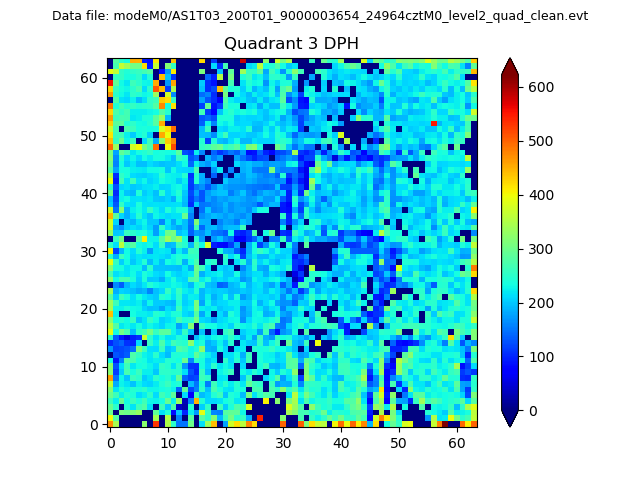 |
 |
Quadrant C |
| Plot type | Count rate plots | Images |
|---|---|---|
| Comparison with Poisson distribution Blue bars denote a histogram of data divided into 1 sec bins. Red curve is a Poisson curve with rate = median count rate of data. |
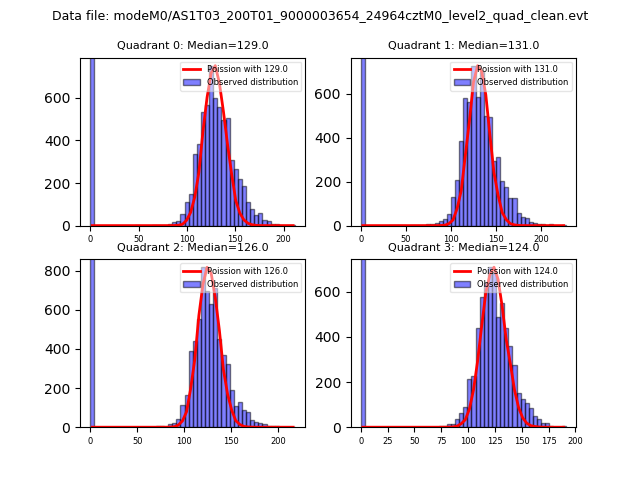 |
 |
| Quadrant-wise count rates Data is divided into 100 sec bins |
 |
|
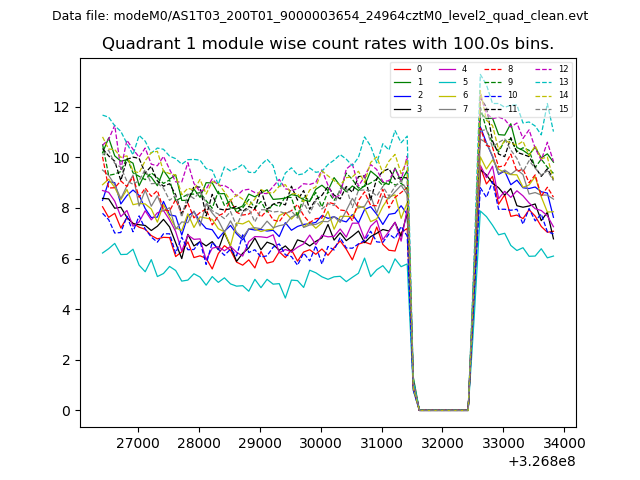
| Module-wise count rates for Quadrant A Data is divided into 100 sec bins |
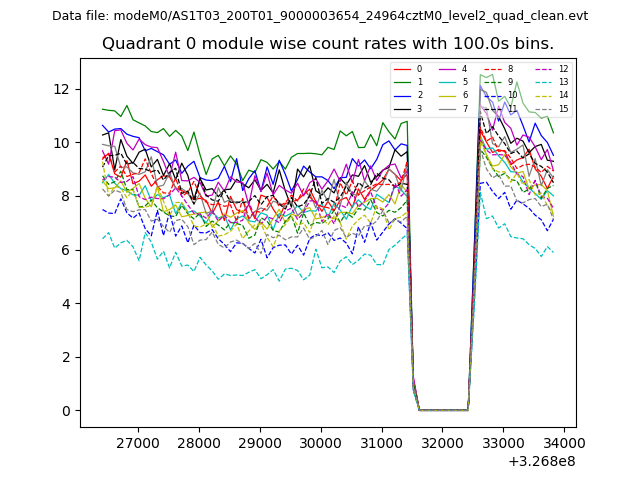 |
 |
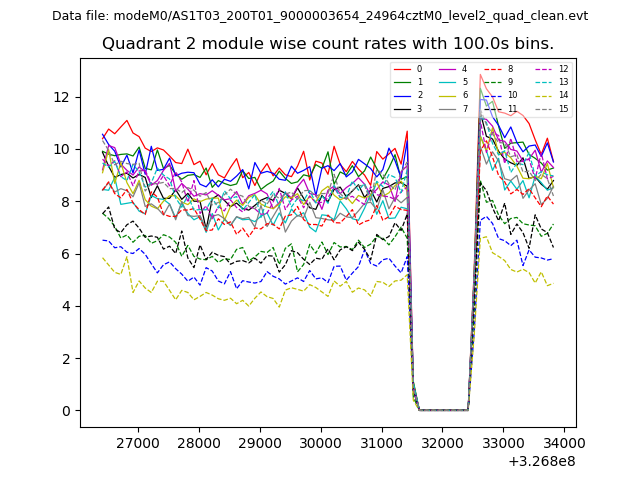
| Module-wise count rates for Quadrant B Data is divided into 100 sec bins |
 |
 |
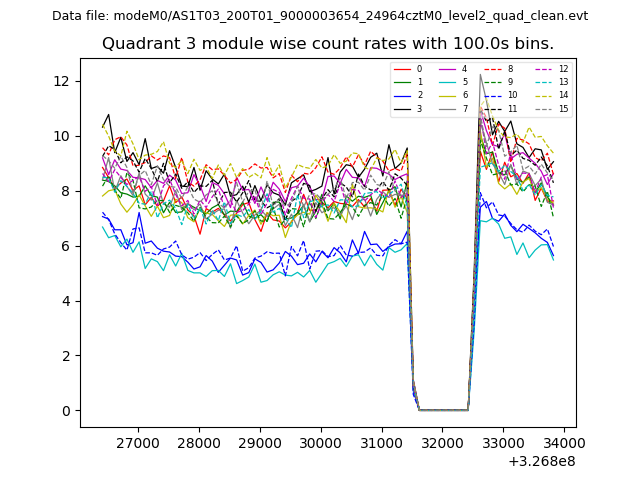
| Module-wise count rates for Quadrant C Data is divided into 100 sec bins |
 |
 |
| Module-wise count rates for Quadrant D Data is divided into 100 sec bins |
 |
 |
| Parameter | Plot |
|---|---|
| CZT HV Monitor | 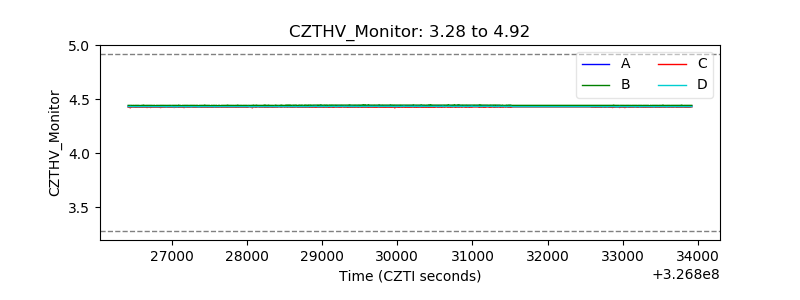 |
| D_VDD | 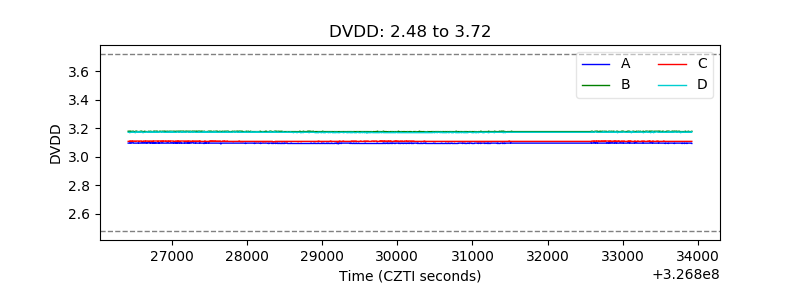 |
| Temperature 1 | 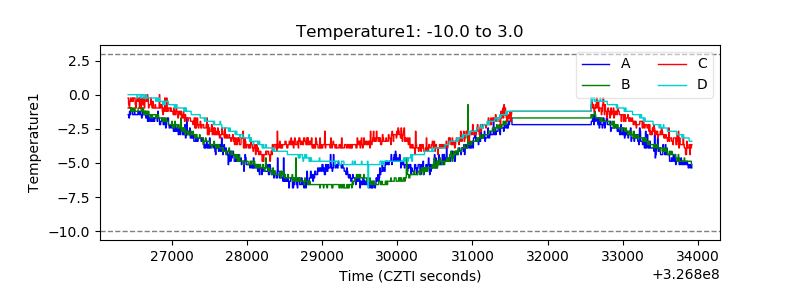 |
| Veto HV Monitor | 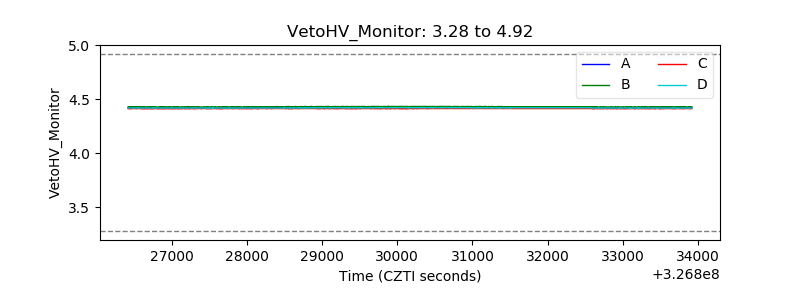 |
| Veto LLD | 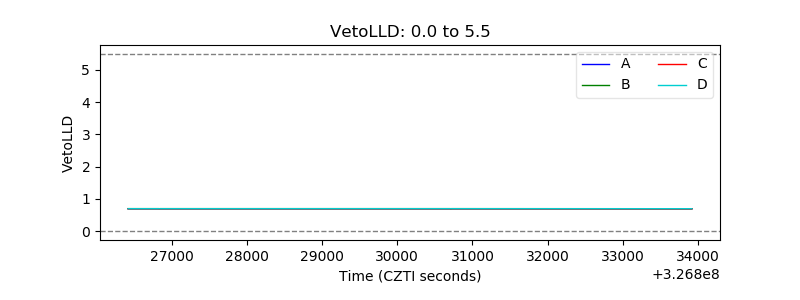 |
| Alpha Counter | 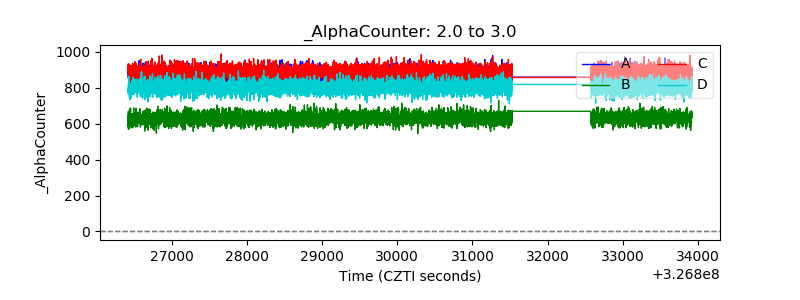 |
| _CPM_Rate | 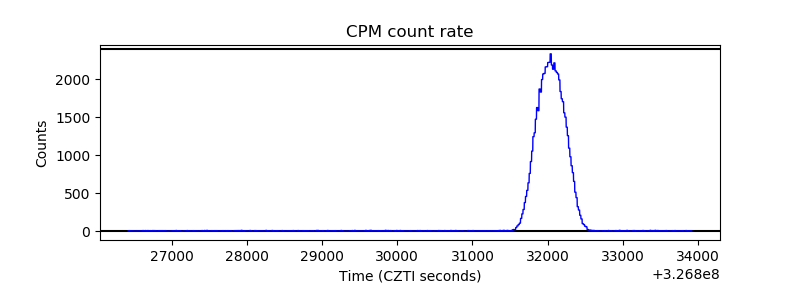 |
| CZT Counter | 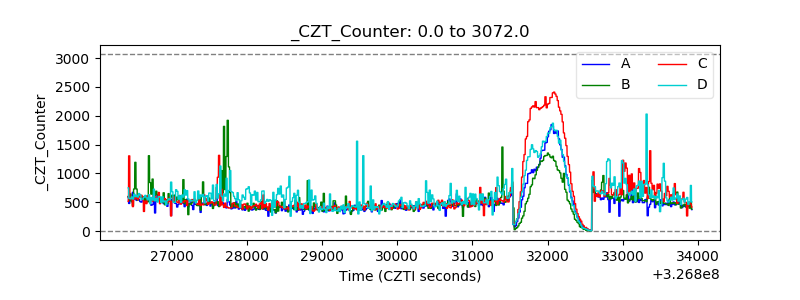 |
| +2.5 Volts monitor |  |
| +5 Volts monitor |  |
| _ROLL_ROT | 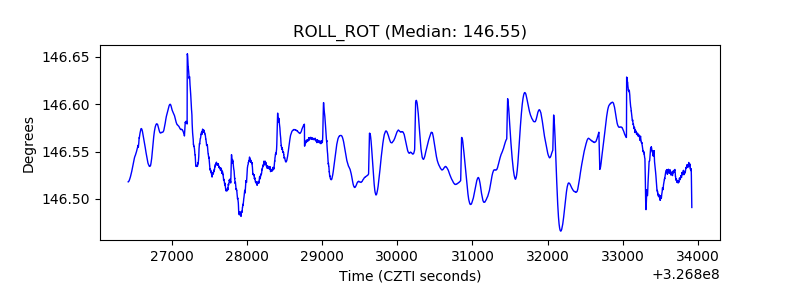 |
| _Roll_DEC | 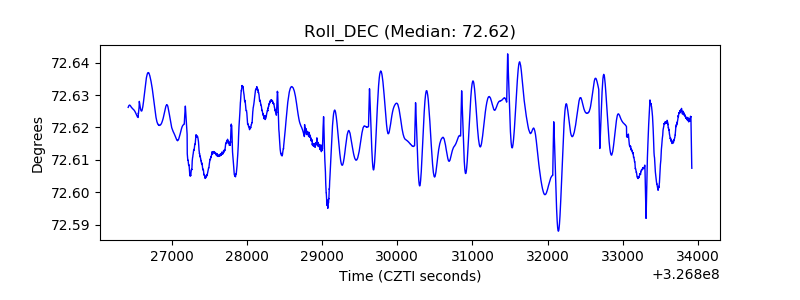 |
| _Roll_RA | 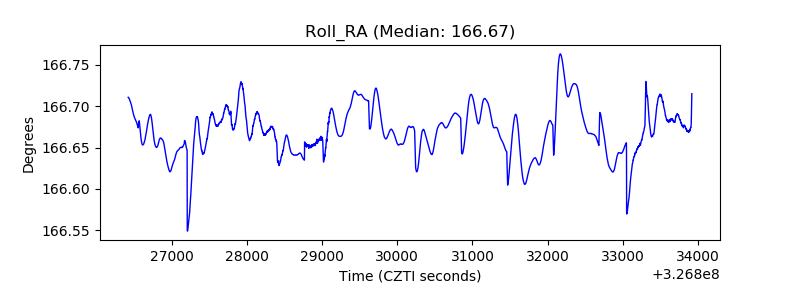 |
| Veto Counter | 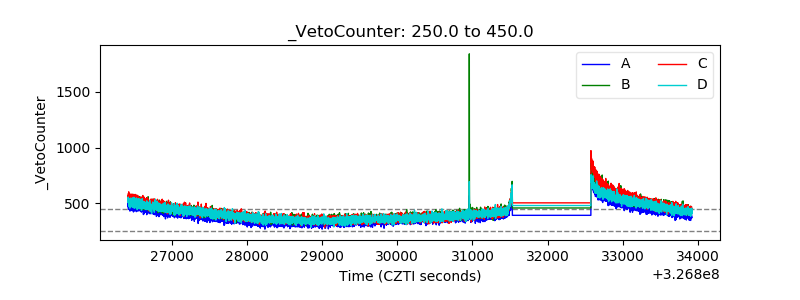 |