| Param | Original file | Final file |
|---|---|---|
| Filename | modeM0/AS1T03_200T01_9000003654_24966cztM0_level2.evt | modeM0/AS1T03_200T01_9000003654_24966cztM0_level2_quad_clean.evt |
| Size (bytes) | 473,316,480 | 129,576,960 |
| Size | 451.4 MB | 123.6 MB |
| Events in quadrant A | 3,027,486 | 877,165 |
| Events in quadrant B | 3,595,851 | 895,197 |
| Events in quadrant C | 3,639,813 | 866,678 |
| Events in quadrant D | 3,637,224 | 839,680 |
| Mode M9 | |||
|---|---|---|---|
| Quadrant | BADHDUFLAG | Total packets | Discarded packets |
| A | 0 | 12 | 0 |
| B | 0 | 13 | 0 |
| C | 0 | 13 | 0 |
| D | 0 | 13 | 0 |
| Mode SS | |||
|---|---|---|---|
| Quadrant | BADHDUFLAG | Total packets | Discarded packets |
| A | 0 | 132 | 0 |
| B | 0 | 132 | 0 |
| C | 0 | 132 | 0 |
| D | 0 | 132 | 0 |
| Mode M0 | |||
|---|---|---|---|
| Quadrant | BADHDUFLAG | Total packets | Discarded packets |
| A | 0 | 13339 | 2 |
| B | 0 | 15033 | 2 |
| C | 0 | 14942 | 2 |
| D | 0 | 15190 | 2 |
| Quadrant | Total seconds | Saturated seconds | Saturation percentage |
|---|---|---|---|
| A | 6385 | 9 | 0.140955% |
| B | 6385 | 168 | 2.631167% |
| C | 6385 | 90 | 1.409554% |
| D | 6385 | 41 | 0.642130% |
Noise dominated data is calculated using 1-second bins in cleaned event files. If a bin has >2000 counts, and if more than 50% of those come from <1% of pixels, then it is considered to be noise-dominated and hence unusable.
| Quadrant | # 1 sec bins | Bins with >0 counts | Bins with >2000 counts | High rate bins dominated by noise | Noise dominated (total time) | Noise dominated (detector-on time) | Marked lightcurve |
|---|---|---|---|---|---|---|---|
| A | 7565 | 6386 | 1 | 1 | 0.01% | 0.02% | 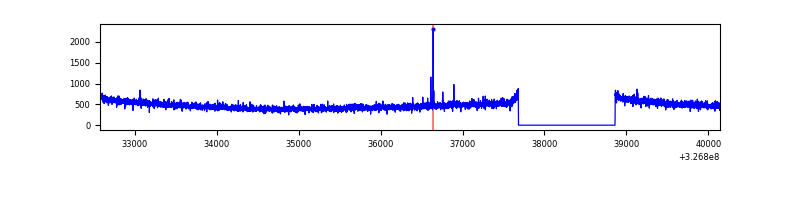 |
| B | 7565 | 6386 | 75 | 75 | 0.99% | 1.17% | 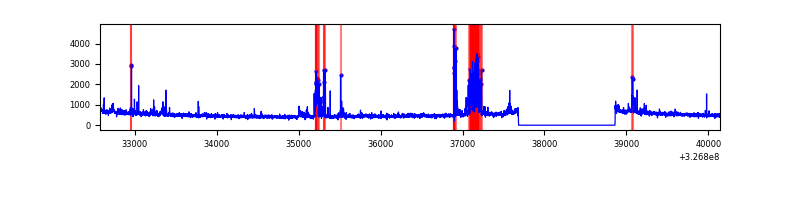 |
| C | 7565 | 6386 | 3 | 3 | 0.04% | 0.05% | 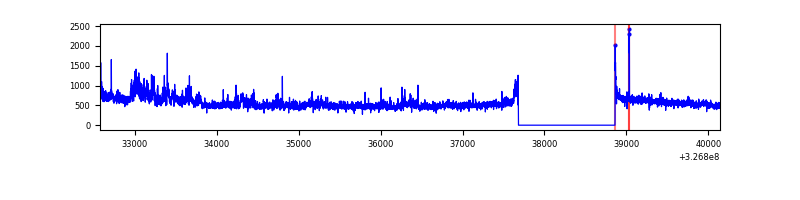 |
| D | 7565 | 6386 | 8 | 8 | 0.11% | 0.13% | 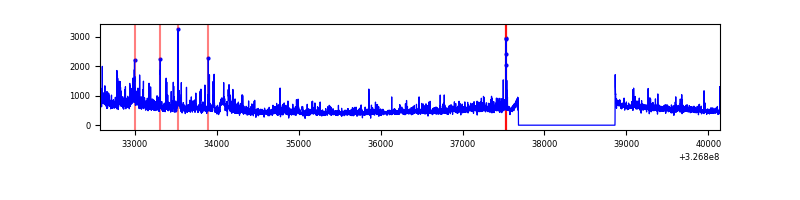 |
Top three noisy pixels from each quadrant. If the there are fewer than three noisy pixels in the level2.evt file, extra rows are filled as -1
| Pixel properties | Quadrant properties | ||||||
|---|---|---|---|---|---|---|---|
| Quadrant | DetID | PixID | Counts | Sigma | Mean | Median | Sigma |
| A | 13 | 254 | 10231 | 60.69 | 781 | 765 | 156.0 |
| A | 4 | 2 | 7424 | 42.7 | 781 | 765 | 156.0 |
| A | 0 | 226 | 6691 | 38.0 | 781 | 765 | 156.0 |
| B | 3 | 64 | 324922 | 2244.28 | 780 | 760 | 144.4 |
| B | 4 | 80 | 92611 | 635.91 | 780 | 760 | 144.4 |
| B | 0 | 190 | 52339 | 357.1 | 780 | 760 | 144.4 |
| C | 7 | 247 | 461348 | 2611.6 | 765 | 772 | 176.4 |
| C | 14 | 238 | 121972 | 687.24 | 765 | 772 | 176.4 |
| C | 3 | 233 | 39473 | 219.45 | 765 | 772 | 176.4 |
| D | 1 | 52 | 401106 | 2206.49 | 763 | 743 | 181.4 |
| D | 8 | 195 | 289433 | 1591.03 | 763 | 743 | 181.4 |
| D | 2 | 234 | 25135 | 134.43 | 763 | 743 | 181.4 |
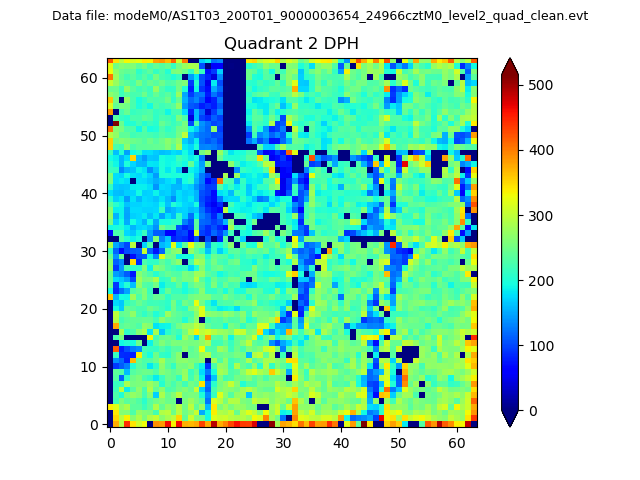
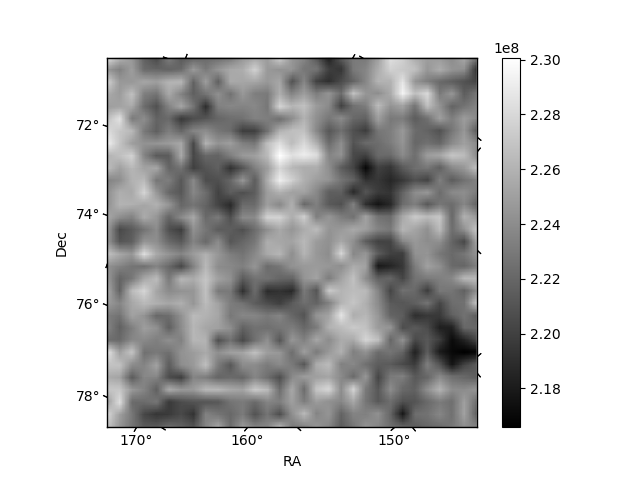
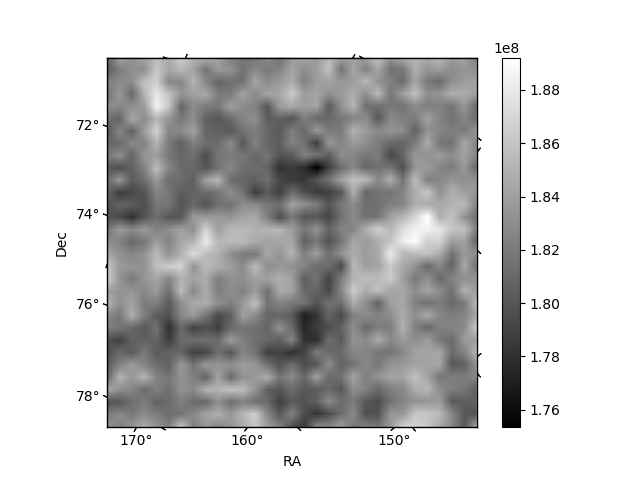
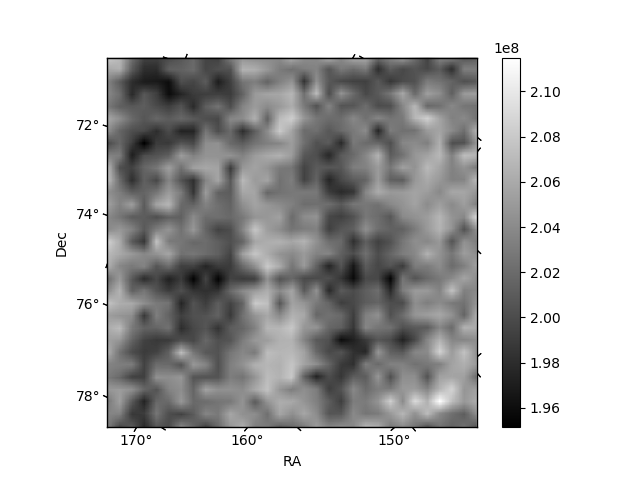
Histogram calculated using DETX and DETY for each event in the final _common_clean file
| Quadrant A | 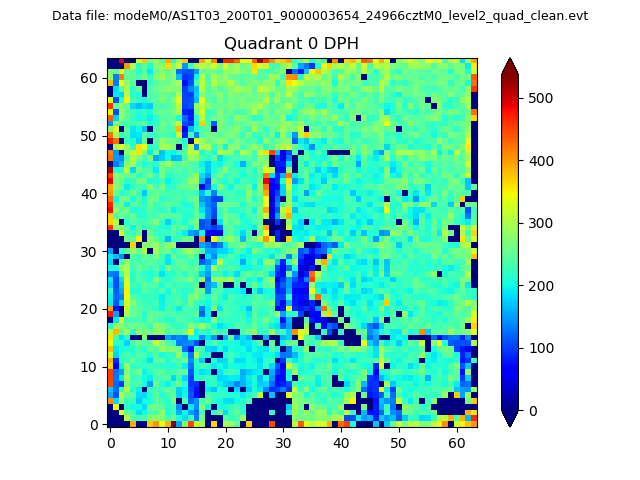 |
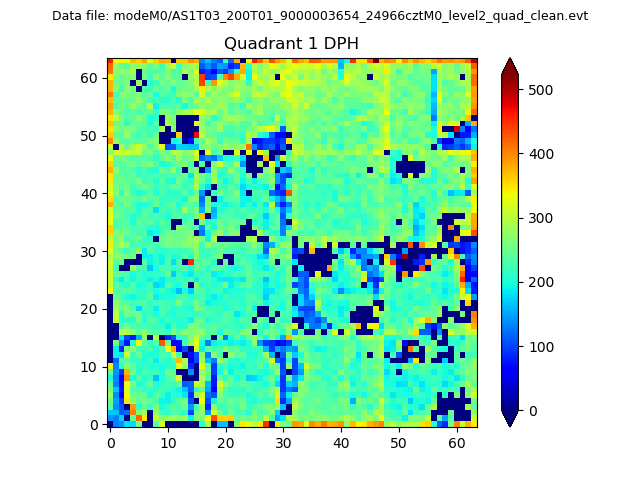 |
Quadrant B |
|---|---|---|---|
| Quadrant D | 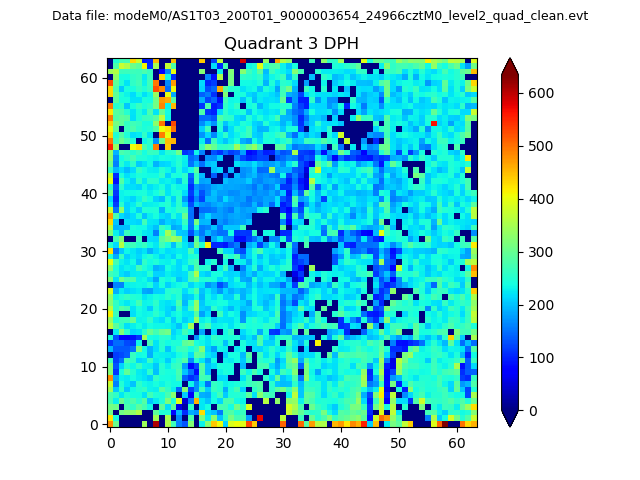 |
 |
Quadrant C |
| Plot type | Count rate plots | Images |
|---|---|---|
| Comparison with Poisson distribution Blue bars denote a histogram of data divided into 1 sec bins. Red curve is a Poisson curve with rate = median count rate of data. |
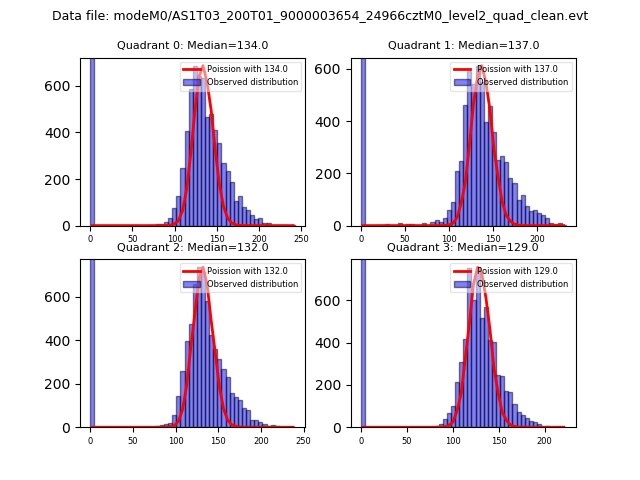 |
 |
| Quadrant-wise count rates Data is divided into 100 sec bins |
 |
|
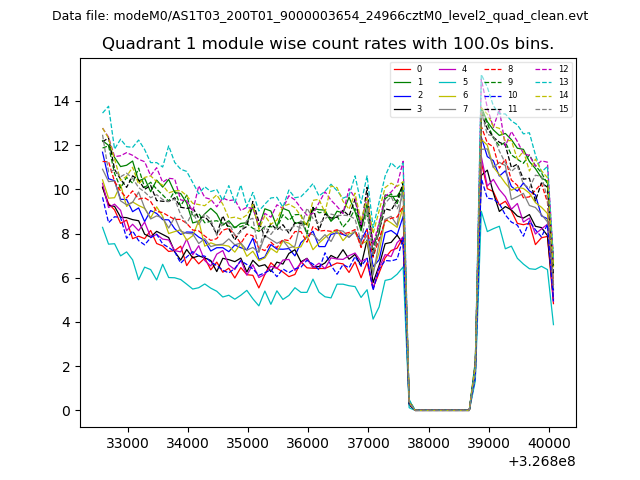
| Module-wise count rates for Quadrant A Data is divided into 100 sec bins |
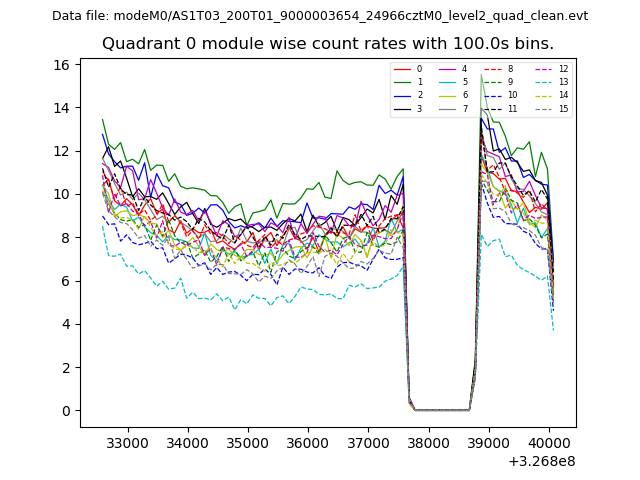 |
 |
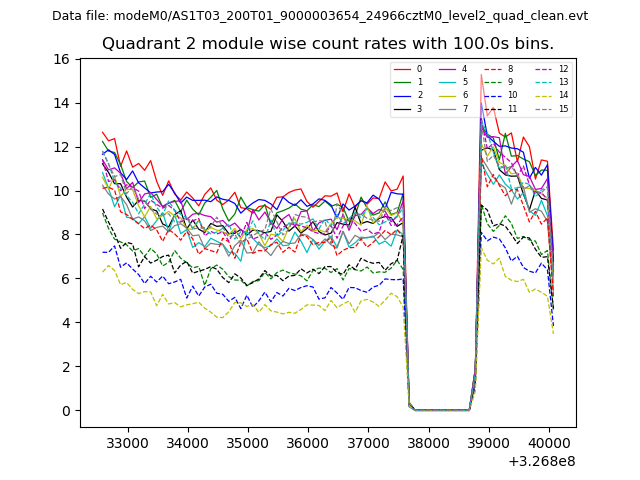
| Module-wise count rates for Quadrant B Data is divided into 100 sec bins |
 |
 |
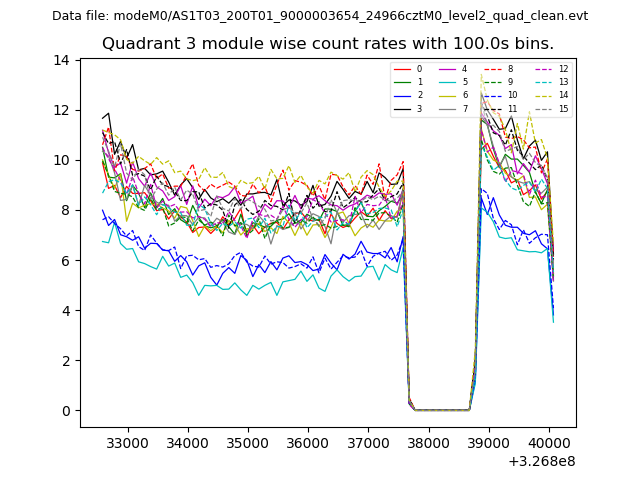
| Module-wise count rates for Quadrant C Data is divided into 100 sec bins |
 |
 |
| Module-wise count rates for Quadrant D Data is divided into 100 sec bins |
 |
 |
| Parameter | Plot |
|---|---|
| CZT HV Monitor | 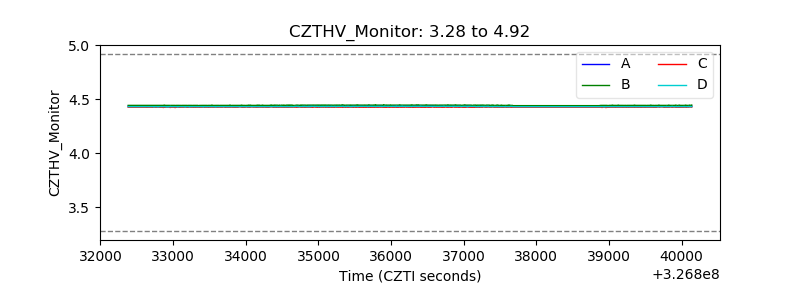 |
| D_VDD | 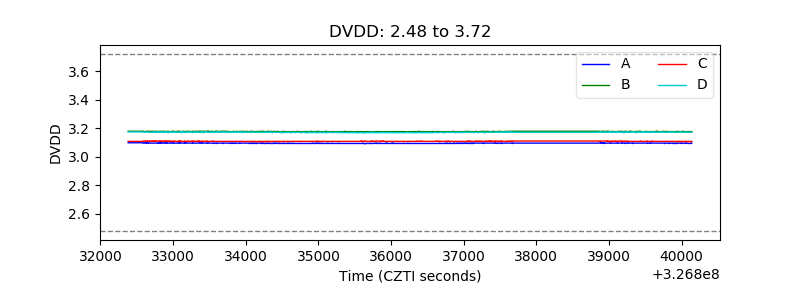 |
| Temperature 1 | 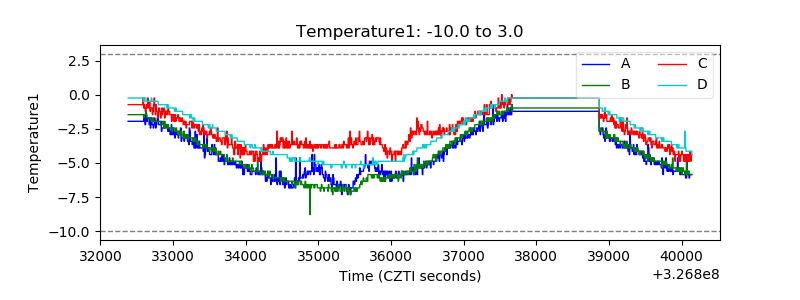 |
| Veto HV Monitor | 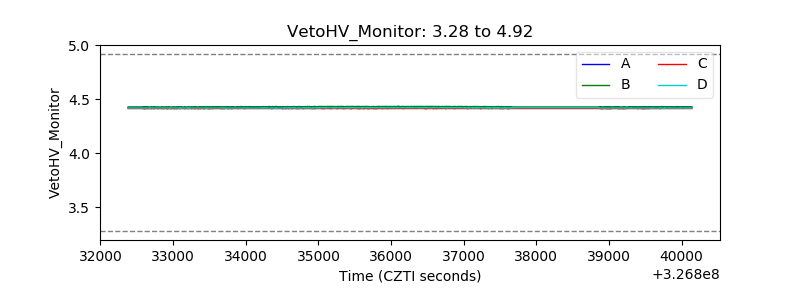 |
| Veto LLD |  |
| Alpha Counter | 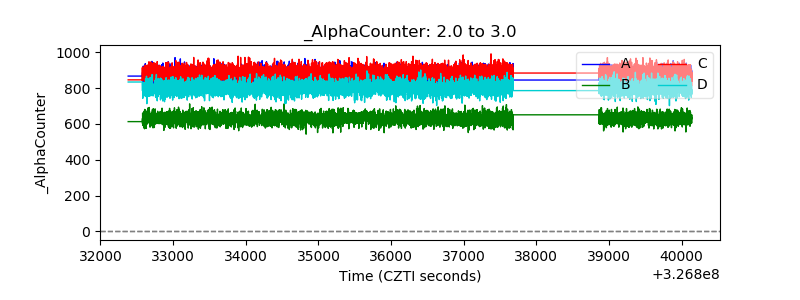 |
| _CPM_Rate | 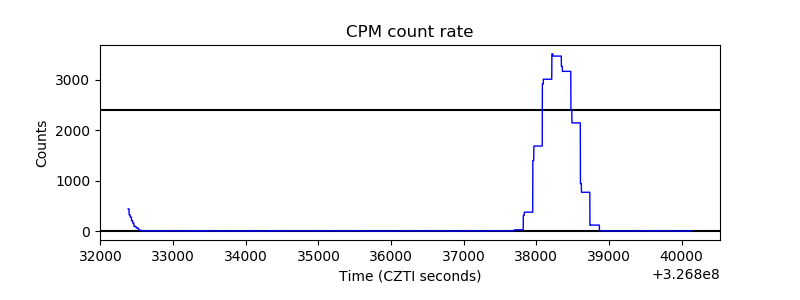 |
| CZT Counter | 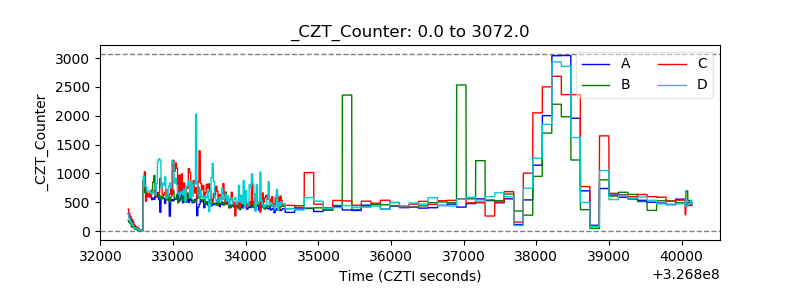 |
| +2.5 Volts monitor |  |
| +5 Volts monitor |  |
| _ROLL_ROT | 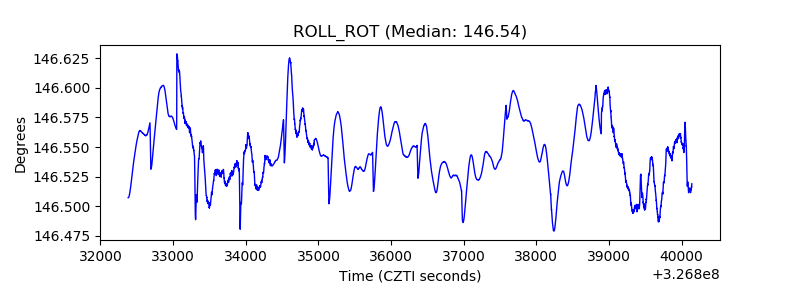 |
| _Roll_DEC | 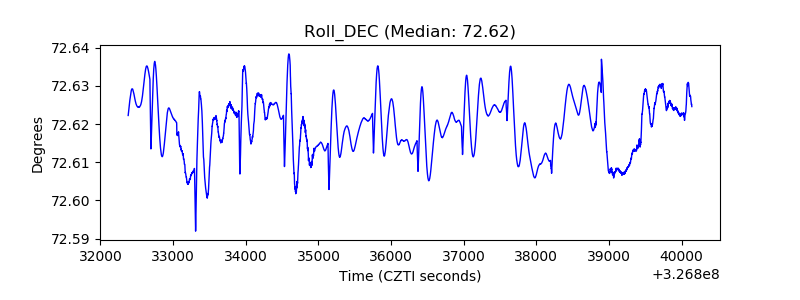 |
| _Roll_RA | 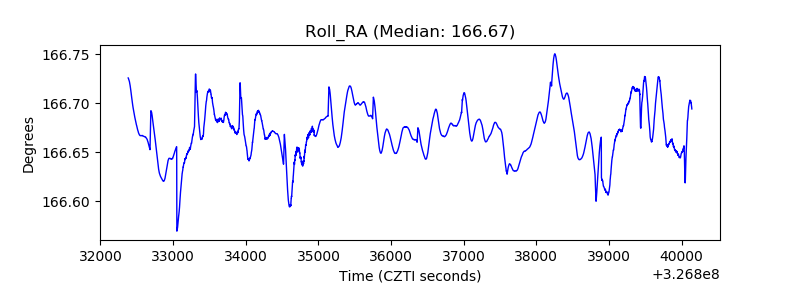 |
| Veto Counter | 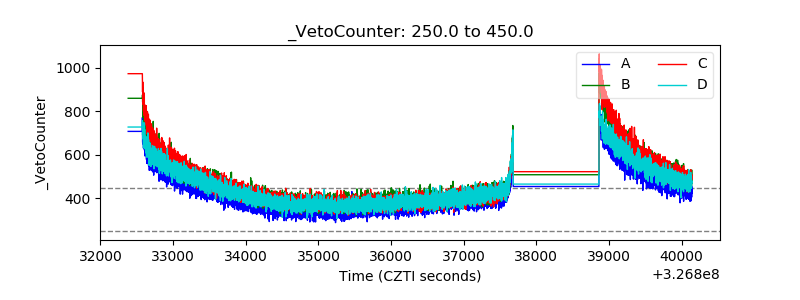 |