| Param | Original file | Final file |
|---|---|---|
| Filename | modeM0/AS1T03_200T01_9000003654_24967cztM0_level2.evt | modeM0/AS1T03_200T01_9000003654_24967cztM0_level2_quad_clean.evt |
| Size (bytes) | 449,683,200 | 133,274,880 |
| Size | 428.9 MB | 127.1 MB |
| Events in quadrant A | 3,020,332 | 904,173 |
| Events in quadrant B | 3,310,082 | 938,563 |
| Events in quadrant C | 3,392,134 | 896,244 |
| Events in quadrant D | 3,471,948 | 862,038 |
| Mode M9 | |||
|---|---|---|---|
| Quadrant | BADHDUFLAG | Total packets | Discarded packets |
| A | 0 | 19 | 0 |
| B | 0 | 20 | 0 |
| C | 0 | 20 | 0 |
| D | 0 | 20 | 0 |
| Mode SS | |||
|---|---|---|---|
| Quadrant | BADHDUFLAG | Total packets | Discarded packets |
| A | 0 | 128 | 0 |
| B | 0 | 128 | 0 |
| C | 0 | 128 | 0 |
| D | 0 | 128 | 0 |
| Mode M0 | |||
|---|---|---|---|
| Quadrant | BADHDUFLAG | Total packets | Discarded packets |
| A | 0 | 13122 | 2 |
| B | 0 | 13819 | 2 |
| C | 0 | 14200 | 2 |
| D | 0 | 14647 | 3 |
| Quadrant | Total seconds | Saturated seconds | Saturation percentage |
|---|---|---|---|
| A | 6238 | 12 | 0.192369% |
| B | 6238 | 46 | 0.737416% |
| C | 6238 | 135 | 2.164155% |
| D | 6237 | 38 | 0.609267% |
Noise dominated data is calculated using 1-second bins in cleaned event files. If a bin has >2000 counts, and if more than 50% of those come from <1% of pixels, then it is considered to be noise-dominated and hence unusable.
| Quadrant | # 1 sec bins | Bins with >0 counts | Bins with >2000 counts | High rate bins dominated by noise | Noise dominated (total time) | Noise dominated (detector-on time) | Marked lightcurve |
|---|---|---|---|---|---|---|---|
| A | 7523 | 6239 | 0 | 0 | 0.00% | 0.00% | 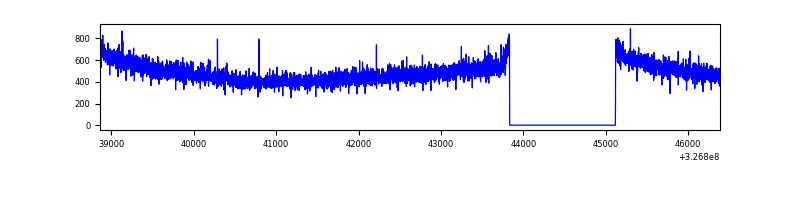 |
| B | 7523 | 6239 | 12 | 12 | 0.16% | 0.19% | 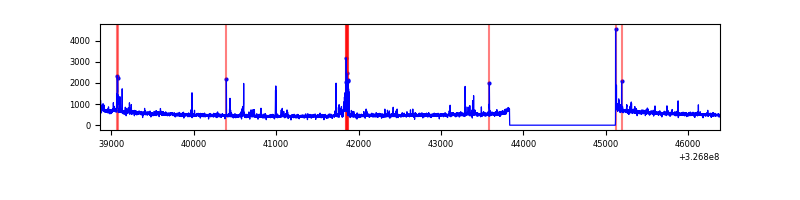 |
| C | 7523 | 6239 | 44 | 44 | 0.58% | 0.71% | 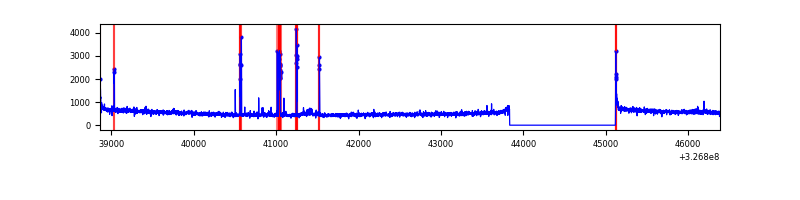 |
| D | 7522 | 6238 | 8 | 8 | 0.11% | 0.13% | 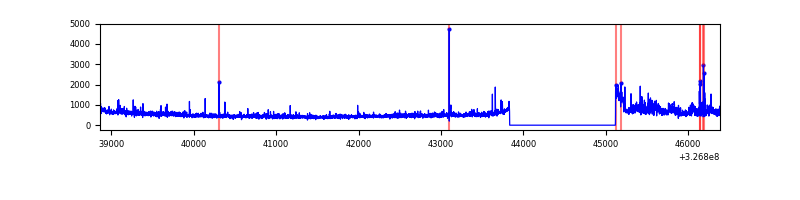 |
Top three noisy pixels from each quadrant. If the there are fewer than three noisy pixels in the level2.evt file, extra rows are filled as -1
| Pixel properties | Quadrant properties | ||||||
|---|---|---|---|---|---|---|---|
| Quadrant | DetID | PixID | Counts | Sigma | Mean | Median | Sigma |
| A | 5 | 203 | 9971 | 59.15 | 780 | 767 | 155.6 |
| A | 13 | 254 | 9359 | 55.22 | 780 | 767 | 155.6 |
| A | 0 | 226 | 6657 | 37.85 | 780 | 767 | 155.6 |
| B | 3 | 64 | 112603 | 772.86 | 792 | 773 | 144.7 |
| B | 0 | 190 | 46725 | 317.58 | 792 | 773 | 144.7 |
| B | 5 | 172 | 20256 | 134.65 | 792 | 773 | 144.7 |
| C | 7 | 247 | 222166 | 1263.54 | 764 | 769 | 175.2 |
| C | 14 | 238 | 123999 | 703.29 | 764 | 769 | 175.2 |
| C | 0 | 10 | 31479 | 175.27 | 764 | 769 | 175.2 |
| D | 1 | 52 | 418222 | 2272.43 | 765 | 743 | 183.7 |
| D | 8 | 195 | 111976 | 605.47 | 765 | 743 | 183.7 |
| D | 2 | 234 | 23711 | 125.02 | 765 | 743 | 183.7 |
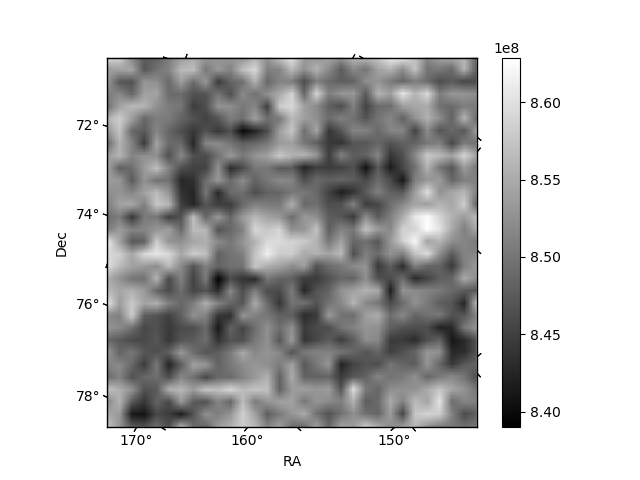
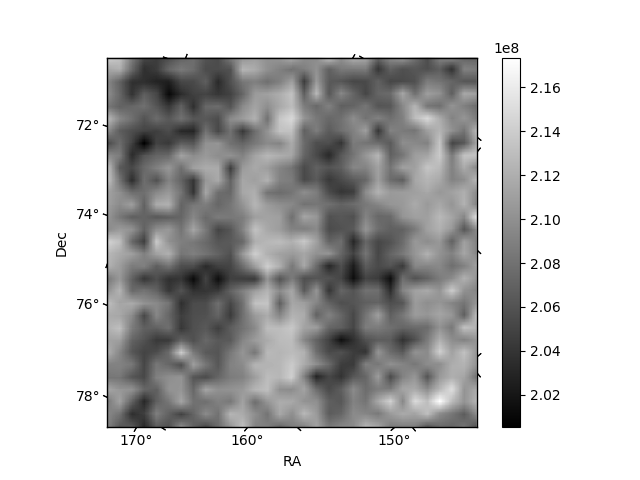
Histogram calculated using DETX and DETY for each event in the final _common_clean file
| Quadrant A | 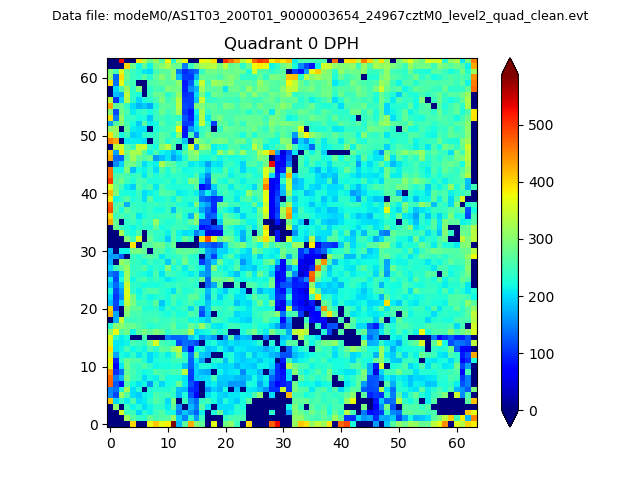 |
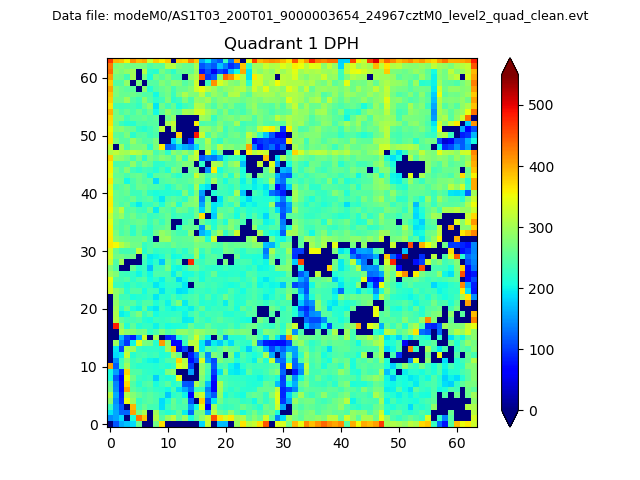 |
Quadrant B |
|---|---|---|---|
| Quadrant D | 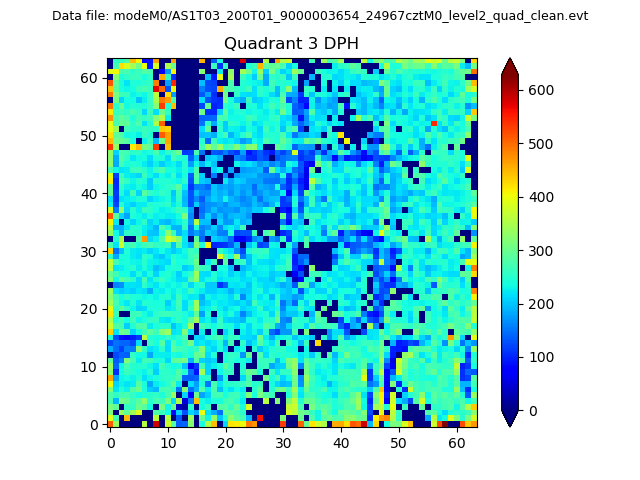 |
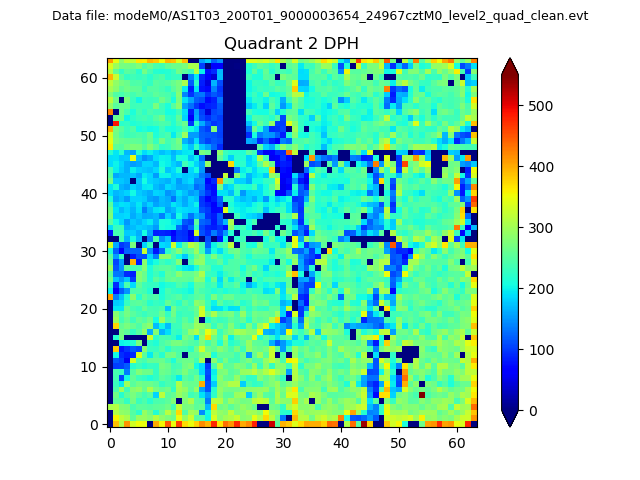 |
Quadrant C |
| Plot type | Count rate plots | Images |
|---|---|---|
| Comparison with Poisson distribution Blue bars denote a histogram of data divided into 1 sec bins. Red curve is a Poisson curve with rate = median count rate of data. |
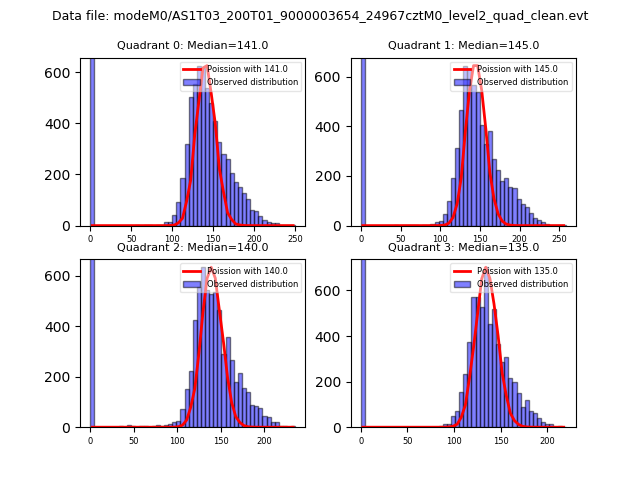 |
 |
| Quadrant-wise count rates Data is divided into 100 sec bins |
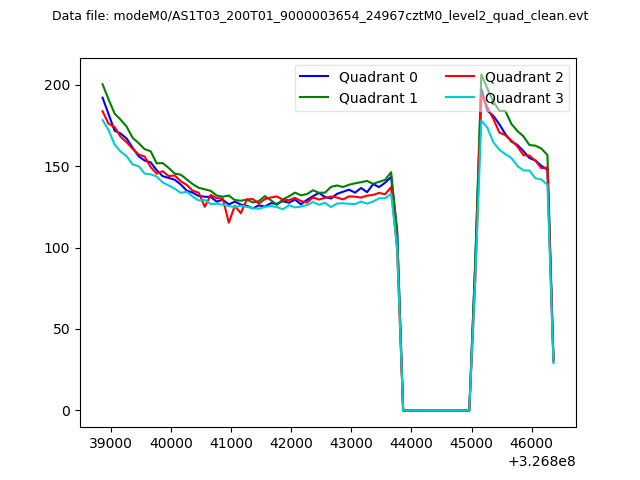 |
|
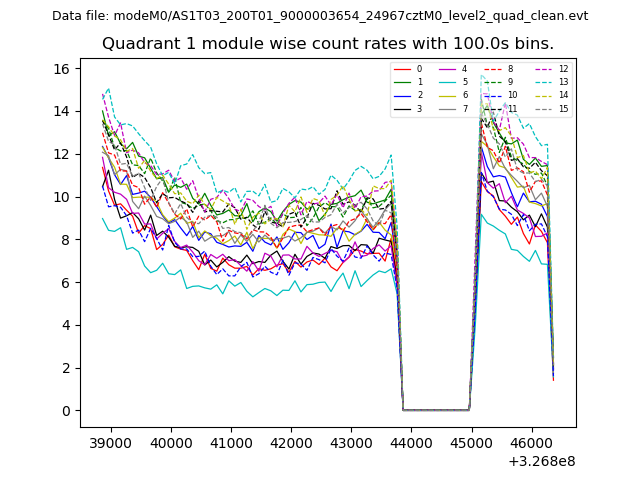
| Module-wise count rates for Quadrant A Data is divided into 100 sec bins |
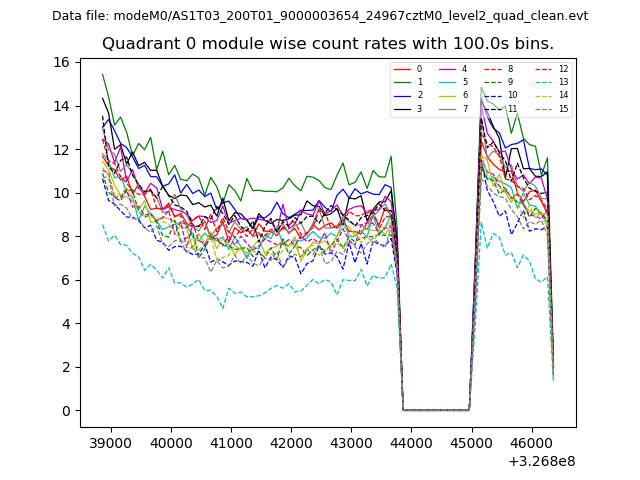 |
 |
| Module-wise count rates for Quadrant B Data is divided into 100 sec bins |
 |
 |
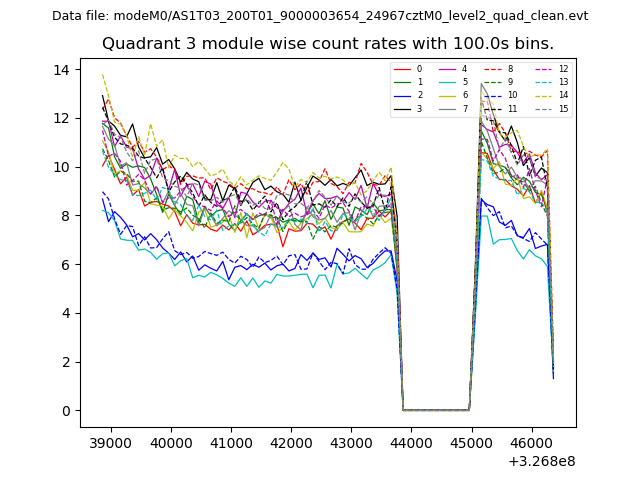
| Module-wise count rates for Quadrant C Data is divided into 100 sec bins |
 |
 |
| Module-wise count rates for Quadrant D Data is divided into 100 sec bins |
 |
 |
| Parameter | Plot |
|---|---|
| CZT HV Monitor | 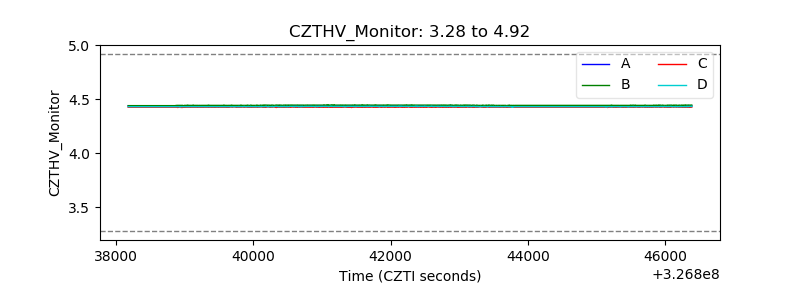 |
| D_VDD | 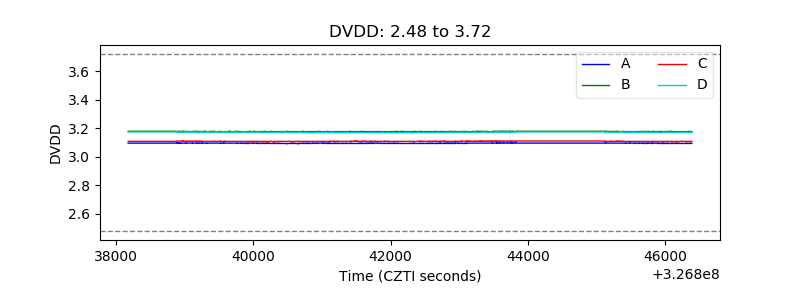 |
| Temperature 1 | 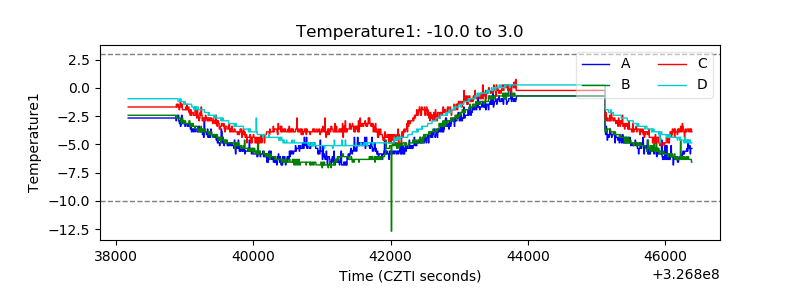 |
| Veto HV Monitor | 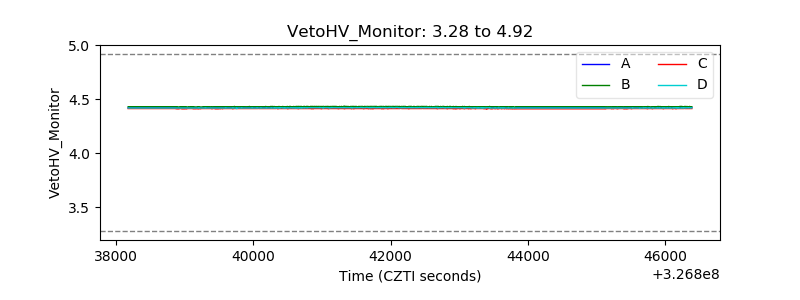 |
| Veto LLD | 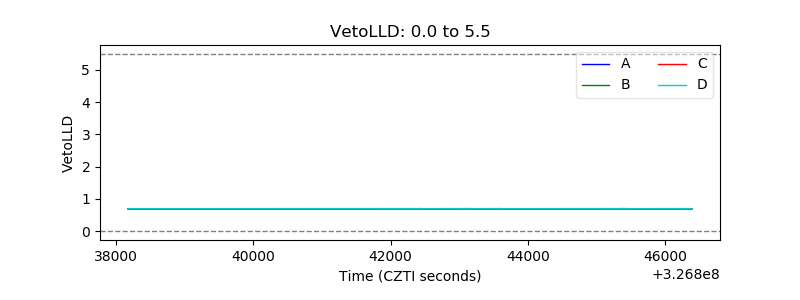 |
| Alpha Counter | 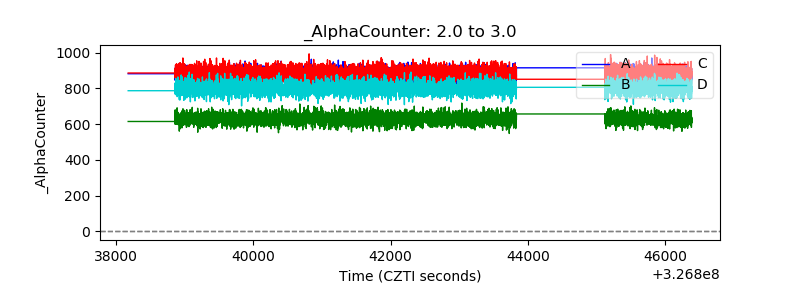 |
| _CPM_Rate | 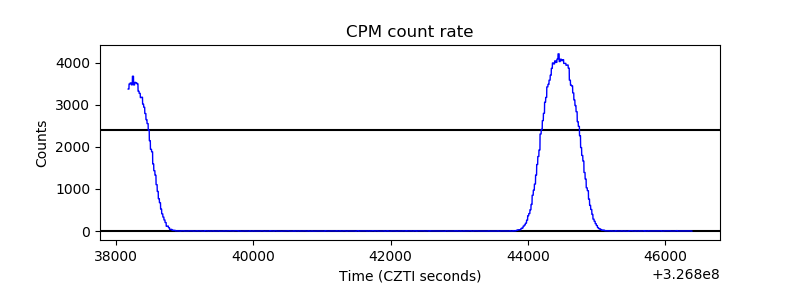 |
| CZT Counter | 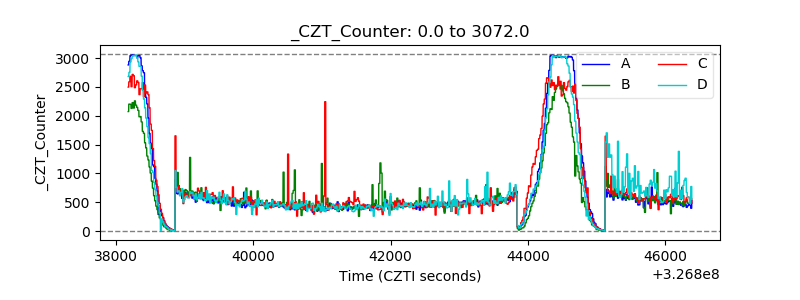 |
| +2.5 Volts monitor |  |
| +5 Volts monitor |  |
| _ROLL_ROT | 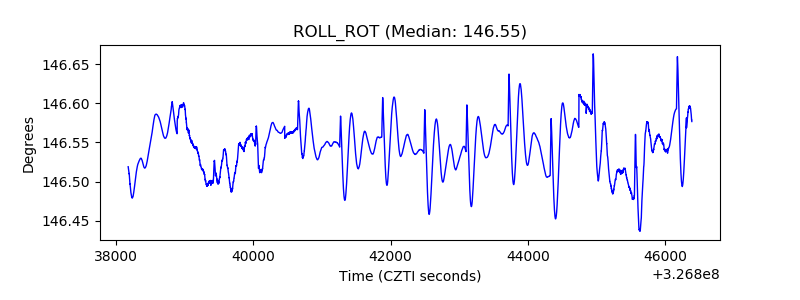 |
| _Roll_DEC | 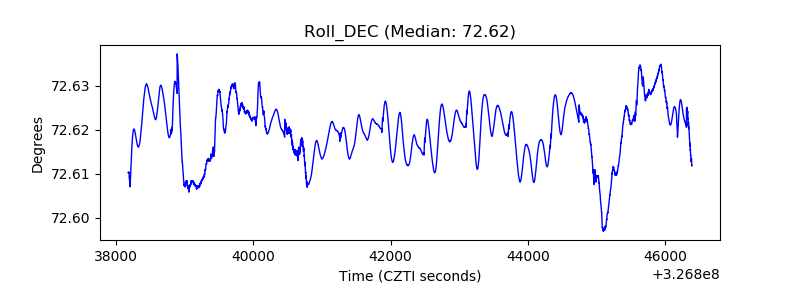 |
| _Roll_RA | 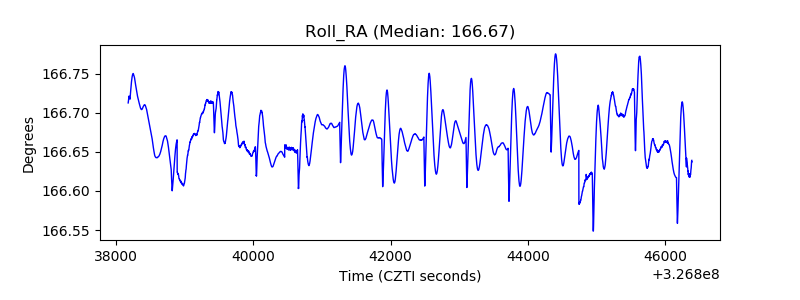 |
| Veto Counter | 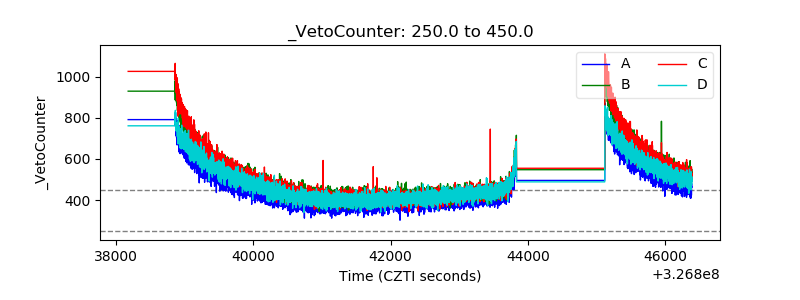 |