| Param | Original file | Final file |
|---|---|---|
| Filename | modeM0/AS1T03_200T01_9000003654_24968cztM0_level2.evt | modeM0/AS1T03_200T01_9000003654_24968cztM0_level2_quad_clean.evt |
| Size (bytes) | 458,112,960 | 132,868,800 |
| Size | 436.9 MB | 126.7 MB |
| Events in quadrant A | 2,990,155 | 909,350 |
| Events in quadrant B | 3,334,474 | 943,181 |
| Events in quadrant C | 3,212,002 | 896,139 |
| Events in quadrant D | 3,924,756 | 851,582 |
| Mode M9 | |||
|---|---|---|---|
| Quadrant | BADHDUFLAG | Total packets | Discarded packets |
| A | 0 | 25 | 0 |
| B | 0 | 26 | 0 |
| C | 0 | 26 | 0 |
| D | 0 | 26 | 0 |
| Mode SS | |||
|---|---|---|---|
| Quadrant | BADHDUFLAG | Total packets | Discarded packets |
| A | 0 | 122 | 0 |
| B | 0 | 122 | 0 |
| C | 0 | 122 | 0 |
| D | 0 | 122 | 0 |
| Mode M0 | |||
|---|---|---|---|
| Quadrant | BADHDUFLAG | Total packets | Discarded packets |
| A | 0 | 12770 | 2 |
| B | 0 | 13768 | 2 |
| C | 0 | 13371 | 2 |
| D | 0 | 15800 | 2 |
| Quadrant | Total seconds | Saturated seconds | Saturation percentage |
|---|---|---|---|
| A | 6082 | 23 | 0.378165% |
| B | 6082 | 81 | 1.331799% |
| C | 6082 | 112 | 1.841500% |
| D | 6082 | 114 | 1.874383% |
Noise dominated data is calculated using 1-second bins in cleaned event files. If a bin has >2000 counts, and if more than 50% of those come from <1% of pixels, then it is considered to be noise-dominated and hence unusable.
| Quadrant | # 1 sec bins | Bins with >0 counts | Bins with >2000 counts | High rate bins dominated by noise | Noise dominated (total time) | Noise dominated (detector-on time) | Marked lightcurve |
|---|---|---|---|---|---|---|---|
| A | 7452 | 6083 | 0 | 0 | 0.00% | 0.00% | 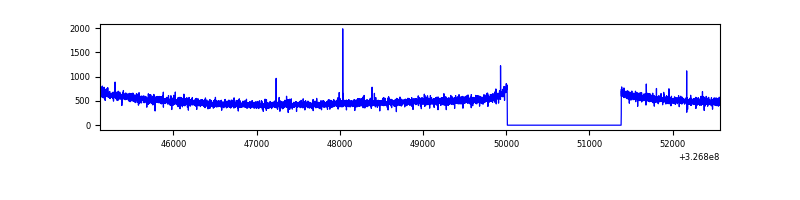 |
| B | 7452 | 6083 | 18 | 18 | 0.24% | 0.30% | 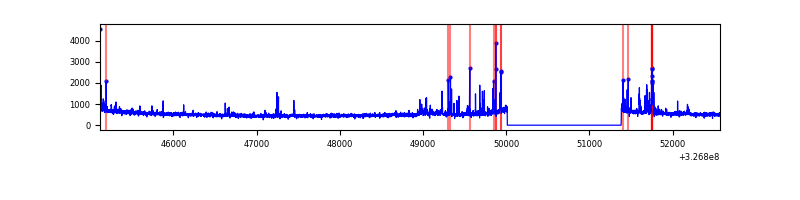 |
| C | 7452 | 6083 | 12 | 12 | 0.16% | 0.20% | 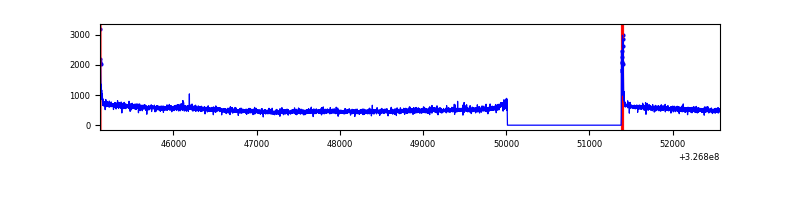 |
| D | 7452 | 6083 | 83 | 83 | 1.11% | 1.36% | 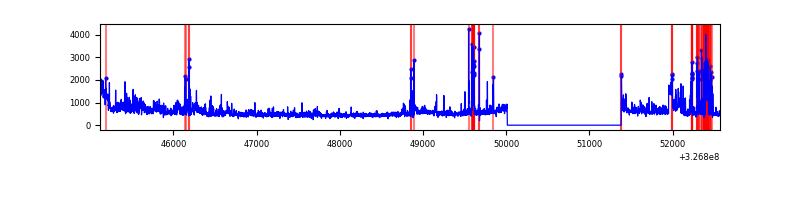 |
Top three noisy pixels from each quadrant. If the there are fewer than three noisy pixels in the level2.evt file, extra rows are filled as -1
| Pixel properties | Quadrant properties | ||||||
|---|---|---|---|---|---|---|---|
| Quadrant | DetID | PixID | Counts | Sigma | Mean | Median | Sigma |
| A | 13 | 254 | 8704 | 51.48 | 774 | 760 | 154.3 |
| A | 0 | 226 | 6687 | 38.41 | 774 | 760 | 154.3 |
| A | 3 | 137 | 6386 | 36.46 | 774 | 760 | 154.3 |
| B | 3 | 64 | 137001 | 955.7 | 783 | 765 | 142.6 |
| B | 5 | 172 | 59645 | 413.05 | 783 | 765 | 142.6 |
| B | 10 | 246 | 29634 | 202.52 | 783 | 765 | 142.6 |
| C | 14 | 238 | 124097 | 713.03 | 754 | 760 | 173.0 |
| C | 7 | 247 | 86936 | 498.19 | 754 | 760 | 173.0 |
| C | 0 | 10 | 57547 | 328.29 | 754 | 760 | 173.0 |
| D | 1 | 52 | 840871 | 4694.25 | 746 | 725 | 179.0 |
| D | 2 | 244 | 94751 | 525.36 | 746 | 725 | 179.0 |
| D | 8 | 195 | 76462 | 423.17 | 746 | 725 | 179.0 |
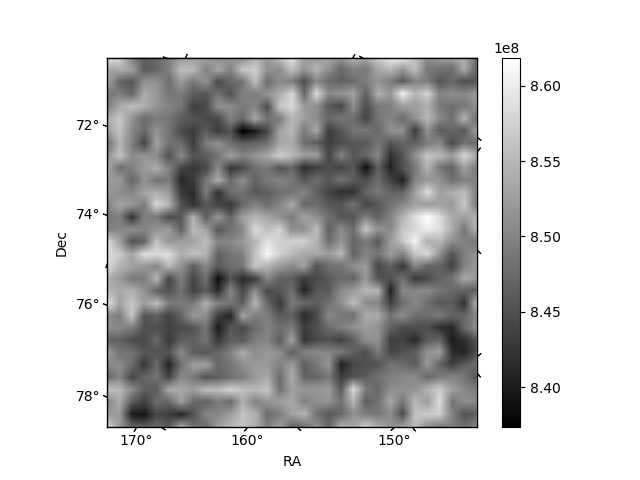
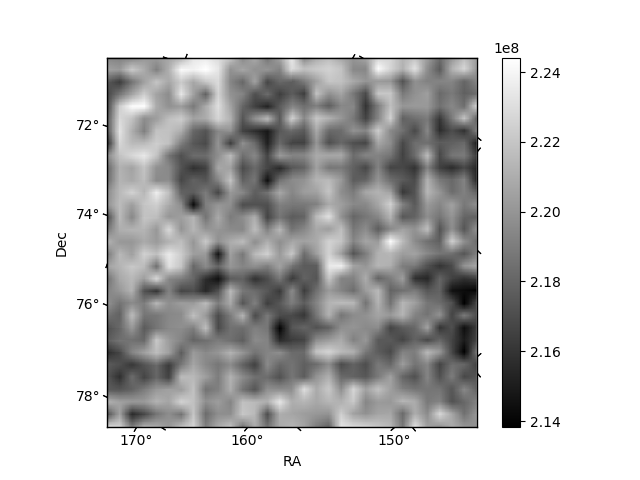
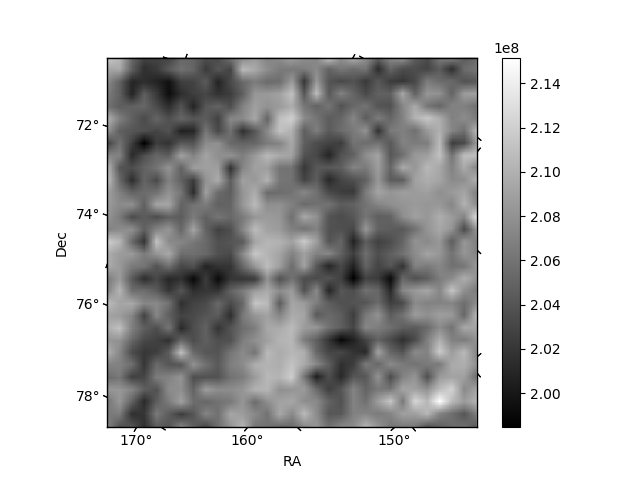
Histogram calculated using DETX and DETY for each event in the final _common_clean file
| Quadrant A | 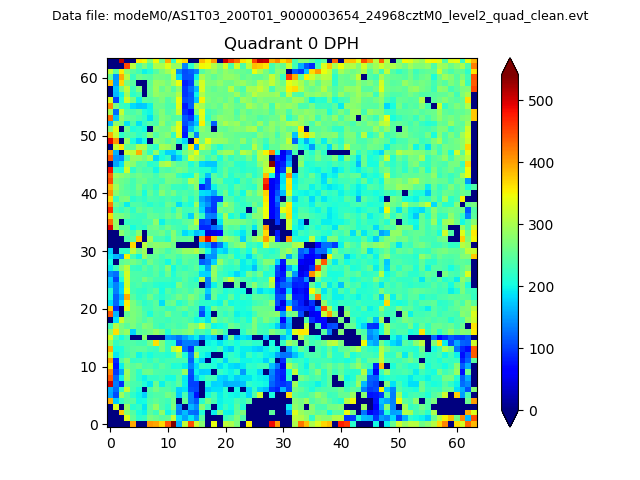 |
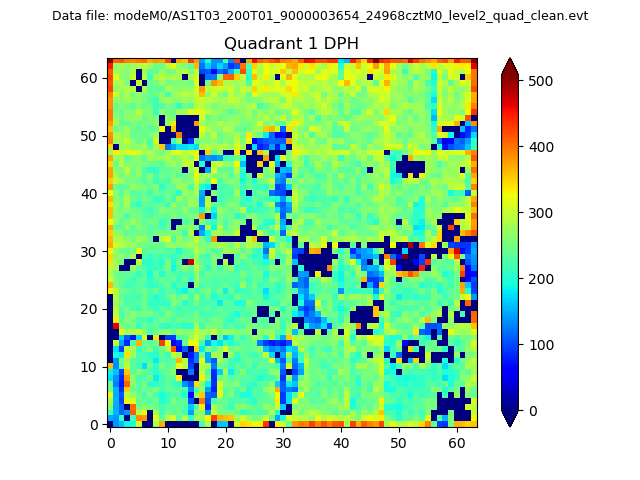 |
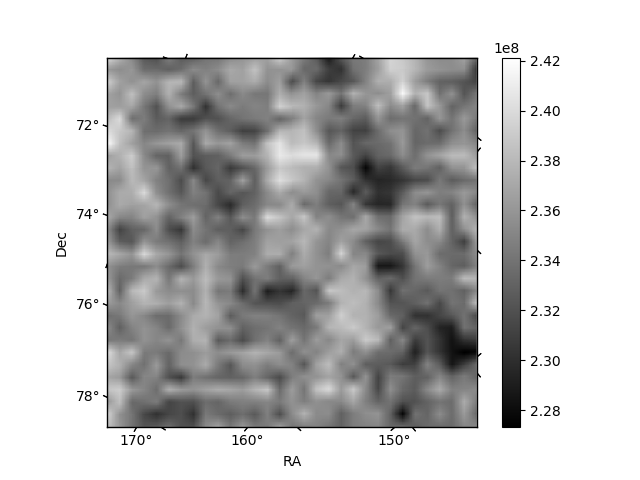
Quadrant B |
|---|---|---|---|
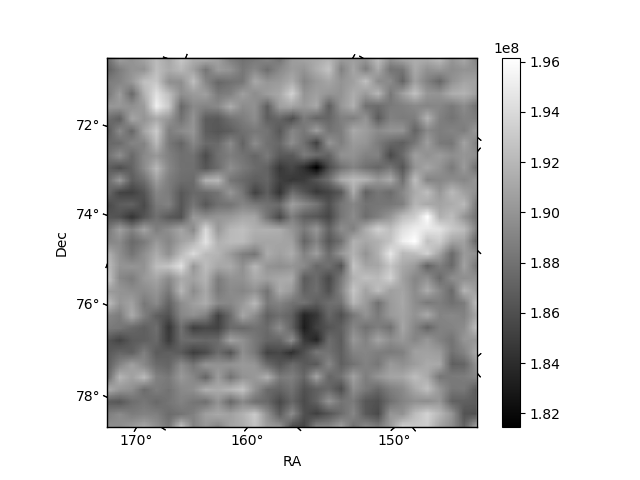
| Quadrant D | 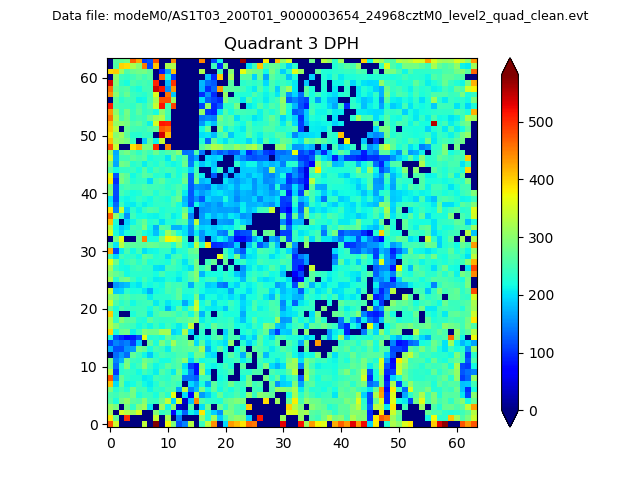 |
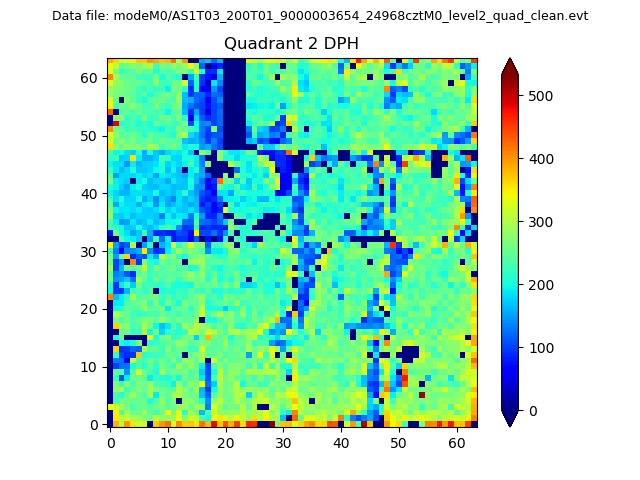 |
Quadrant C |
| Plot type | Count rate plots | Images |
|---|---|---|
| Comparison with Poisson distribution Blue bars denote a histogram of data divided into 1 sec bins. Red curve is a Poisson curve with rate = median count rate of data. |
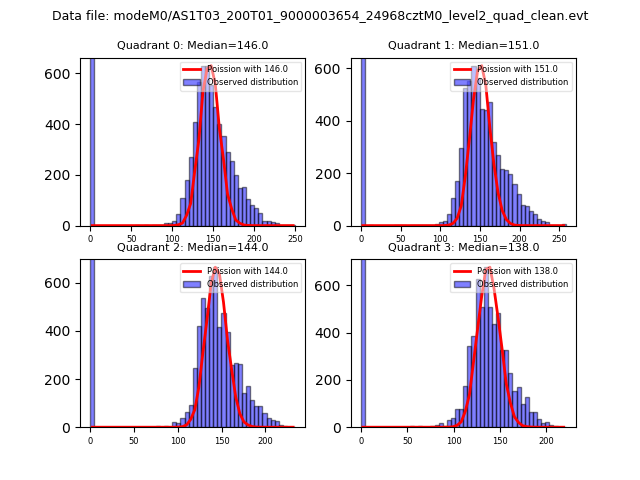 |
 |
| Quadrant-wise count rates Data is divided into 100 sec bins |
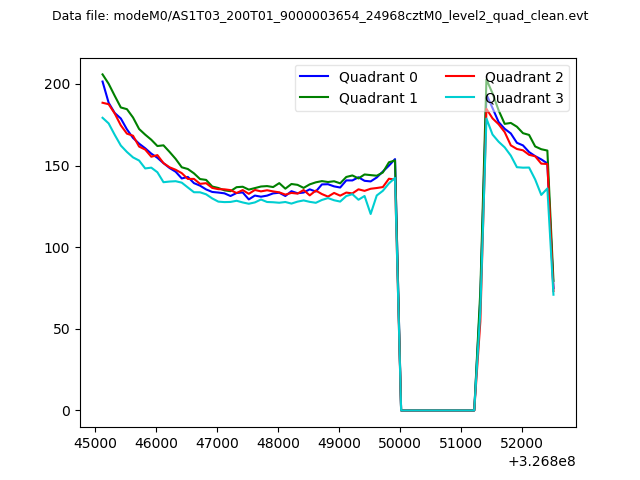 |
|
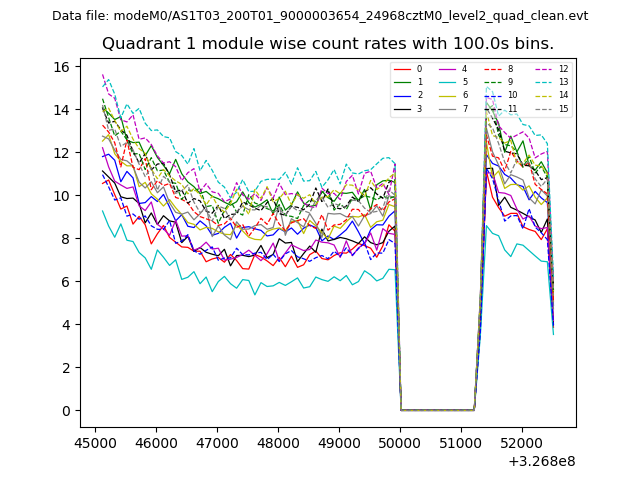
| Module-wise count rates for Quadrant A Data is divided into 100 sec bins |
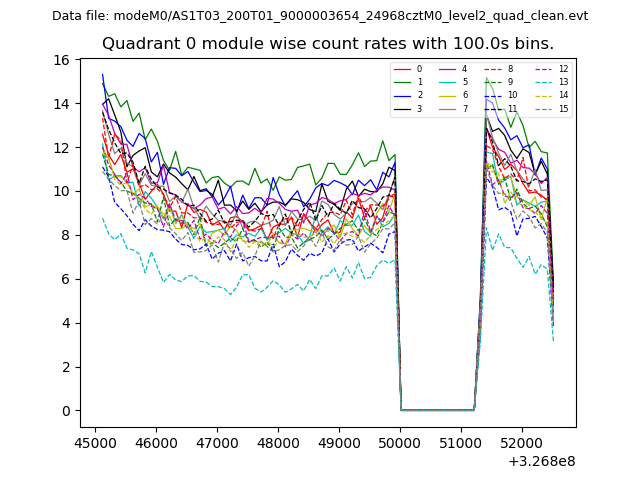 |
 |
| Module-wise count rates for Quadrant B Data is divided into 100 sec bins |
 |
 |
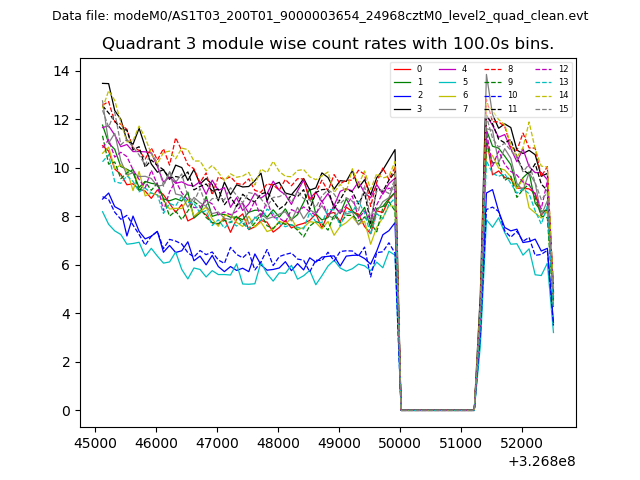
| Module-wise count rates for Quadrant C Data is divided into 100 sec bins |
 |
 |
| Module-wise count rates for Quadrant D Data is divided into 100 sec bins |
 |
 |
| Parameter | Plot |
|---|---|
| CZT HV Monitor |  |
| D_VDD | 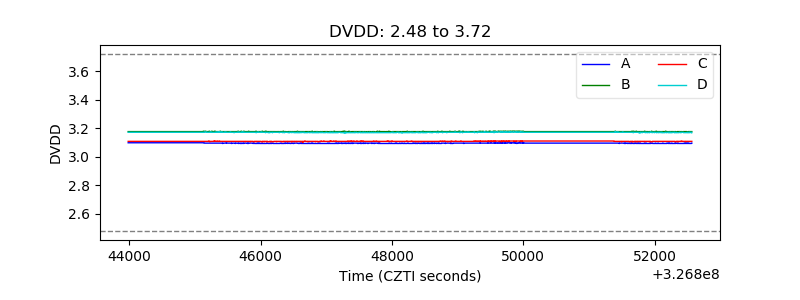 |
| Temperature 1 | 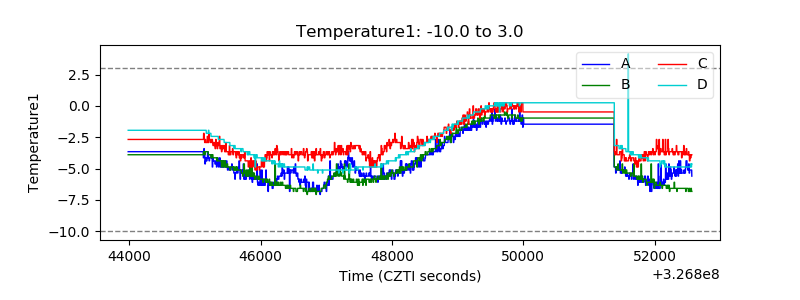 |
| Veto HV Monitor | 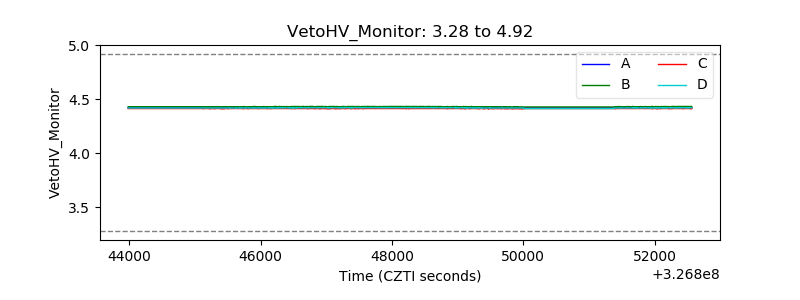 |
| Veto LLD | 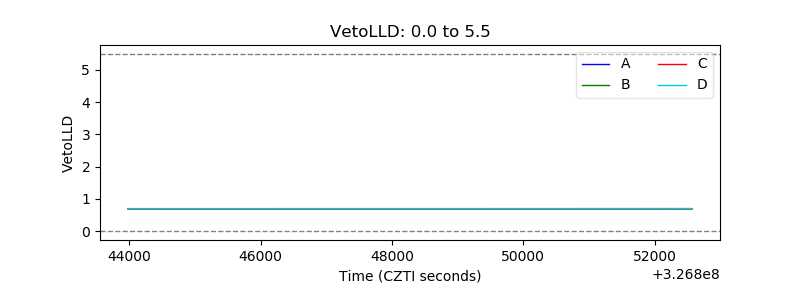 |
| Alpha Counter | 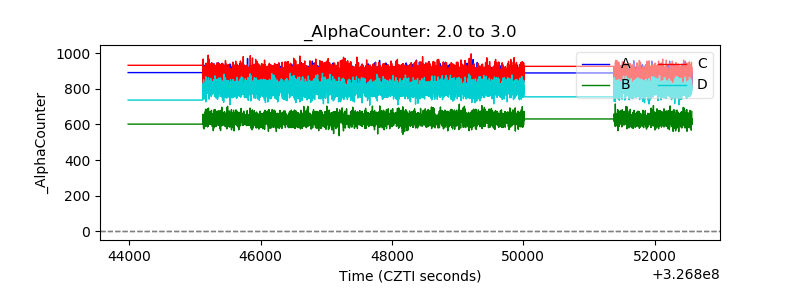 |
| _CPM_Rate | 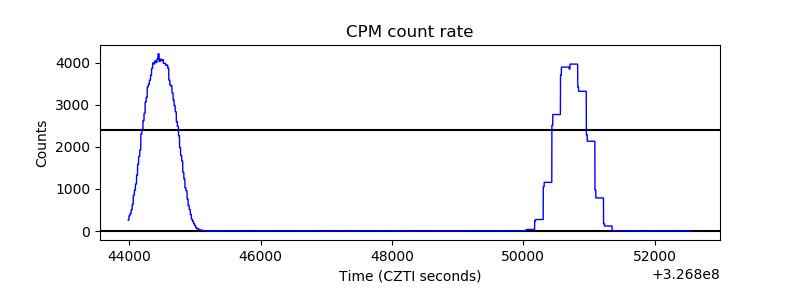 |
| CZT Counter | 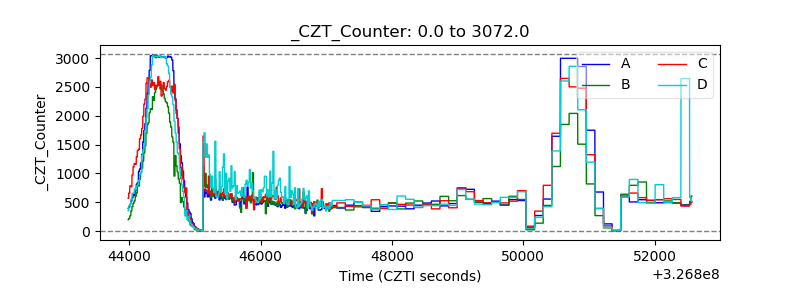 |
| +2.5 Volts monitor |  |
| +5 Volts monitor |  |
| _ROLL_ROT | 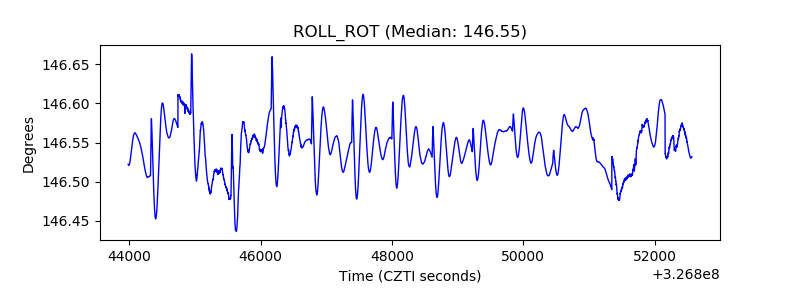 |
| _Roll_DEC | 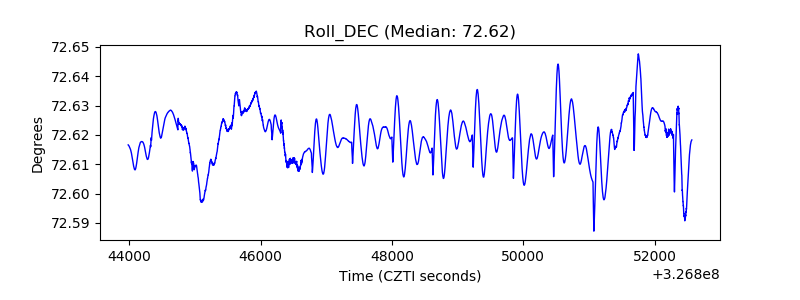 |
| _Roll_RA | 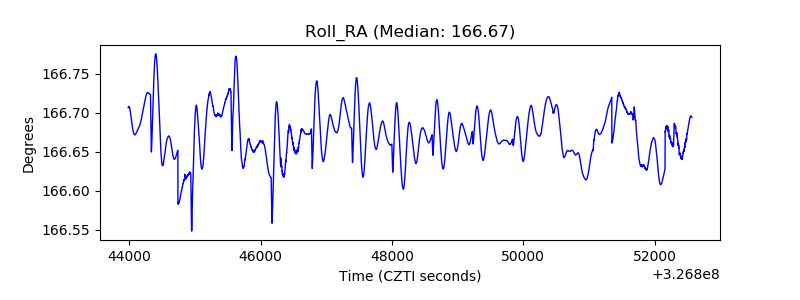 |
| Veto Counter | 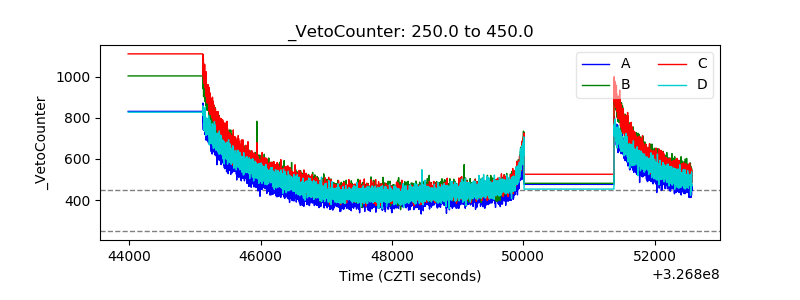 |