| Param | Original file | Final file |
|---|---|---|
| Filename | modeM0/AS1T03_200T01_9000003654_24969cztM0_level2.evt | modeM0/AS1T03_200T01_9000003654_24969cztM0_level2_quad_clean.evt |
| Size (bytes) | 569,099,520 | 137,350,080 |
| Size | 542.7 MB | 131.0 MB |
| Events in quadrant A | 3,182,064 | 962,627 |
| Events in quadrant B | 3,460,951 | 994,391 |
| Events in quadrant C | 4,290,599 | 903,007 |
| Events in quadrant D | 5,863,750 | 849,083 |
| Mode M9 | |||
|---|---|---|---|
| Quadrant | BADHDUFLAG | Total packets | Discarded packets |
| A | 0 | 22 | 0 |
| B | 0 | 23 | 0 |
| C | 0 | 23 | 0 |
| D | 0 | 23 | 0 |
| Mode SS | |||
|---|---|---|---|
| Quadrant | BADHDUFLAG | Total packets | Discarded packets |
| A | 0 | 130 | 0 |
| B | 0 | 130 | 0 |
| C | 0 | 130 | 0 |
| D | 0 | 130 | 0 |
| Mode M0 | |||
|---|---|---|---|
| Quadrant | BADHDUFLAG | Total packets | Discarded packets |
| A | 0 | 13490 | 2 |
| B | 0 | 14323 | 2 |
| C | 0 | 16741 | 2 |
| D | 0 | 21783 | 2 |
| Quadrant | Total seconds | Saturated seconds | Saturation percentage |
|---|---|---|---|
| A | 6463 | 39 | 0.603435% |
| B | 6463 | 89 | 1.377069% |
| C | 6463 | 501 | 7.751818% |
| D | 6463 | 800 | 12.378153% |
Noise dominated data is calculated using 1-second bins in cleaned event files. If a bin has >2000 counts, and if more than 50% of those come from <1% of pixels, then it is considered to be noise-dominated and hence unusable.
| Quadrant | # 1 sec bins | Bins with >0 counts | Bins with >2000 counts | High rate bins dominated by noise | Noise dominated (total time) | Noise dominated (detector-on time) | Marked lightcurve |
|---|---|---|---|---|---|---|---|
| A | 7828 | 6464 | 0 | 0 | 0.00% | 0.00% | 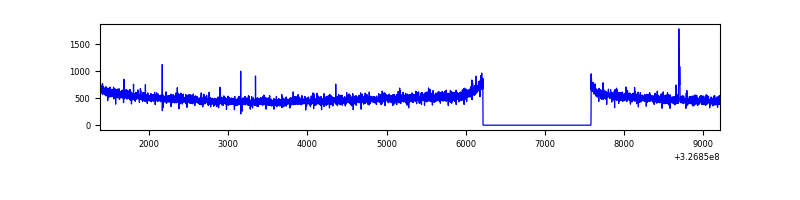 |
| B | 7828 | 6464 | 19 | 19 | 0.24% | 0.29% | 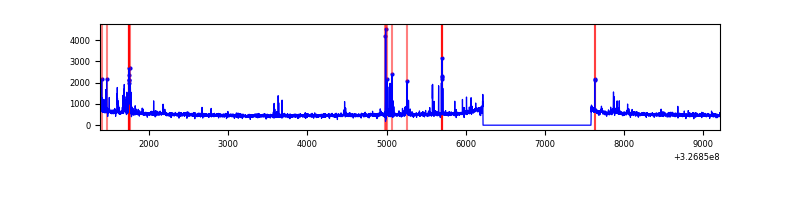 |
| C | 7828 | 6464 | 352 | 352 | 4.50% | 5.45% | 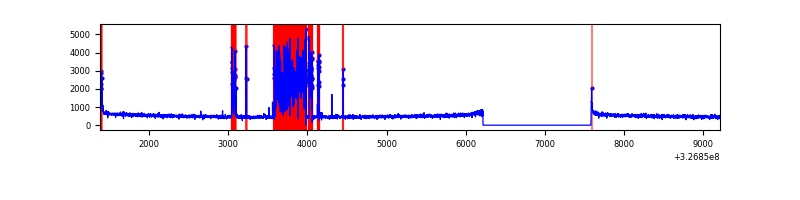 |
| D | 7828 | 6464 | 600 | 600 | 7.66% | 9.28% | 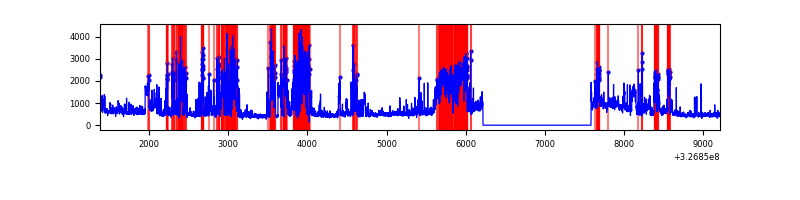 |
Top three noisy pixels from each quadrant. If the there are fewer than three noisy pixels in the level2.evt file, extra rows are filled as -1
| Pixel properties | Quadrant properties | ||||||
|---|---|---|---|---|---|---|---|
| Quadrant | DetID | PixID | Counts | Sigma | Mean | Median | Sigma |
| A | 4 | 2 | 15778 | 92.21 | 819 | 804 | 162.4 |
| A | 13 | 254 | 9964 | 56.41 | 819 | 804 | 162.4 |
| A | 0 | 226 | 6984 | 38.06 | 819 | 804 | 162.4 |
| B | 3 | 64 | 127648 | 839.31 | 826 | 809 | 151.1 |
| B | 5 | 172 | 43936 | 285.38 | 826 | 809 | 151.1 |
| B | 12 | 111 | 17408 | 109.84 | 826 | 809 | 151.1 |
| C | 7 | 247 | 1138612 | 6520.79 | 763 | 770 | 174.5 |
| C | 14 | 238 | 126316 | 719.48 | 763 | 770 | 174.5 |
| C | 0 | 10 | 45036 | 253.68 | 763 | 770 | 174.5 |
| D | 10 | 70 | 1103949 | 6179.13 | 748 | 727 | 178.5 |
| D | 1 | 52 | 951724 | 5326.52 | 748 | 727 | 178.5 |
| D | 7 | 238 | 698911 | 3910.52 | 748 | 727 | 178.5 |
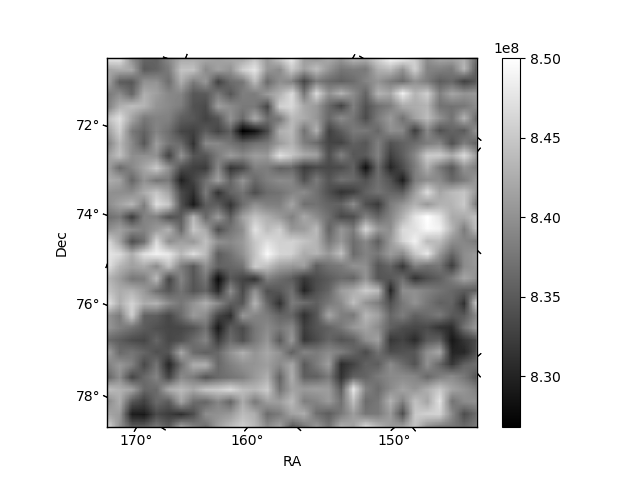
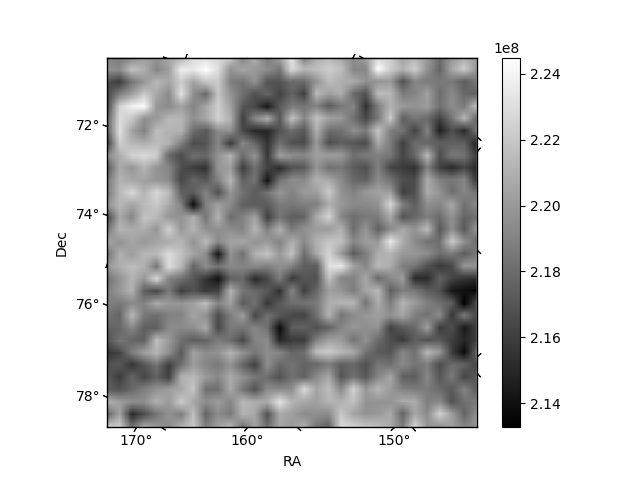
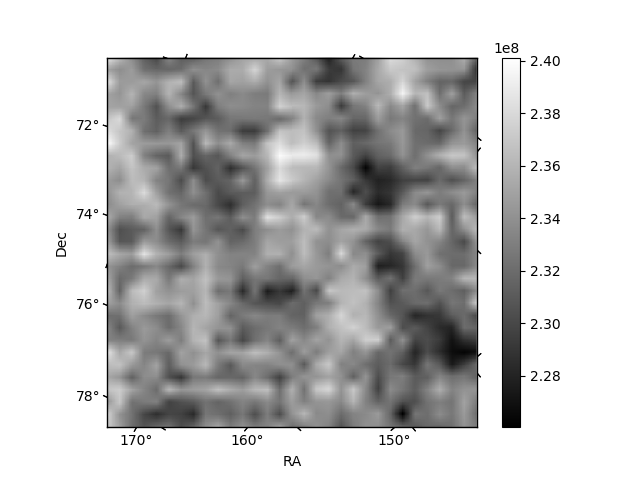
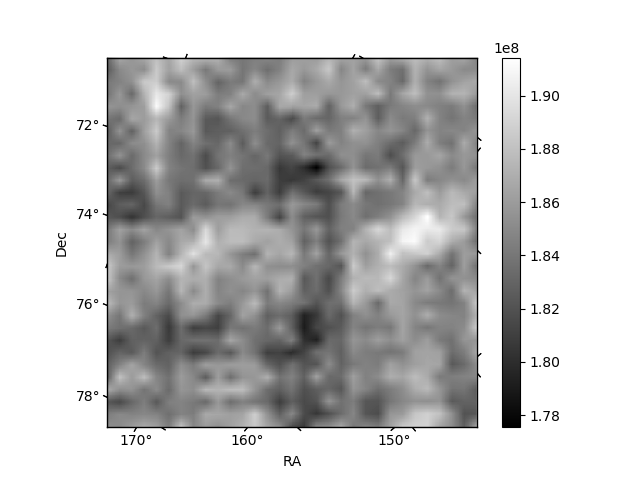
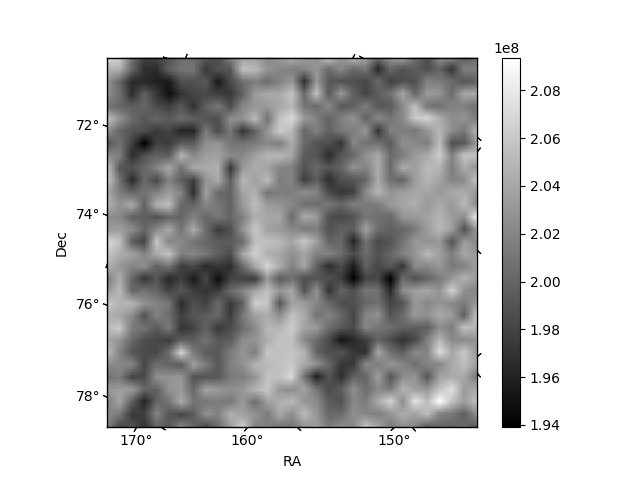
Histogram calculated using DETX and DETY for each event in the final _common_clean file
| Quadrant A | 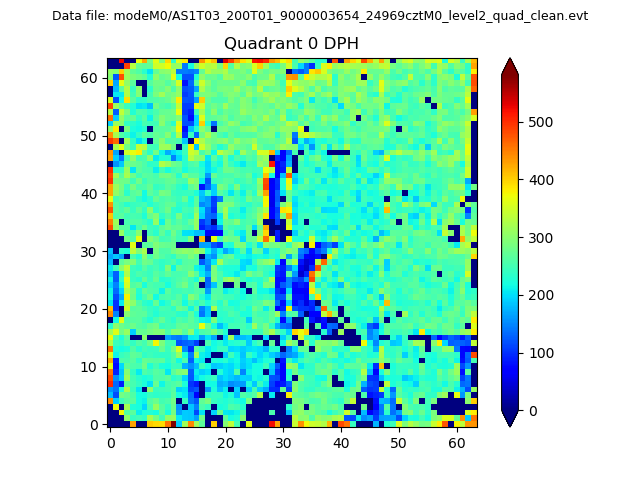 |
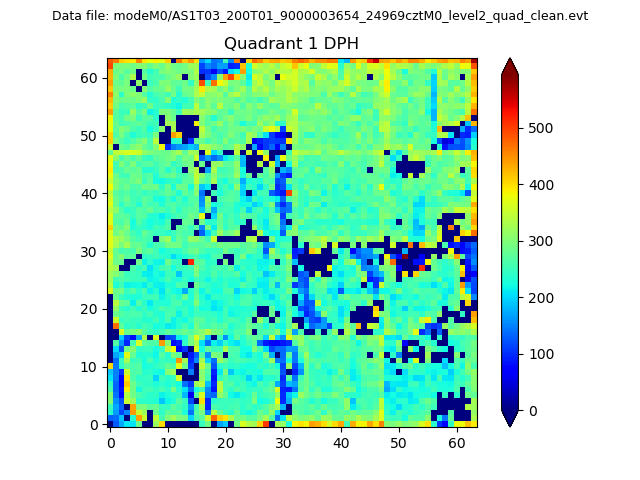 |
Quadrant B |
|---|---|---|---|
| Quadrant D | 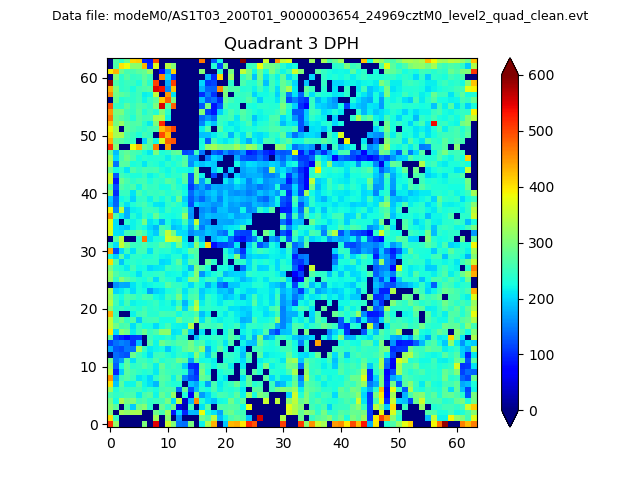 |
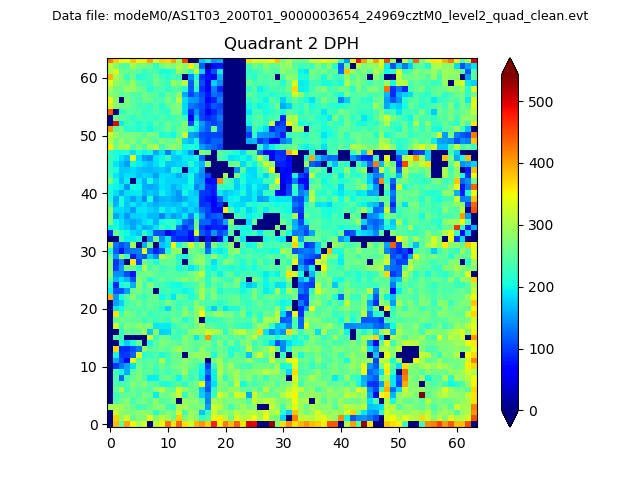 |
Quadrant C |
| Plot type | Count rate plots | Images |
|---|---|---|
| Comparison with Poisson distribution Blue bars denote a histogram of data divided into 1 sec bins. Red curve is a Poisson curve with rate = median count rate of data. |
 |
 |
| Quadrant-wise count rates Data is divided into 100 sec bins |
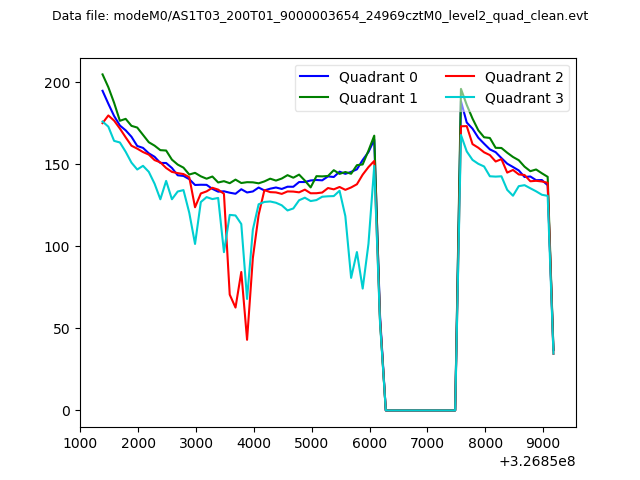 |
|
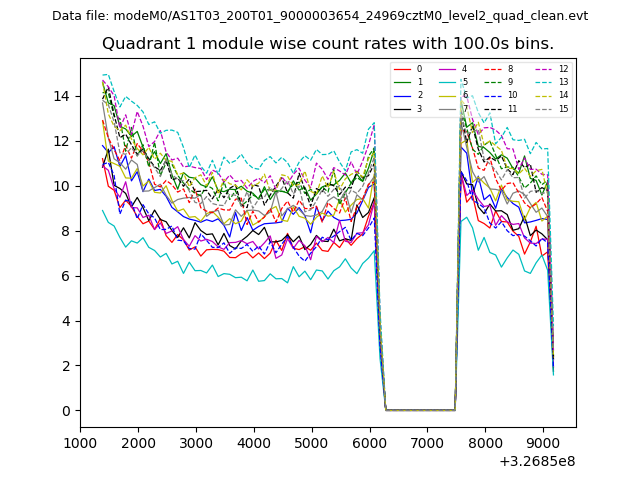
| Module-wise count rates for Quadrant A Data is divided into 100 sec bins |
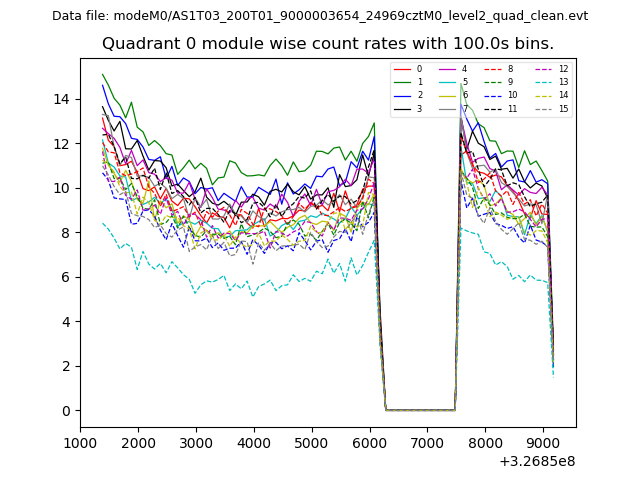 |
 |
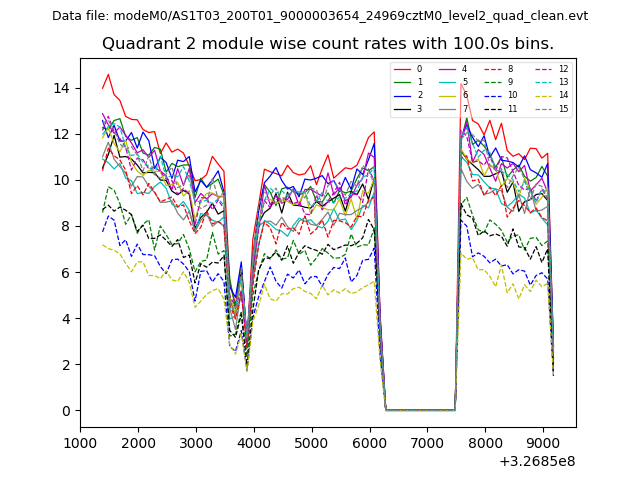
| Module-wise count rates for Quadrant B Data is divided into 100 sec bins |
 |
 |
| Module-wise count rates for Quadrant C Data is divided into 100 sec bins |
 |
 |
| Module-wise count rates for Quadrant D Data is divided into 100 sec bins |
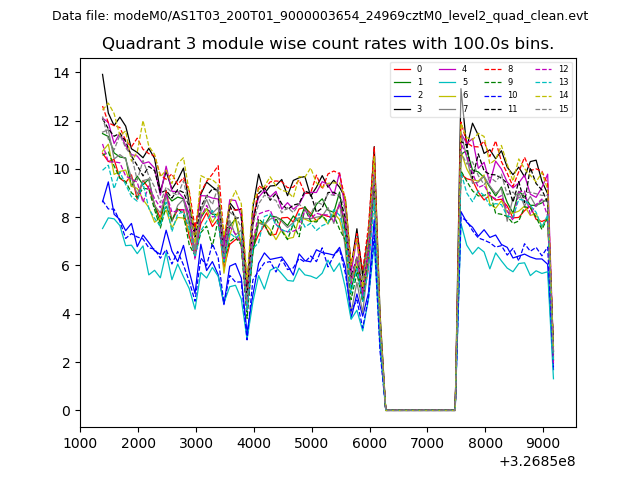 |
 |
| Parameter | Plot |
|---|---|
| CZT HV Monitor | 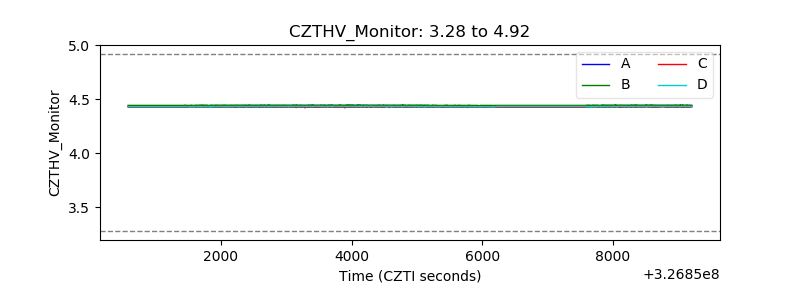 |
| D_VDD | 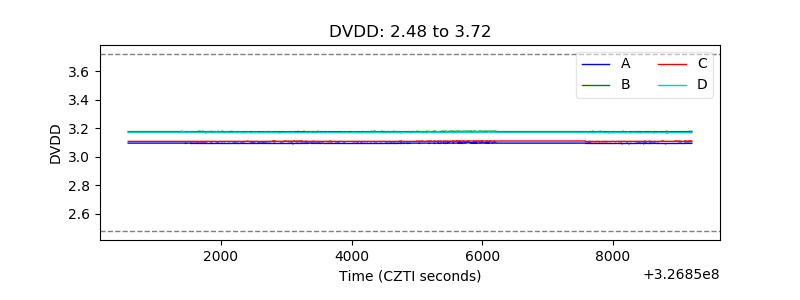 |
| Temperature 1 | 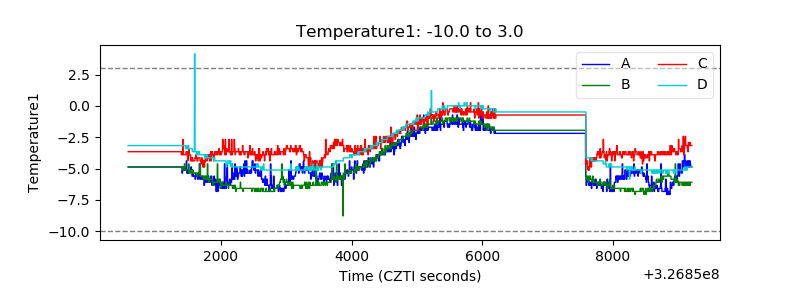 |
| Veto HV Monitor | 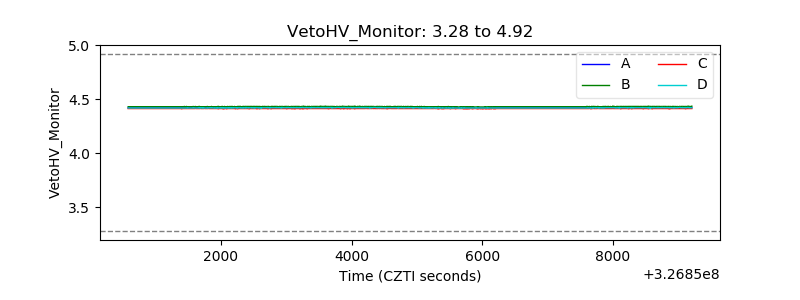 |
| Veto LLD | 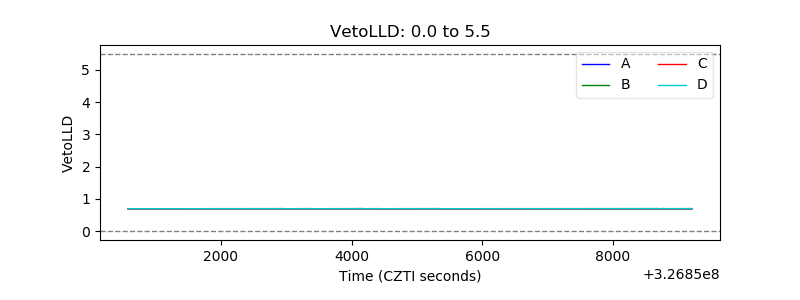 |
| Alpha Counter |  |
| _CPM_Rate | 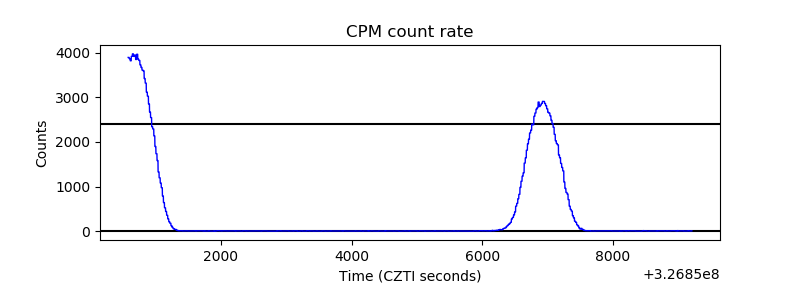 |
| CZT Counter | 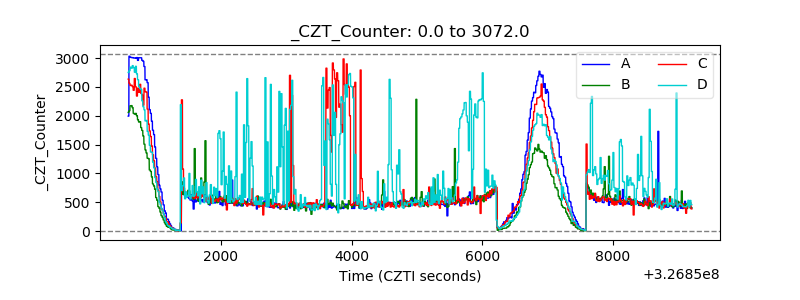 |
| +2.5 Volts monitor | 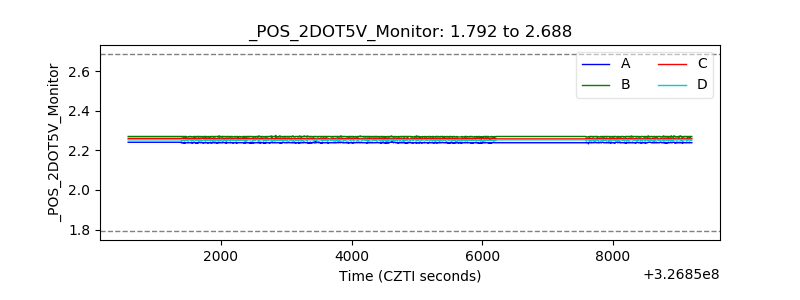 |
| +5 Volts monitor |  |
| _ROLL_ROT | 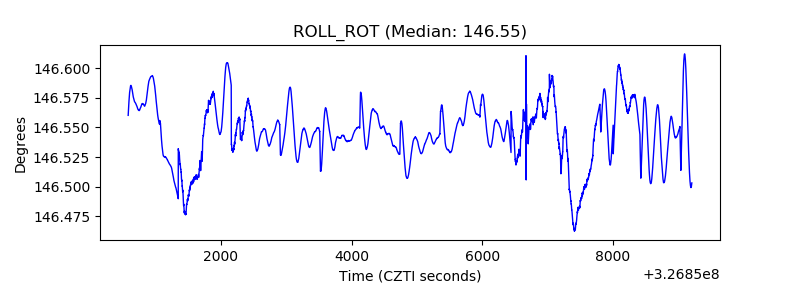 |
| _Roll_DEC | 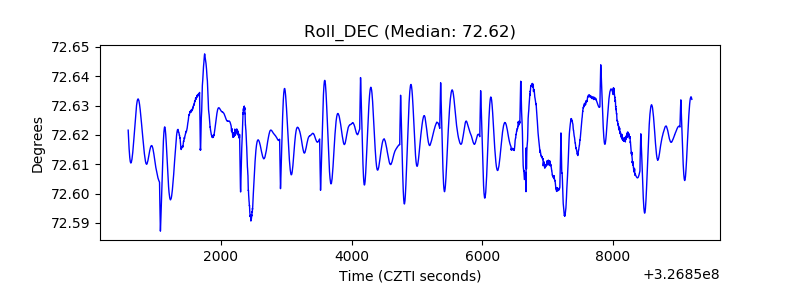 |
| _Roll_RA | 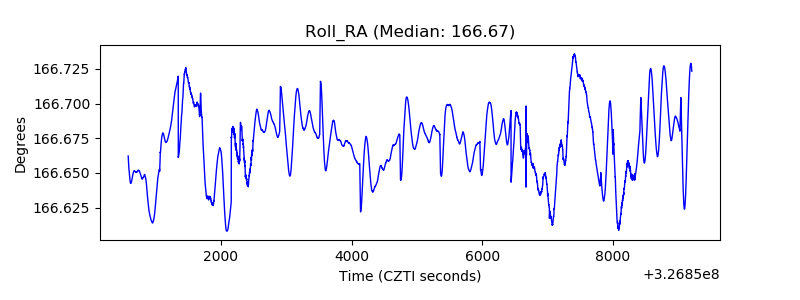 |
| Veto Counter | 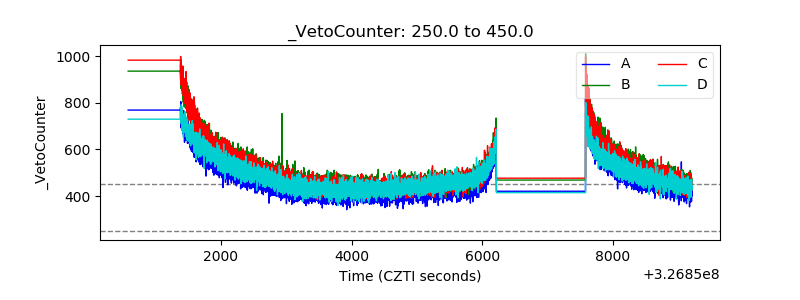 |