| Param | Original file | Final file |
|---|---|---|
| Filename | modeM0/AS1T03_200T01_9000003654_24970cztM0_level2.evt | modeM0/AS1T03_200T01_9000003654_24970cztM0_level2_quad_clean.evt |
| Size (bytes) | 469,497,600 | 119,111,040 |
| Size | 447.7 MB | 113.6 MB |
| Events in quadrant A | 2,804,458 | 825,140 |
| Events in quadrant B | 3,229,435 | 834,222 |
| Events in quadrant C | 2,825,470 | 799,214 |
| Events in quadrant D | 4,961,939 | 739,956 |
| Mode M9 | |||
|---|---|---|---|
| Quadrant | BADHDUFLAG | Total packets | Discarded packets |
| A | 0 | 13 | 0 |
| B | 0 | 13 | 0 |
| C | 0 | 13 | 0 |
| D | 0 | 13 | 0 |
| Mode SS | |||
|---|---|---|---|
| Quadrant | BADHDUFLAG | Total packets | Discarded packets |
| A | 0 | 120 | 0 |
| B | 0 | 120 | 0 |
| C | 0 | 120 | 0 |
| D | 0 | 120 | 0 |
| Mode M0 | |||
|---|---|---|---|
| Quadrant | BADHDUFLAG | Total packets | Discarded packets |
| A | 0 | 12027 | 1 |
| B | 0 | 13227 | 1 |
| C | 0 | 12139 | 1 |
| D | 0 | 18899 | 1 |
| Quadrant | Total seconds | Saturated seconds | Saturation percentage |
|---|---|---|---|
| A | 5847 | 22 | 0.376261% |
| B | 5848 | 165 | 2.821477% |
| C | 5848 | 80 | 1.367989% |
| D | 5848 | 561 | 9.593023% |
Noise dominated data is calculated using 1-second bins in cleaned event files. If a bin has >2000 counts, and if more than 50% of those come from <1% of pixels, then it is considered to be noise-dominated and hence unusable.
| Quadrant | # 1 sec bins | Bins with >0 counts | Bins with >2000 counts | High rate bins dominated by noise | Noise dominated (total time) | Noise dominated (detector-on time) | Marked lightcurve |
|---|---|---|---|---|---|---|---|
| A | 7197 | 5848 | 1 | 1 | 0.01% | 0.02% | 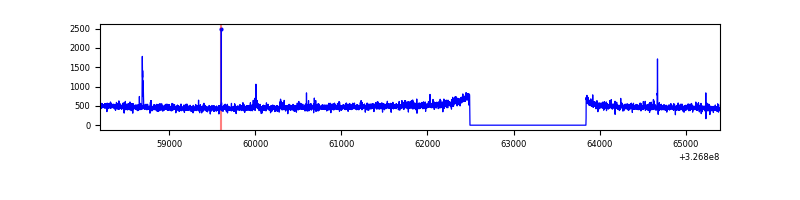 |
| B | 7198 | 5849 | 65 | 65 | 0.90% | 1.11% | 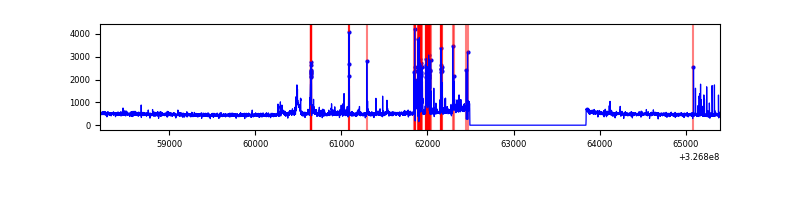 |
| C | 7198 | 5849 | 3 | 3 | 0.04% | 0.05% | 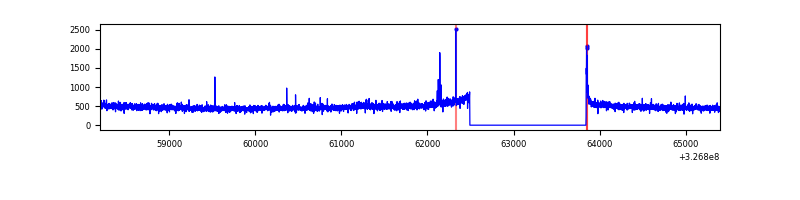 |
| D | 7198 | 5849 | 521 | 521 | 7.24% | 8.91% | 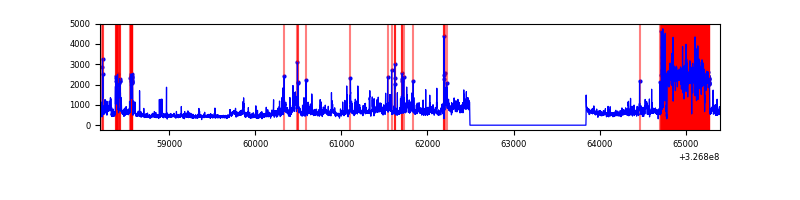 |
Top three noisy pixels from each quadrant. If the there are fewer than three noisy pixels in the level2.evt file, extra rows are filled as -1
| Pixel properties | Quadrant properties | ||||||
|---|---|---|---|---|---|---|---|
| Quadrant | DetID | PixID | Counts | Sigma | Mean | Median | Sigma |
| A | 4 | 2 | 31237 | 212.58 | 717 | 705 | 143.6 |
| A | 13 | 254 | 8609 | 55.03 | 717 | 705 | 143.6 |
| A | 0 | 226 | 6174 | 38.08 | 717 | 705 | 143.6 |
| B | 3 | 64 | 343280 | 2604.0 | 709 | 693 | 131.6 |
| B | 5 | 172 | 28826 | 213.84 | 709 | 693 | 131.6 |
| B | 4 | 80 | 25908 | 191.66 | 709 | 693 | 131.6 |
| C | 14 | 238 | 112831 | 715.59 | 682 | 685 | 156.7 |
| C | 7 | 247 | 21918 | 135.48 | 682 | 685 | 156.7 |
| C | 0 | 10 | 17613 | 108.01 | 682 | 685 | 156.7 |
| D | 7 | 238 | 1129240 | 7033.04 | 666 | 646 | 160.5 |
| D | 1 | 52 | 957500 | 5962.81 | 666 | 646 | 160.5 |
| D | 2 | 244 | 134656 | 835.11 | 666 | 646 | 160.5 |
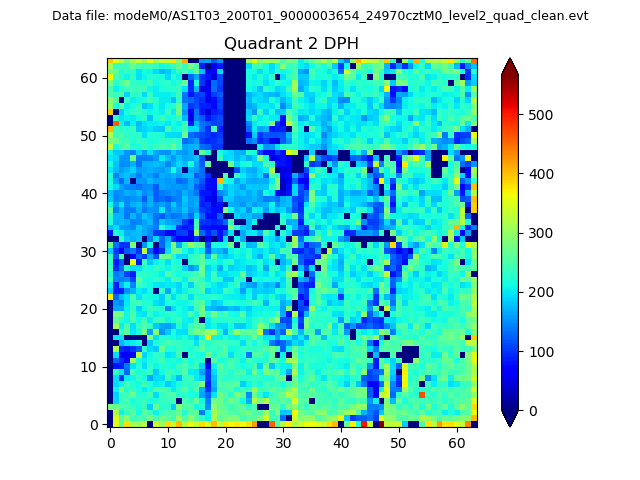
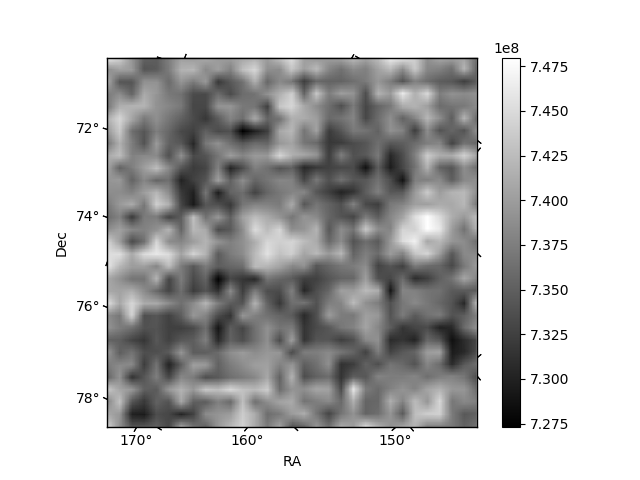
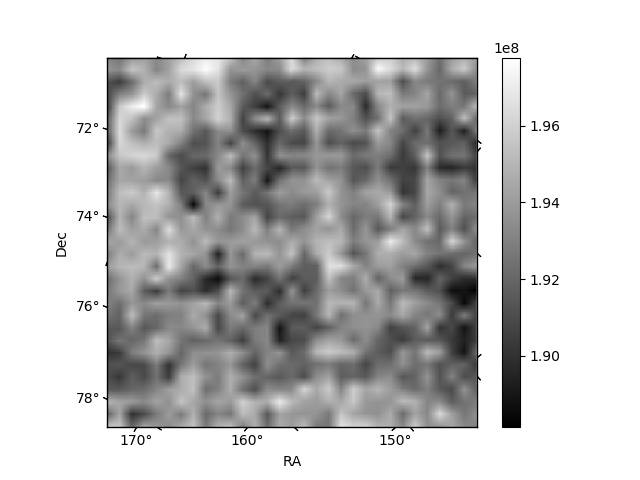
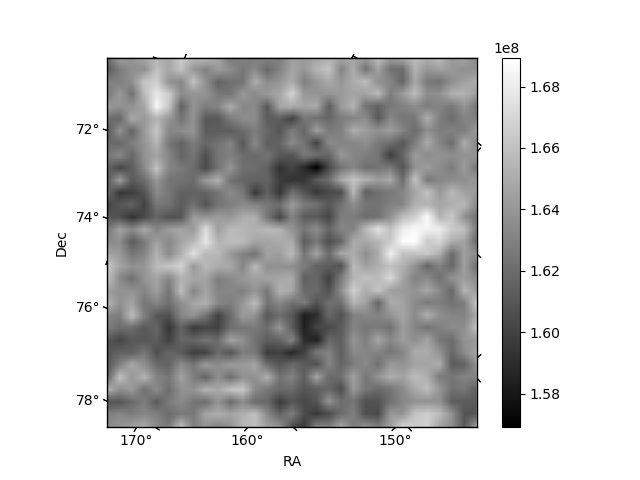
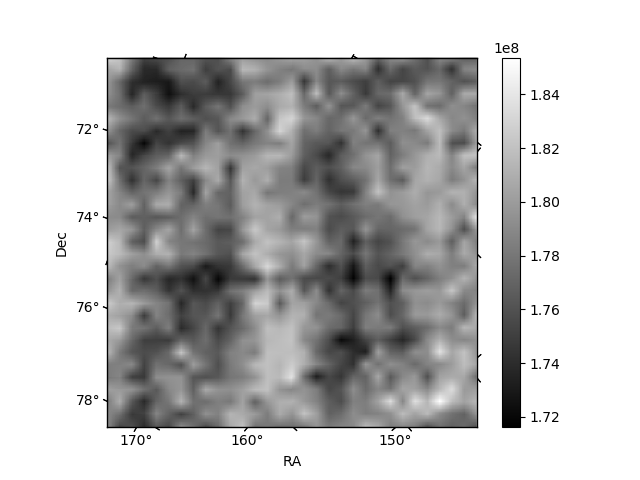
Histogram calculated using DETX and DETY for each event in the final _common_clean file
| Quadrant A | 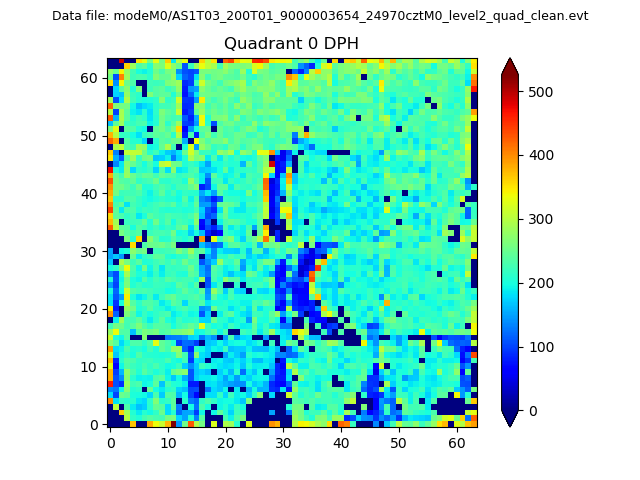 |
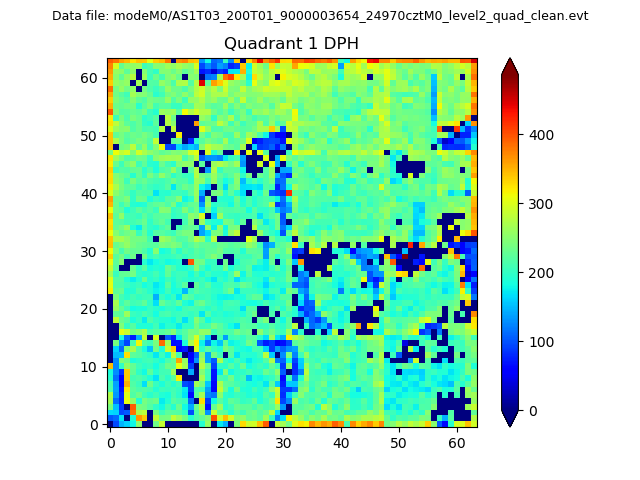 |
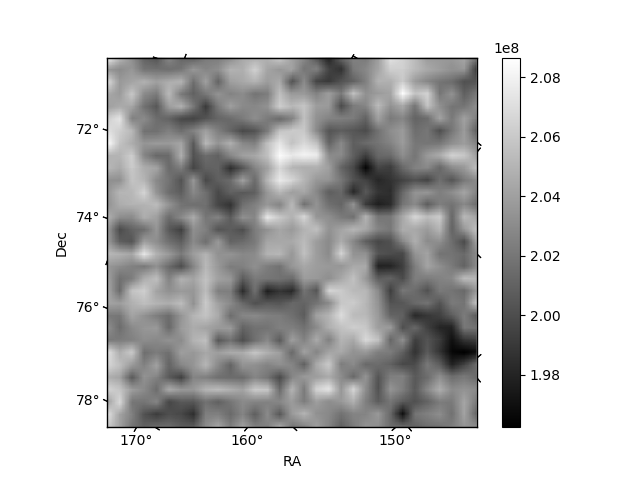
Quadrant B |
|---|---|---|---|
| Quadrant D | 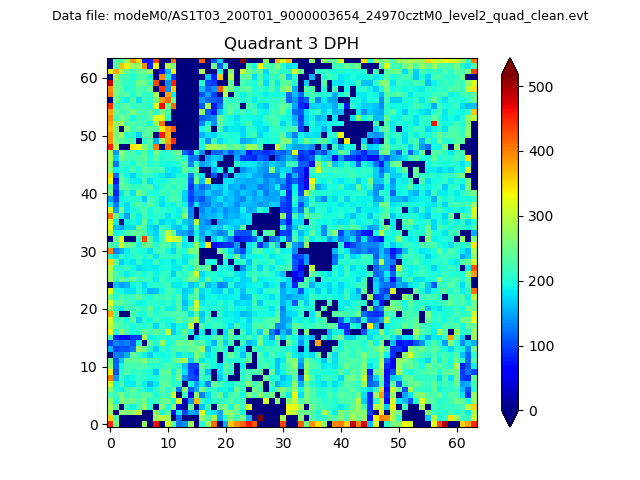 |
 |
Quadrant C |
| Plot type | Count rate plots | Images |
|---|---|---|
| Comparison with Poisson distribution Blue bars denote a histogram of data divided into 1 sec bins. Red curve is a Poisson curve with rate = median count rate of data. |
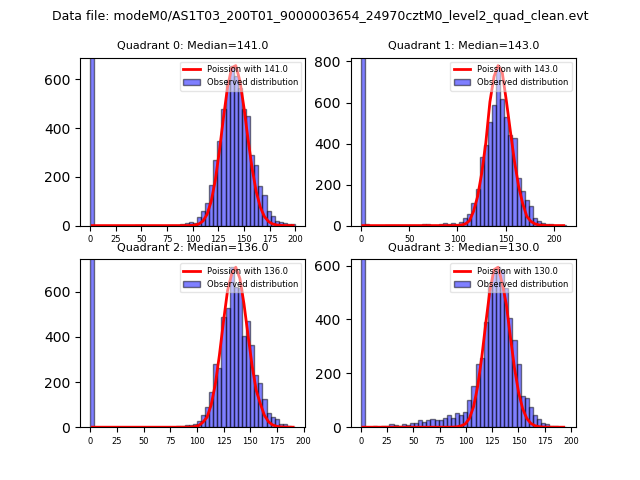 |
 |
| Quadrant-wise count rates Data is divided into 100 sec bins |
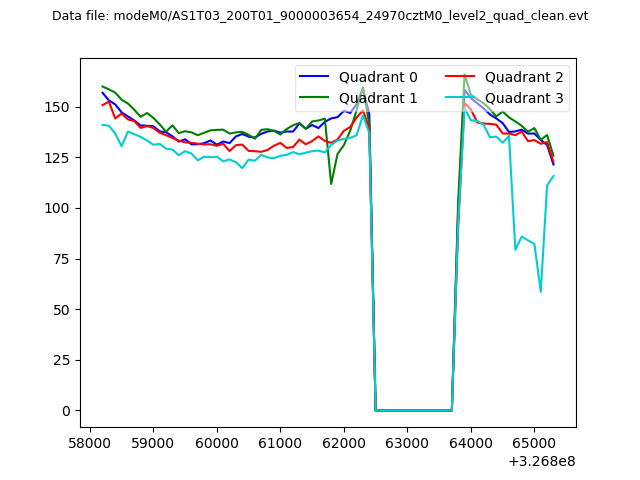 |
|
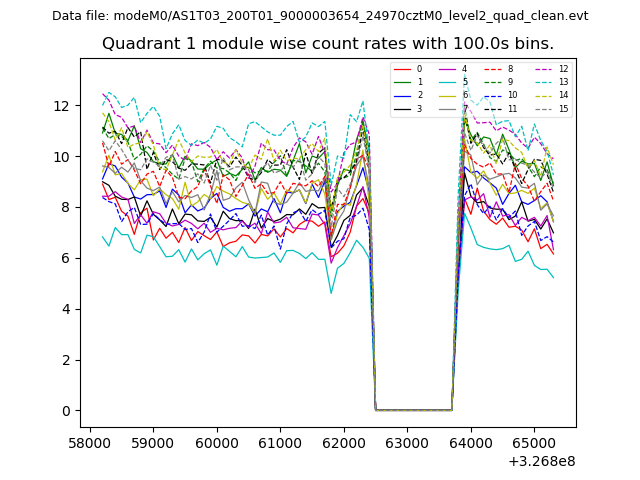
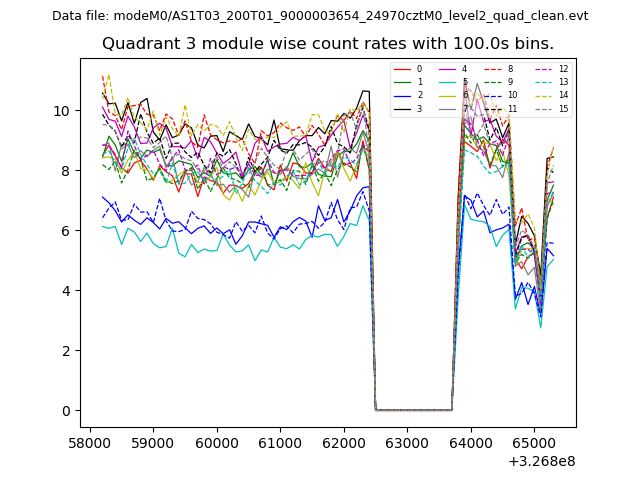
| Module-wise count rates for Quadrant A Data is divided into 100 sec bins |
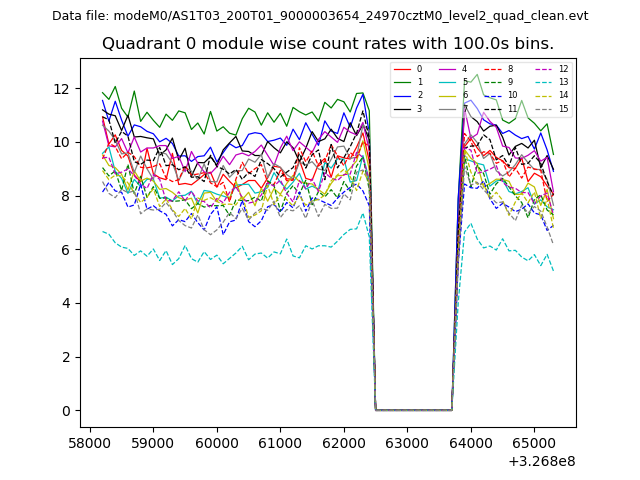 |
 |
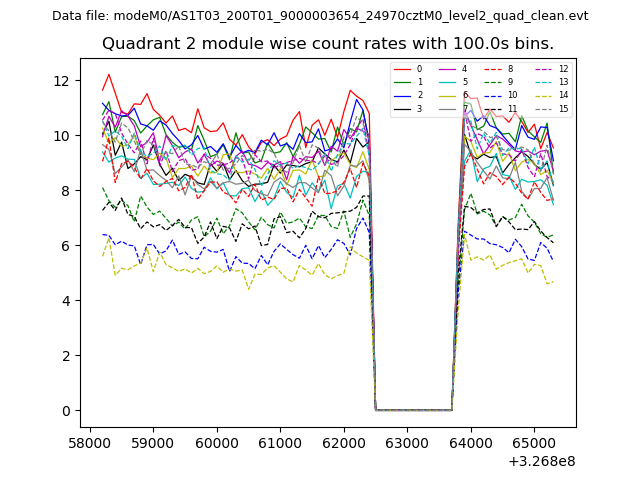
| Module-wise count rates for Quadrant B Data is divided into 100 sec bins |
 |
 |
| Module-wise count rates for Quadrant C Data is divided into 100 sec bins |
 |
 |
| Module-wise count rates for Quadrant D Data is divided into 100 sec bins |
 |
 |
| Parameter | Plot |
|---|---|
| CZT HV Monitor | 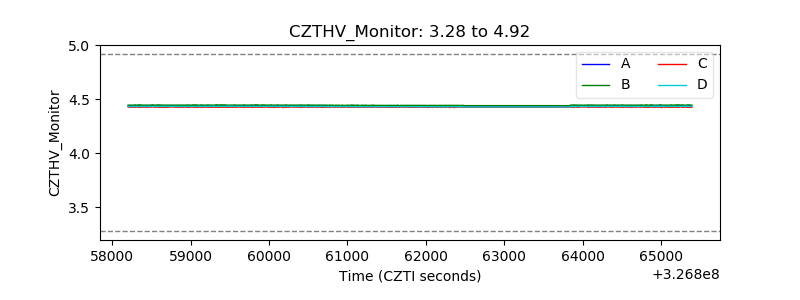 |
| D_VDD | 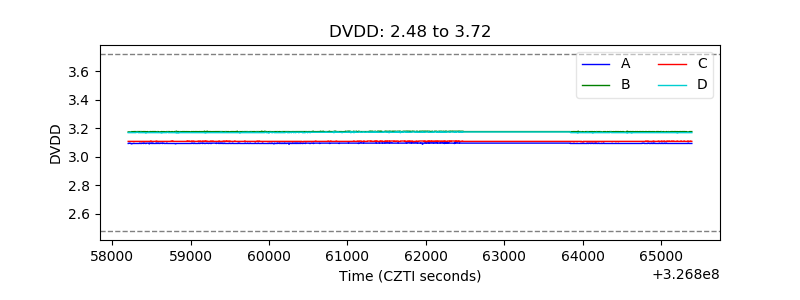 |
| Temperature 1 | 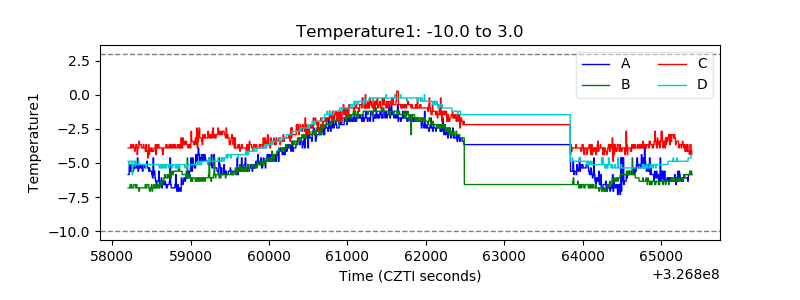 |
| Veto HV Monitor | 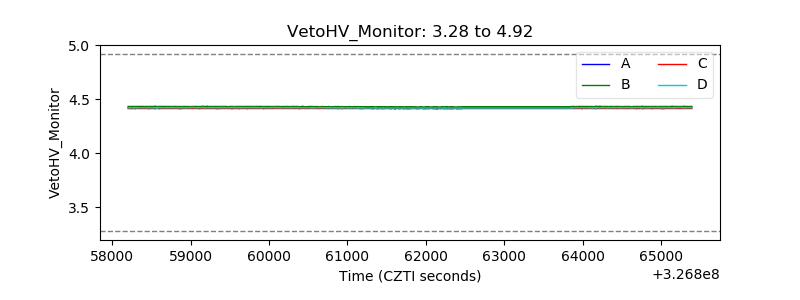 |
| Veto LLD | 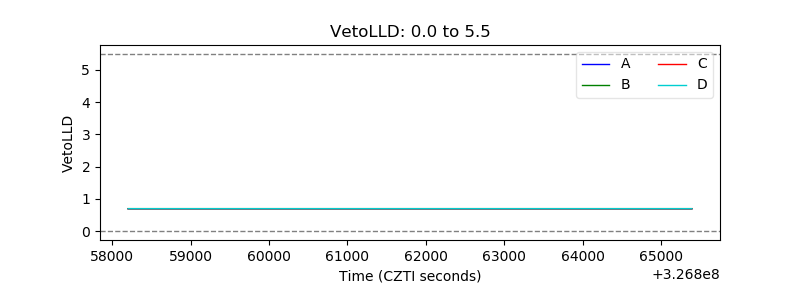 |
| Alpha Counter | 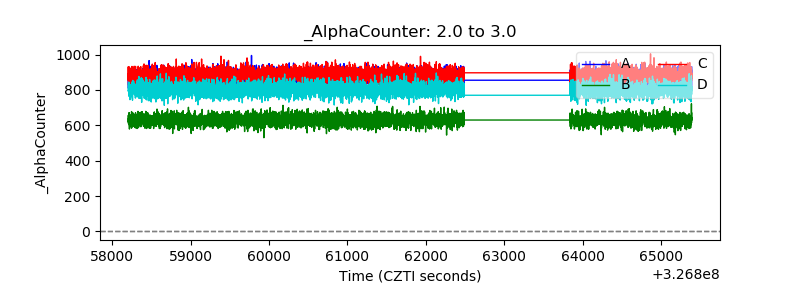 |
| _CPM_Rate | 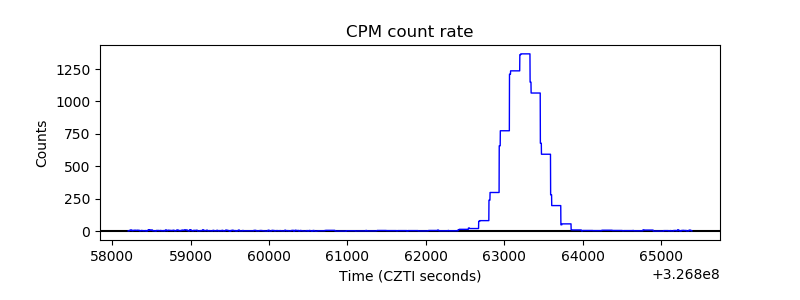 |
| CZT Counter | 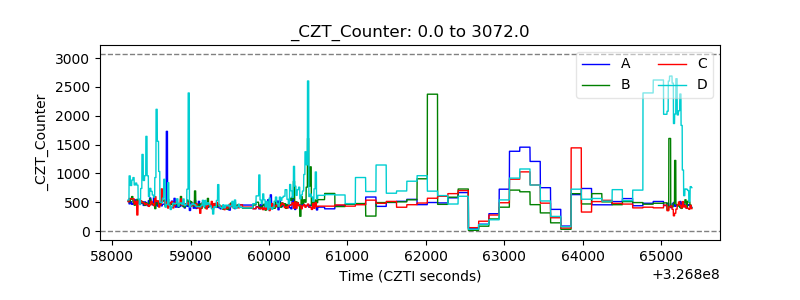 |
| +2.5 Volts monitor | 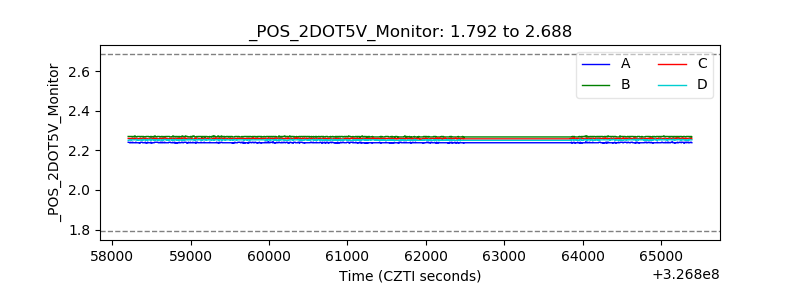 |
| +5 Volts monitor |  |
| _ROLL_ROT | 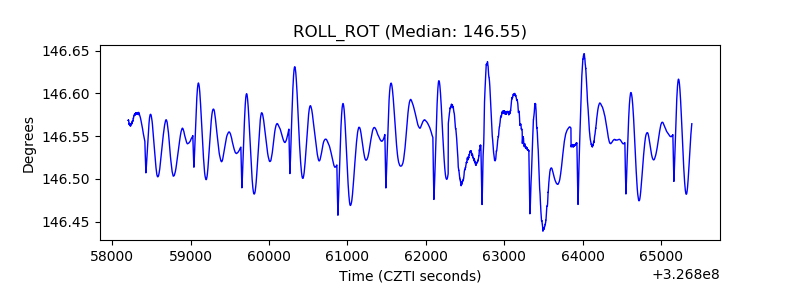 |
| _Roll_DEC | 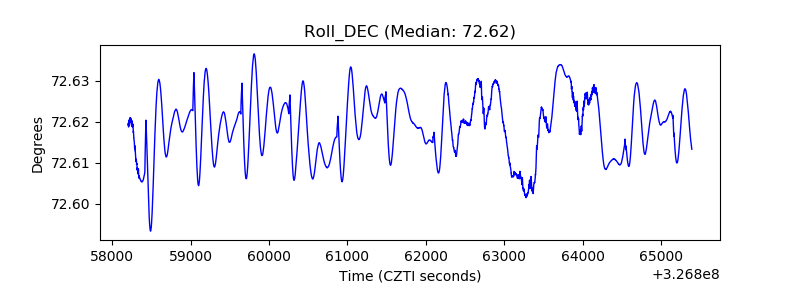 |
| _Roll_RA | 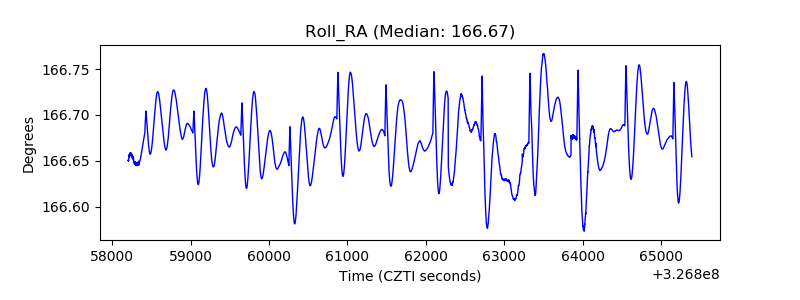 |
| Veto Counter | 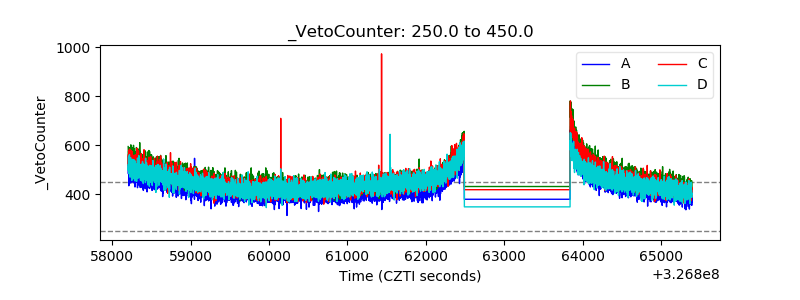 |