| Param | Original file | Final file |
|---|---|---|
| Filename | modeM0/AS1T03_200T01_9000003654_24972cztM0_level2.evt | modeM0/AS1T03_200T01_9000003654_24972cztM0_level2_quad_clean.evt |
| Size (bytes) | 470,252,160 | 127,549,440 |
| Size | 448.5 MB | 121.6 MB |
| Events in quadrant A | 3,089,409 | 869,678 |
| Events in quadrant B | 3,316,914 | 881,283 |
| Events in quadrant C | 3,135,834 | 841,850 |
| Events in quadrant D | 4,240,528 | 799,703 |
| Mode M9 | |||
|---|---|---|---|
| Quadrant | BADHDUFLAG | Total packets | Discarded packets |
| A | 0 | 6 | 0 |
| B | 0 | 6 | 0 |
| C | 0 | 6 | 0 |
| D | 0 | 6 | 0 |
| Mode SS | |||
|---|---|---|---|
| Quadrant | BADHDUFLAG | Total packets | Discarded packets |
| A | 0 | 138 | 0 |
| B | 0 | 138 | 0 |
| C | 0 | 138 | 0 |
| D | 0 | 138 | 0 |
| Mode M0 | |||
|---|---|---|---|
| Quadrant | BADHDUFLAG | Total packets | Discarded packets |
| A | 0 | 13726 | 1 |
| B | 0 | 14227 | 1 |
| C | 0 | 13773 | 1 |
| D | 0 | 17354 | 1 |
| Quadrant | Total seconds | Saturated seconds | Saturation percentage |
|---|---|---|---|
| A | 6745 | 68 | 1.008154% |
| B | 6746 | 120 | 1.778832% |
| C | 6746 | 83 | 1.230359% |
| D | 6746 | 377 | 5.588497% |
Noise dominated data is calculated using 1-second bins in cleaned event files. If a bin has >2000 counts, and if more than 50% of those come from <1% of pixels, then it is considered to be noise-dominated and hence unusable.
| Quadrant | # 1 sec bins | Bins with >0 counts | Bins with >2000 counts | High rate bins dominated by noise | Noise dominated (total time) | Noise dominated (detector-on time) | Marked lightcurve |
|---|---|---|---|---|---|---|---|
| A | 7365 | 6746 | 5 | 5 | 0.07% | 0.07% | 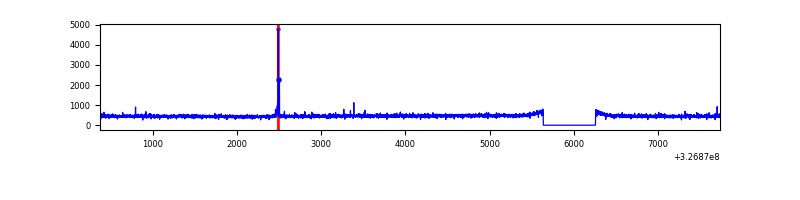 |
| B | 7366 | 6747 | 28 | 28 | 0.38% | 0.41% | 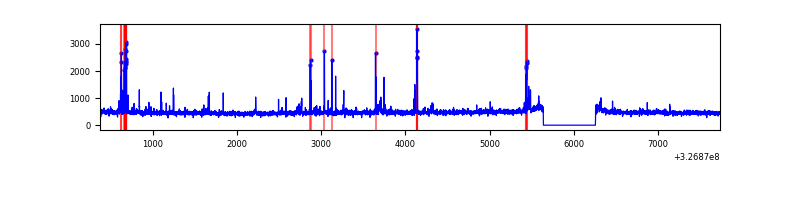 |
| C | 7366 | 6747 | 0 | 0 | 0.00% | 0.00% | 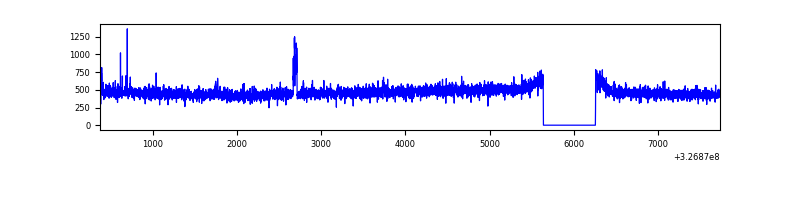 |
| D | 7366 | 6747 | 322 | 322 | 4.37% | 4.77% | 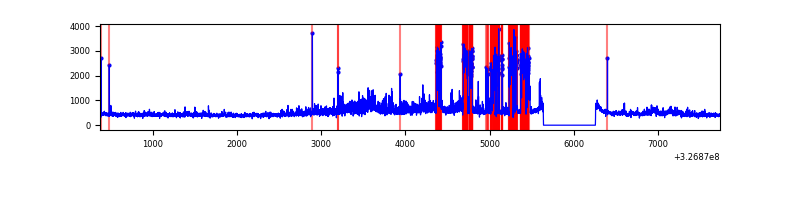 |
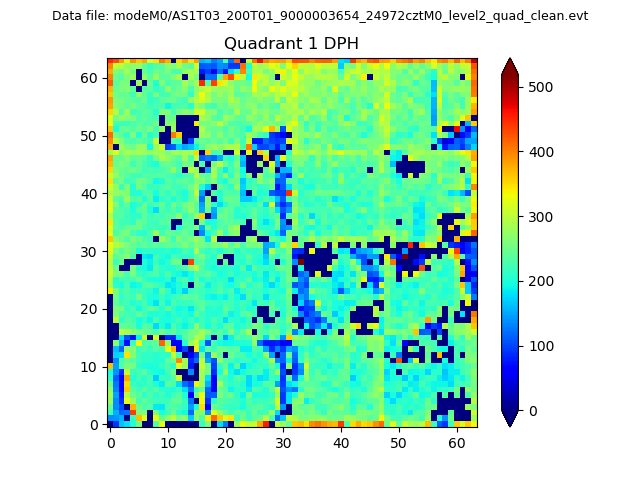
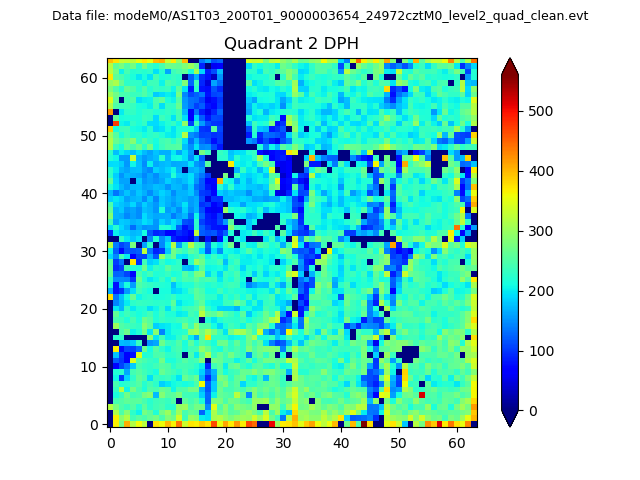
Top three noisy pixels from each quadrant. If the there are fewer than three noisy pixels in the level2.evt file, extra rows are filled as -1
| Pixel properties | Quadrant properties | ||||||
|---|---|---|---|---|---|---|---|
| Quadrant | DetID | PixID | Counts | Sigma | Mean | Median | Sigma |
| A | 4 | 2 | 24348 | 148.06 | 793 | 776 | 159.2 |
| A | 13 | 254 | 11161 | 65.23 | 793 | 776 | 159.2 |
| A | 3 | 137 | 7161 | 40.11 | 793 | 776 | 159.2 |
| B | 10 | 246 | 91202 | 610.24 | 792 | 773 | 148.2 |
| B | 3 | 64 | 54674 | 363.74 | 792 | 773 | 148.2 |
| B | 0 | 190 | 33182 | 218.71 | 792 | 773 | 148.2 |
| C | 14 | 238 | 121741 | 689.79 | 758 | 763 | 175.4 |
| C | 7 | 247 | 58053 | 326.65 | 758 | 763 | 175.4 |
| C | 13 | 61 | 5336 | 26.07 | 758 | 763 | 175.4 |
| D | 1 | 52 | 828212 | 4603.94 | 747 | 725 | 179.7 |
| D | 8 | 195 | 426260 | 2367.57 | 747 | 725 | 179.7 |
| D | 7 | 238 | 119001 | 658.06 | 747 | 725 | 179.7 |
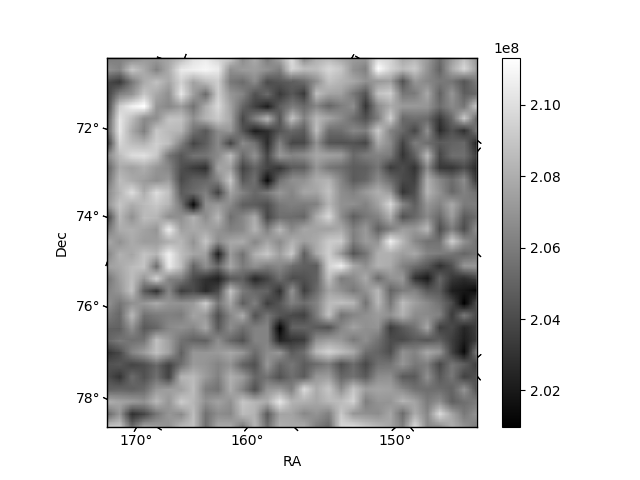
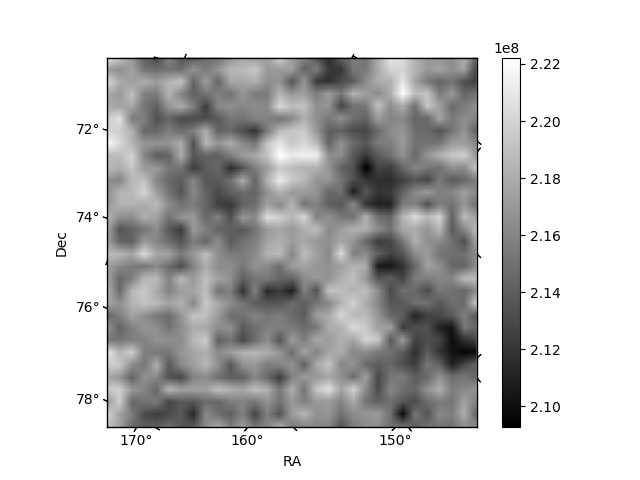
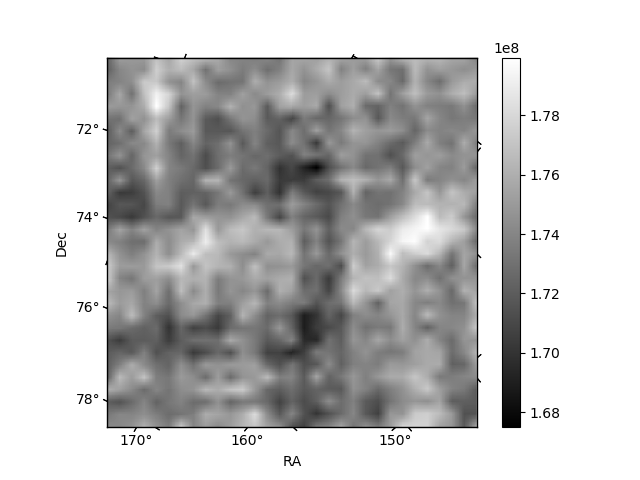
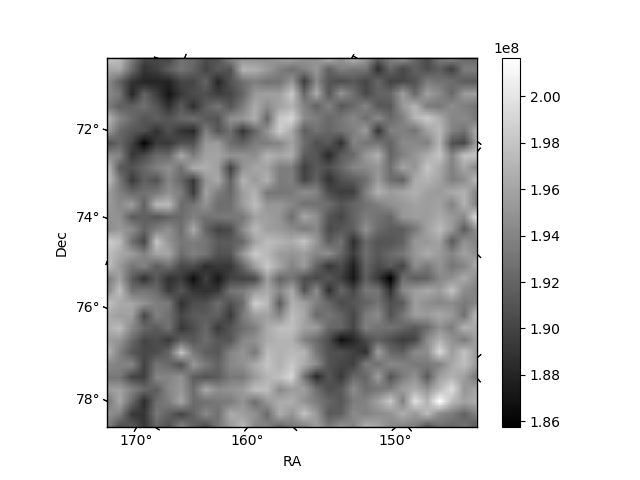
Histogram calculated using DETX and DETY for each event in the final _common_clean file
| Quadrant A | 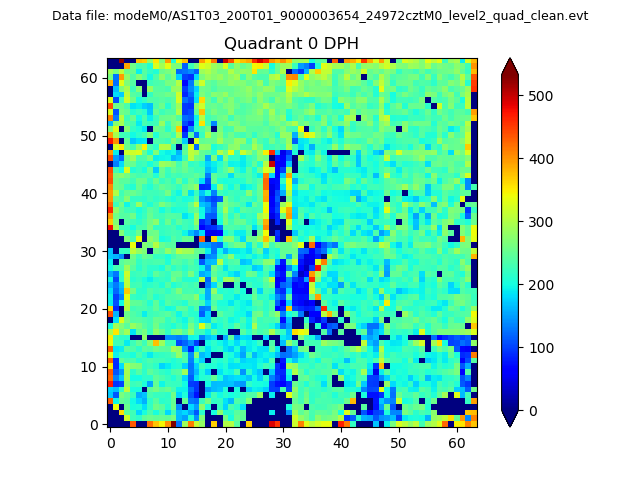 |
 |
Quadrant B |
|---|---|---|---|
| Quadrant D | 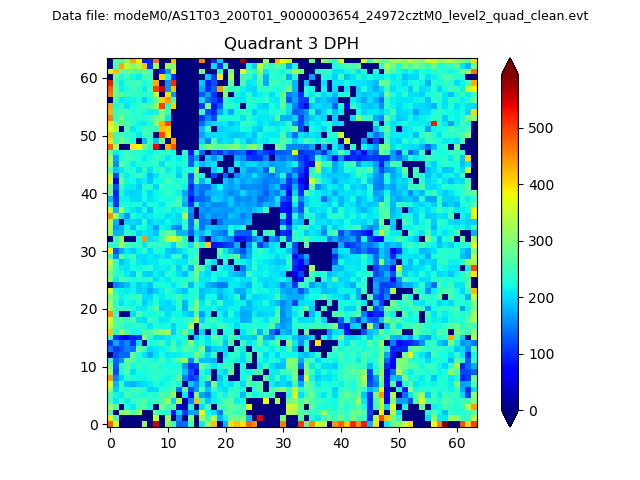 |
 |
Quadrant C |
| Plot type | Count rate plots | Images |
|---|---|---|
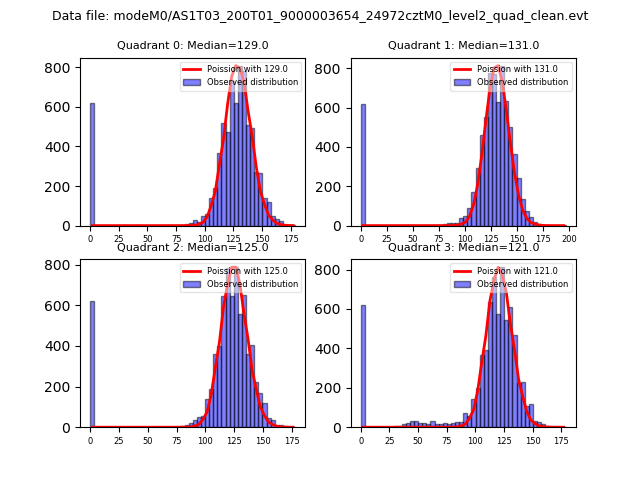
| Comparison with Poisson distribution Blue bars denote a histogram of data divided into 1 sec bins. Red curve is a Poisson curve with rate = median count rate of data. |
 |
 |
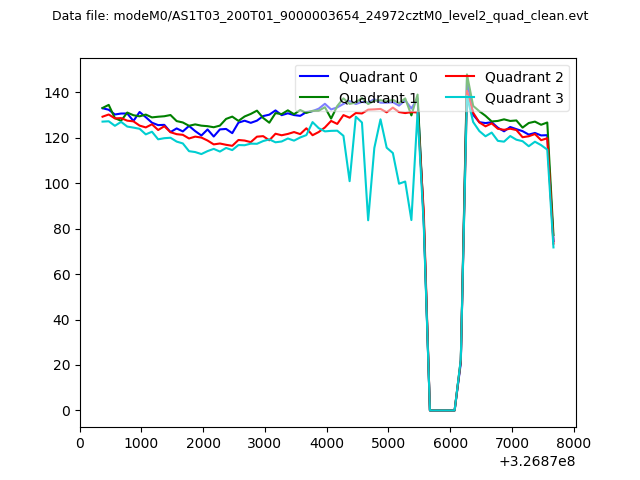
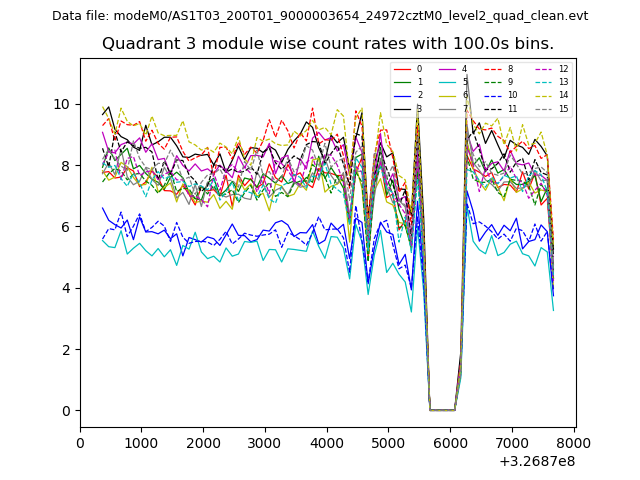
| Quadrant-wise count rates Data is divided into 100 sec bins |
 |
|
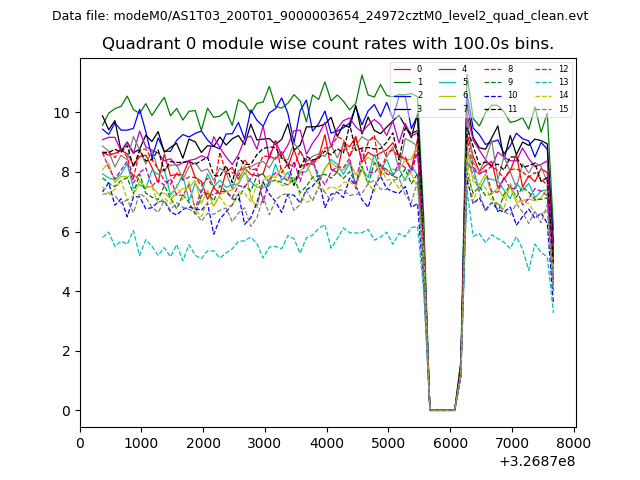
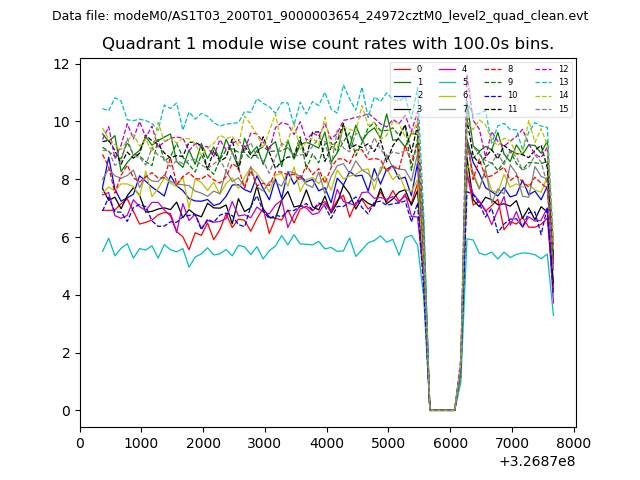
| Module-wise count rates for Quadrant A Data is divided into 100 sec bins |
 |
 |
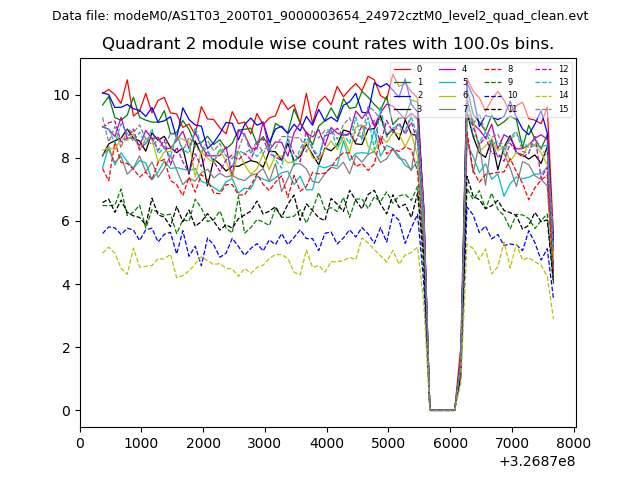
| Module-wise count rates for Quadrant B Data is divided into 100 sec bins |
 |
 |
| Module-wise count rates for Quadrant C Data is divided into 100 sec bins |
 |
 |
| Module-wise count rates for Quadrant D Data is divided into 100 sec bins |
 |
 |
| Parameter | Plot |
|---|---|
| CZT HV Monitor | 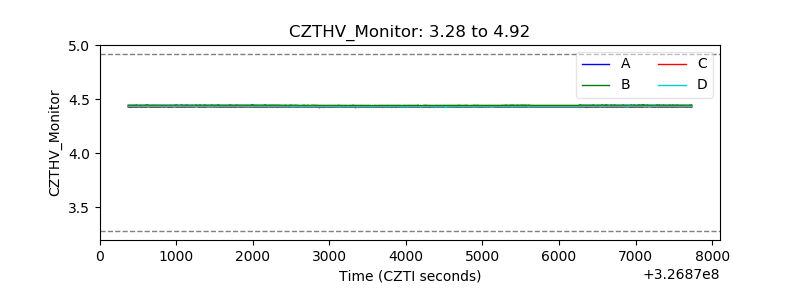 |
| D_VDD | 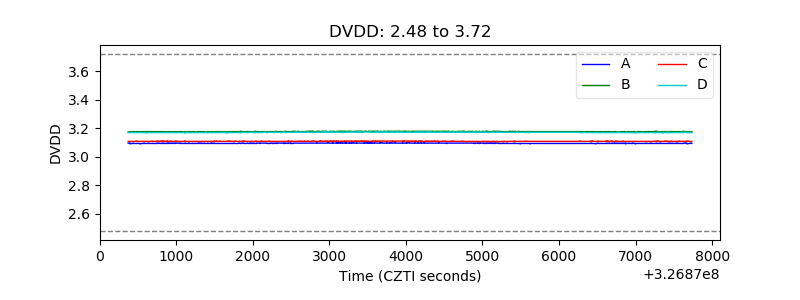 |
| Temperature 1 | 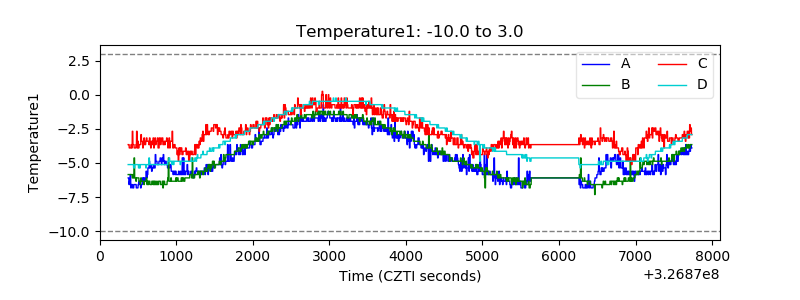 |
| Veto HV Monitor | 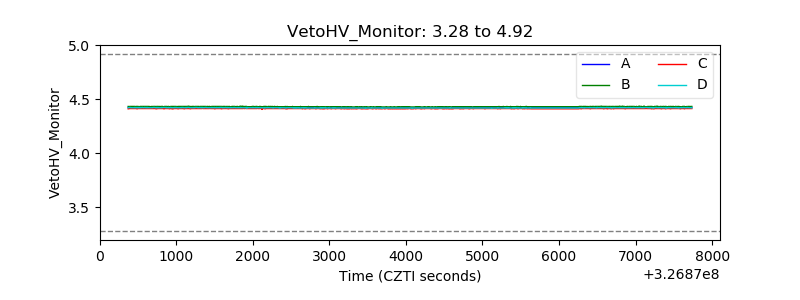 |
| Veto LLD | 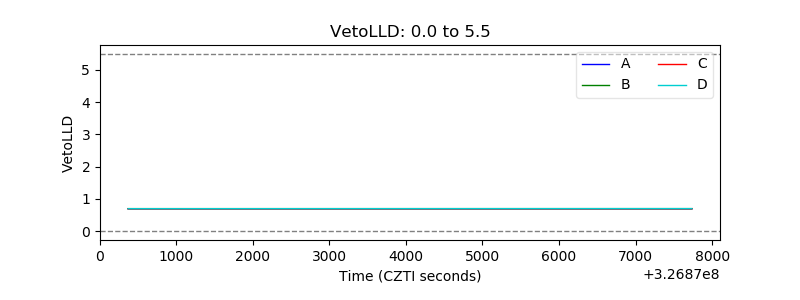 |
| Alpha Counter | 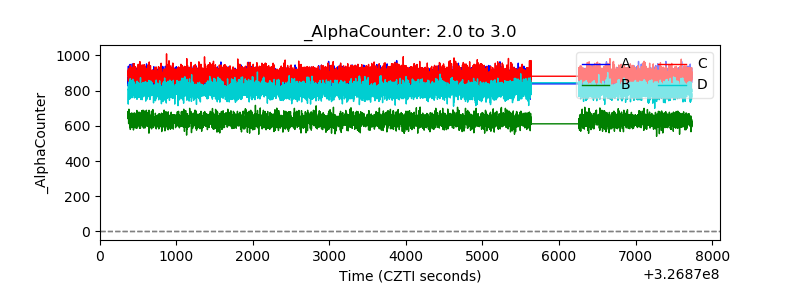 |
| _CPM_Rate | 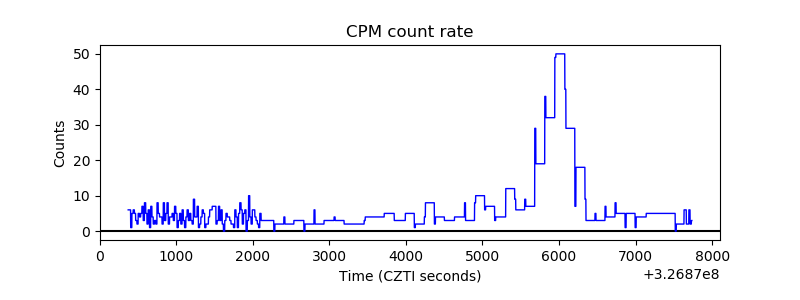 |
| CZT Counter |  |
| +2.5 Volts monitor |  |
| +5 Volts monitor |  |
| _ROLL_ROT | 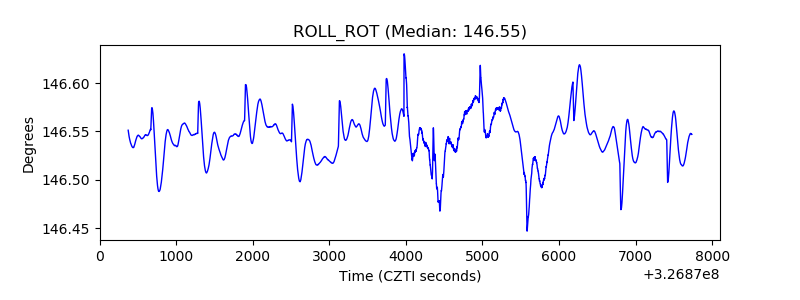 |
| _Roll_DEC | 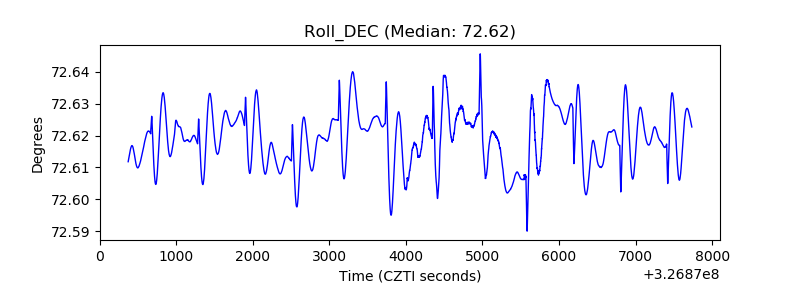 |
| _Roll_RA | 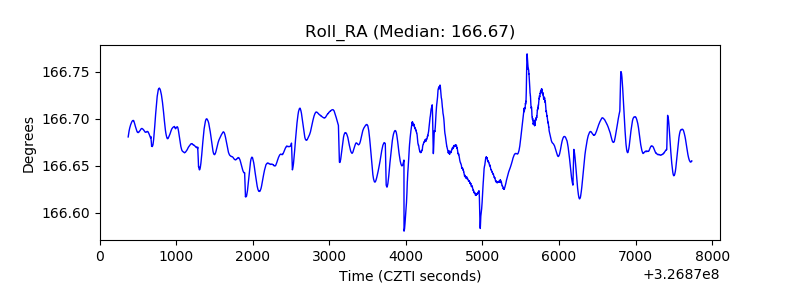 |
| Veto Counter | 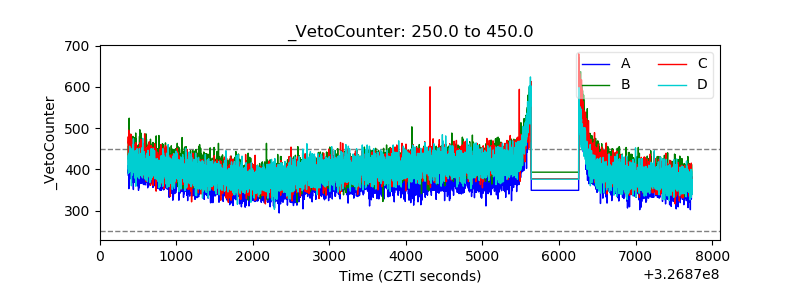 |