| Param | Original file | Final file |
|---|---|---|
| Filename | modeM0/AS1T03_200T01_9000003654_24973cztM0_level2.evt | modeM0/AS1T03_200T01_9000003654_24973cztM0_level2_quad_clean.evt |
| Size (bytes) | 178,427,520 | 52,608,960 |
| Size | 170.2 MB | 50.2 MB |
| Events in quadrant A | 1,269,379 | 354,752 |
| Events in quadrant B | 1,345,335 | 361,083 |
| Events in quadrant C | 1,242,784 | 339,683 |
| Events in quadrant D | 1,348,348 | 332,166 |
| Mode SS | |||
|---|---|---|---|
| Quadrant | BADHDUFLAG | Total packets | Discarded packets |
| A | 0 | 56 | 0 |
| B | 0 | 56 | 0 |
| C | 0 | 56 | 0 |
| D | 0 | 56 | 0 |
| Mode M0 | |||
|---|---|---|---|
| Quadrant | BADHDUFLAG | Total packets | Discarded packets |
| A | 0 | 5765 | 0 |
| B | 0 | 5914 | 0 |
| C | 0 | 5764 | 0 |
| D | 0 | 5959 | 0 |
| Quadrant | Total seconds | Saturated seconds | Saturation percentage |
|---|---|---|---|
| A | 2878 | 4 | 0.138985% |
| B | 2879 | 1 | 0.034734% |
| C | 2879 | 4 | 0.138937% |
| D | 2879 | 0 | 0.000000% |
Noise dominated data is calculated using 1-second bins in cleaned event files. If a bin has >2000 counts, and if more than 50% of those come from <1% of pixels, then it is considered to be noise-dominated and hence unusable.
| Quadrant | # 1 sec bins | Bins with >0 counts | Bins with >2000 counts | High rate bins dominated by noise | Noise dominated (total time) | Noise dominated (detector-on time) | Marked lightcurve |
|---|---|---|---|---|---|---|---|
| A | 2878 | 2878 | 0 | 0 | 0.00% | 0.00% |  |
| B | 2879 | 2879 | 1 | 1 | 0.03% | 0.03% | 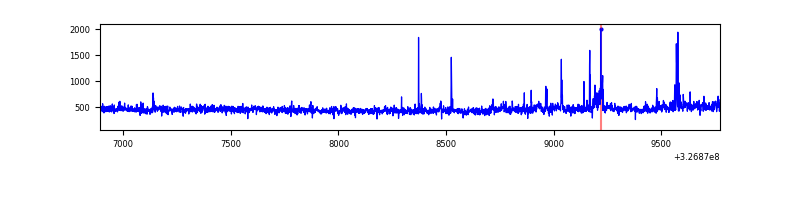 |
| C | 2879 | 2879 | 0 | 0 | 0.00% | 0.00% | 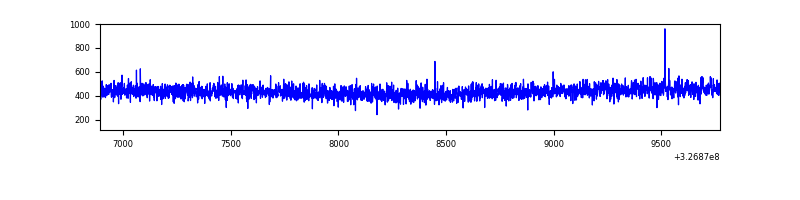 |
| D | 2879 | 2879 | 0 | 0 | 0.00% | 0.00% | 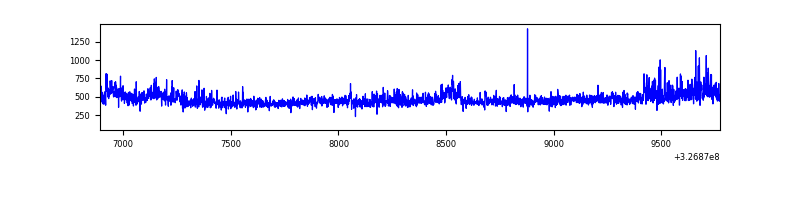 |
Top three noisy pixels from each quadrant. If the there are fewer than three noisy pixels in the level2.evt file, extra rows are filled as -1
| Pixel properties | Quadrant properties | ||||||
|---|---|---|---|---|---|---|---|
| Quadrant | DetID | PixID | Counts | Sigma | Mean | Median | Sigma |
| A | 6 | 16 | 13621 | 199.94 | 325 | 319 | 66.5 |
| A | 13 | 254 | 4424 | 61.7 | 325 | 319 | 66.5 |
| A | 3 | 137 | 2880 | 38.49 | 325 | 319 | 66.5 |
| B | 3 | 64 | 41467 | 649.67 | 321 | 313 | 63.3 |
| B | 10 | 246 | 10588 | 162.2 | 321 | 313 | 63.3 |
| B | 5 | 172 | 9126 | 139.12 | 321 | 313 | 63.3 |
| C | 14 | 238 | 48768 | 675.3 | 304 | 305 | 71.8 |
| C | 7 | 247 | 5932 | 78.41 | 304 | 305 | 71.8 |
| C | 0 | 207 | 2654 | 32.73 | 304 | 305 | 71.8 |
| D | 7 | 238 | 79833 | 1039.84 | 311 | 301 | 76.5 |
| D | 8 | 195 | 74826 | 974.38 | 311 | 301 | 76.5 |
| D | 2 | 234 | 11009 | 140.0 | 311 | 301 | 76.5 |
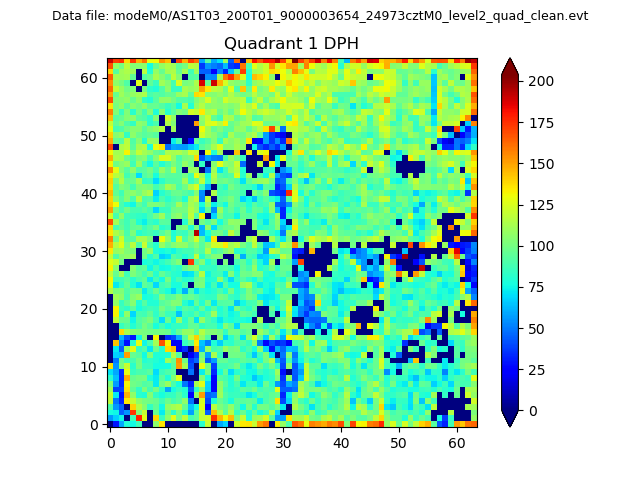
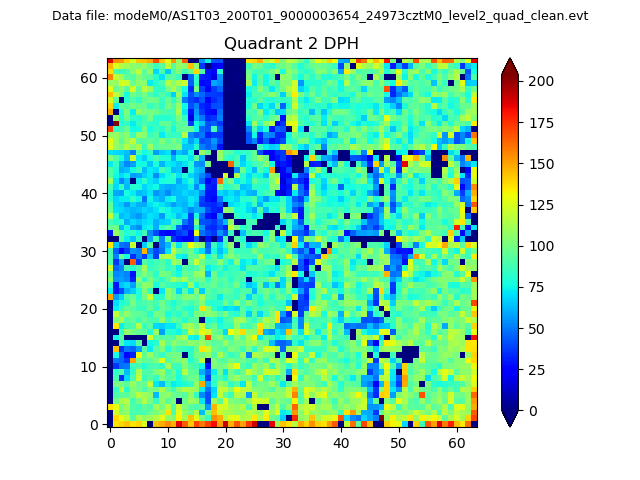
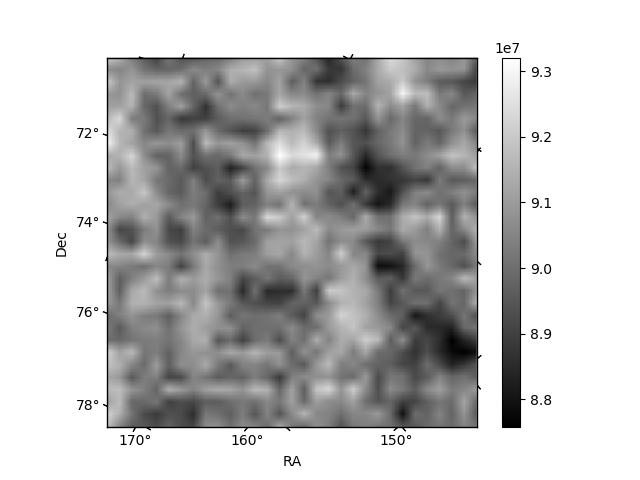
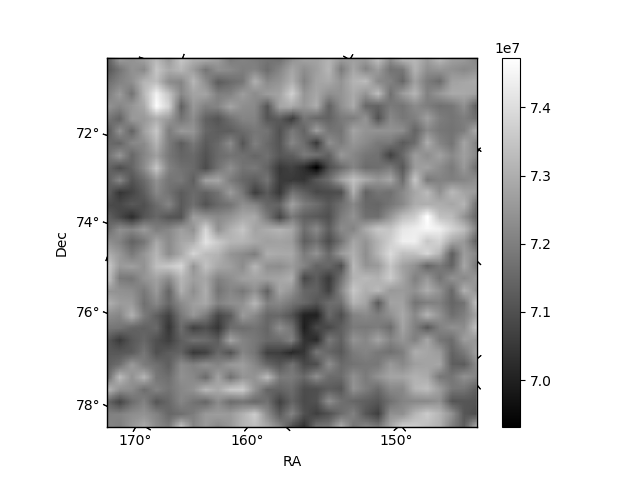
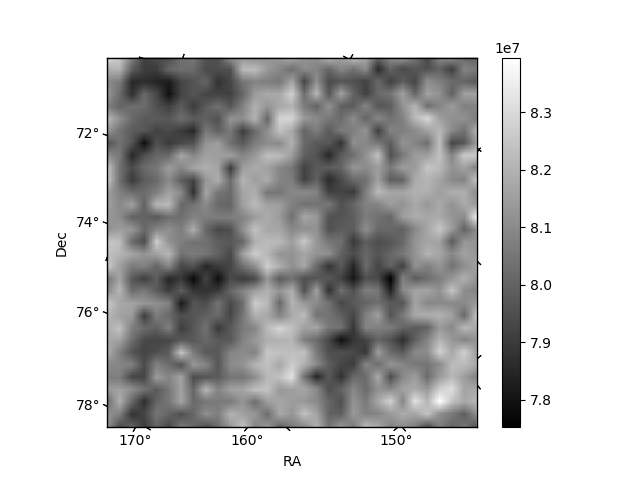
Histogram calculated using DETX and DETY for each event in the final _common_clean file
| Quadrant A | 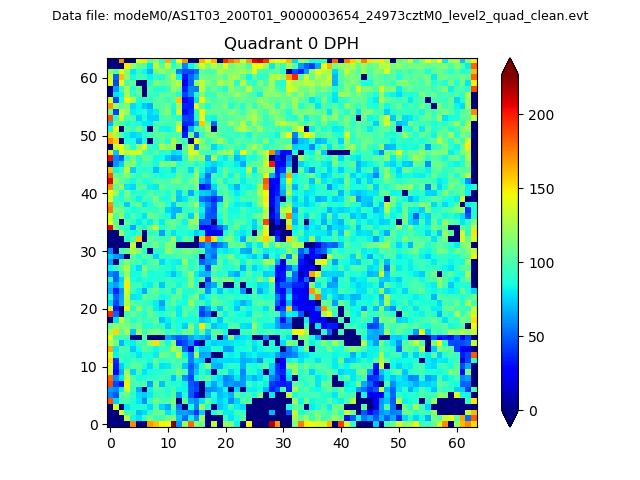 |
 |
Quadrant B |
|---|---|---|---|
| Quadrant D | 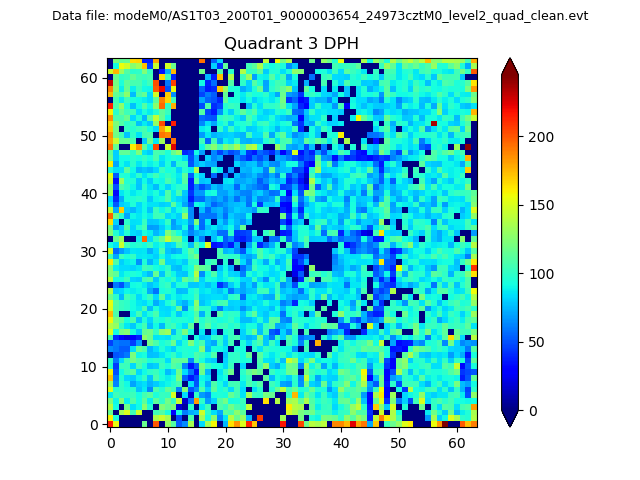 |
 |
Quadrant C |
| Plot type | Count rate plots | Images |
|---|---|---|
| Comparison with Poisson distribution Blue bars denote a histogram of data divided into 1 sec bins. Red curve is a Poisson curve with rate = median count rate of data. |
 |
 |
| Quadrant-wise count rates Data is divided into 100 sec bins |
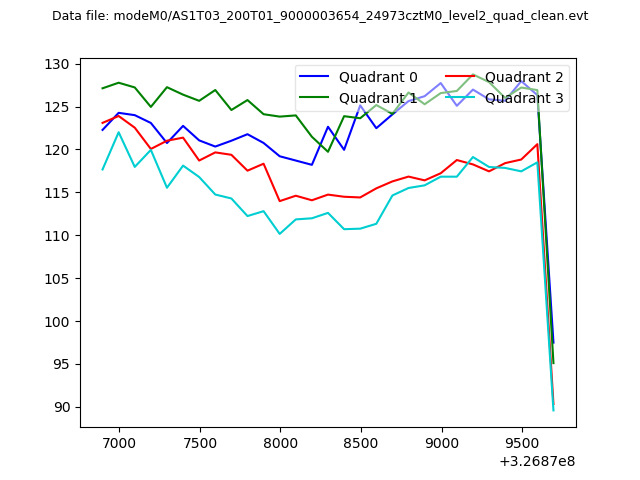 |
|
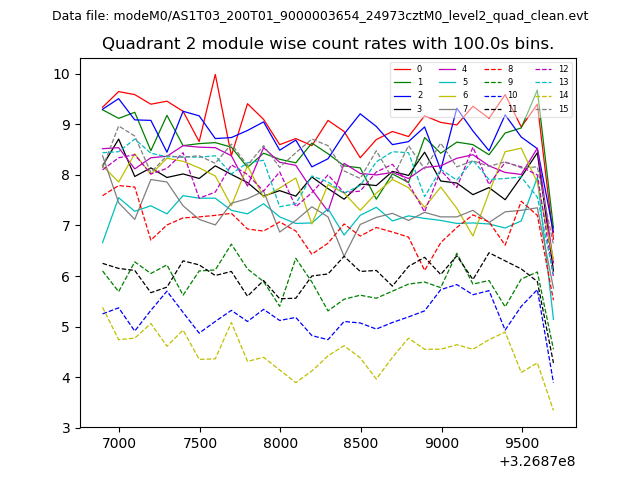
| Module-wise count rates for Quadrant A Data is divided into 100 sec bins |
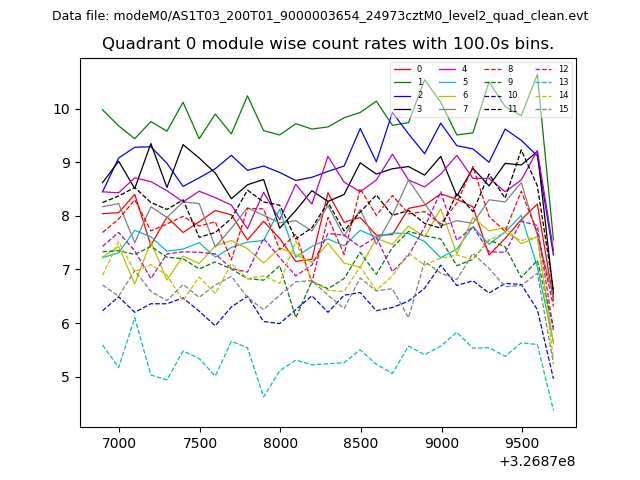 |
 |
| Module-wise count rates for Quadrant B Data is divided into 100 sec bins |
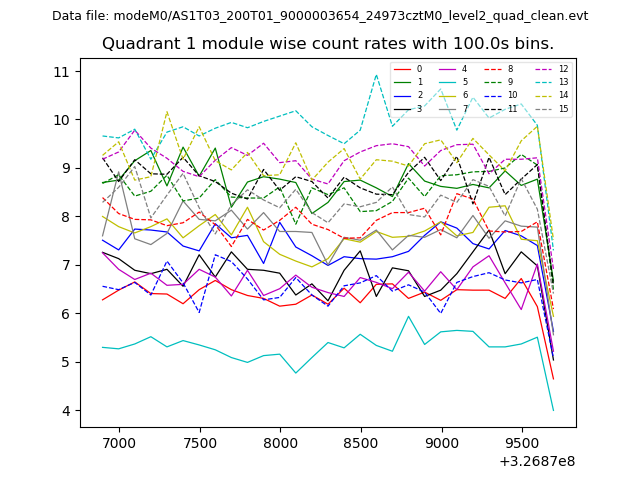 |
 |
| Module-wise count rates for Quadrant C Data is divided into 100 sec bins |
 |
 |
| Module-wise count rates for Quadrant D Data is divided into 100 sec bins |
 |
 |
| Parameter | Plot |
|---|---|
| CZT HV Monitor | 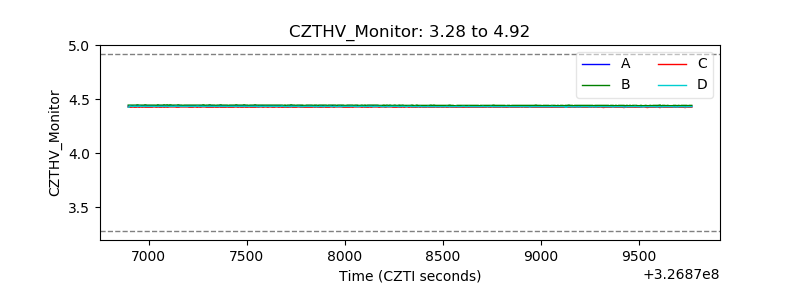 |
| D_VDD | 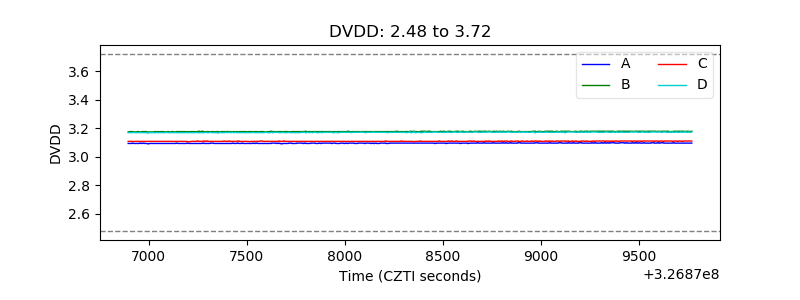 |
| Temperature 1 | 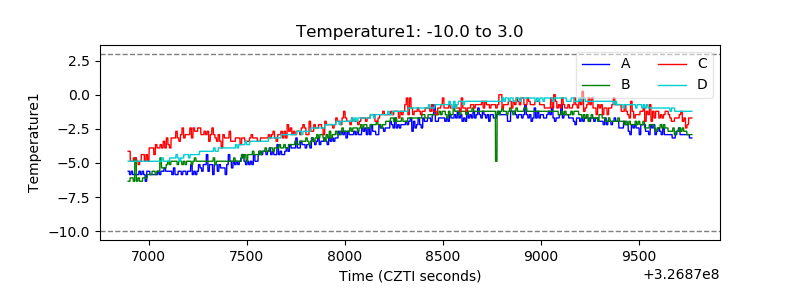 |
| Veto HV Monitor | 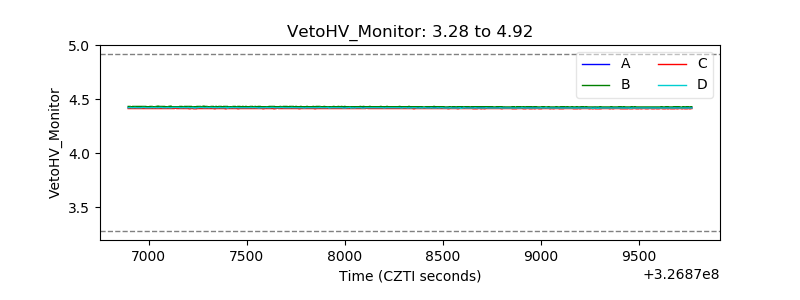 |
| Veto LLD | 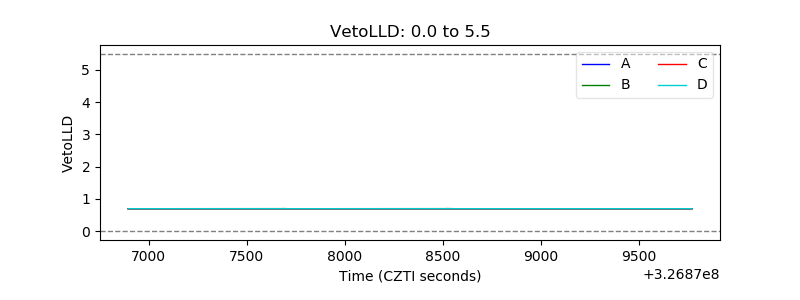 |
| Alpha Counter | 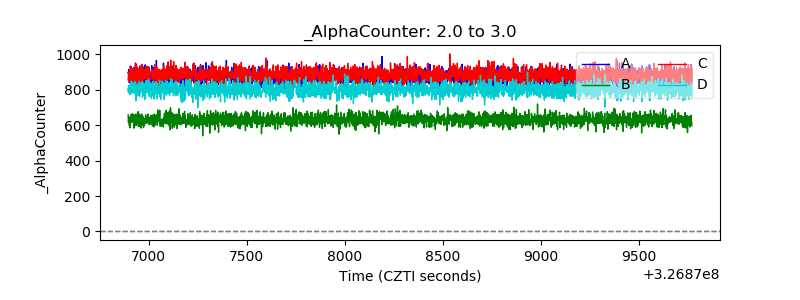 |
| _CPM_Rate | 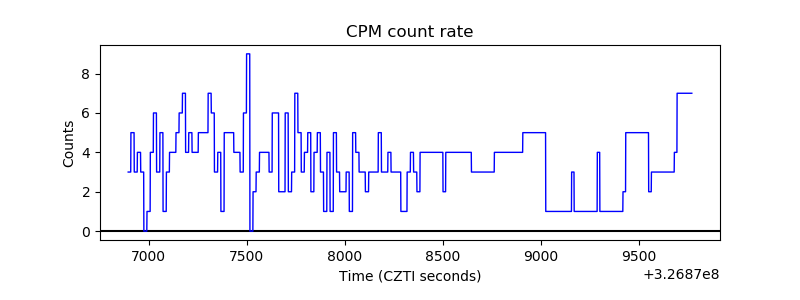 |
| CZT Counter | 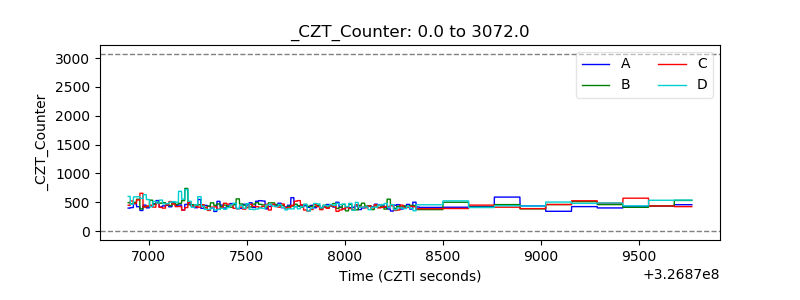 |
| +2.5 Volts monitor |  |
| +5 Volts monitor | 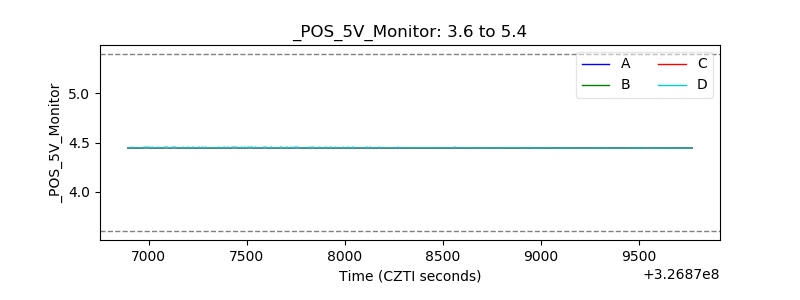 |
| _ROLL_ROT |  |
| _Roll_DEC | 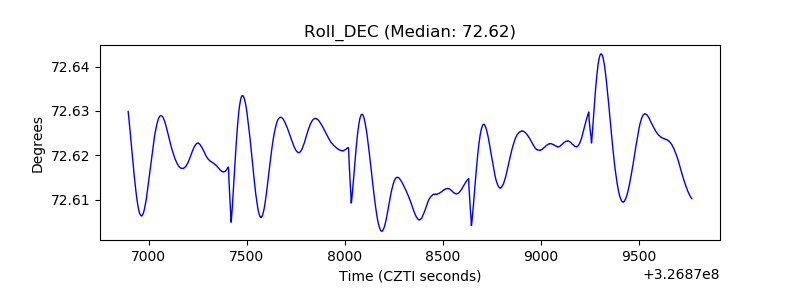 |
| _Roll_RA | 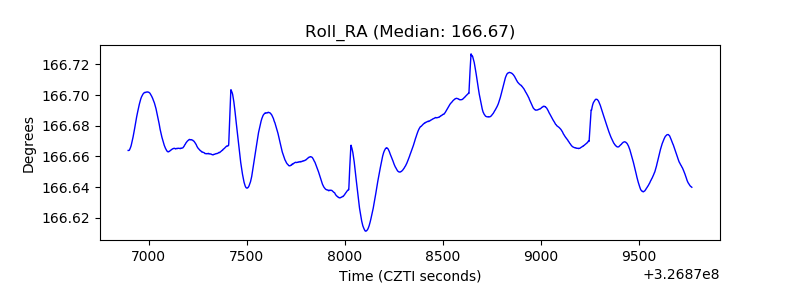 |
| Veto Counter |  |