| Param | Original file | Final file |
|---|---|---|
| Filename | modeM0/AS1A08_003T17_9000003656cztM0_level2.fits | modeM0/AS1A08_003T17_9000003656cztM0_level2_quad_clean.evt |
| Size (bytes) | 250,951,680 | 242,470,080 |
| Size | 239.3 MB | 231.2 MB |
| Events in quadrant A | 1,535,692 | 1,457,637 |
| Events in quadrant B | 1,457,844 | 1,446,725 |
| Events in quadrant C | 1,484,198 | 1,365,493 |
| Events in quadrant D | 1,292,194 | 1,243,588 |
| Mode M0 | |||
|---|---|---|---|
| Quadrant | BADHDUFLAG | Total packets | Discarded packets |
| A | 0 | 54794 | 0 |
| B | 0 | 60290 | 0 |
| C | 0 | 56868 | 0 |
| D | 0 | 67288 | 0 |
| Mode SS | |||
|---|---|---|---|
| Quadrant | BADHDUFLAG | Total packets | Discarded packets |
| A | 0 | 544 | 0 |
| B | 0 | 544 | 0 |
| C | 0 | 544 | 0 |
| D | 0 | 546 | 0 |
| Mode M9 | |||
|---|---|---|---|
| Quadrant | BADHDUFLAG | Total packets | Discarded packets |
| A | 0 | 19 | 0 |
| B | 0 | 19 | 0 |
| C | 0 | 19 | 0 |
| D | 0 | 19 | 0 |
| Quadrant | Total seconds | Saturated seconds | Saturation percentage |
|---|---|---|---|
| A | 26586 | 592 | 2.226736% |
| B | 26588 | 1189 | 4.471942% |
| C | 26592 | 732 | 2.752708% |
| D | 26591 | 989 | 3.719304% |
Noise dominated data is calculated using 1-second bins in cleaned event files. If a bin has >2000 counts, and if more than 50% of those come from <1% of pixels, then it is considered to be noise-dominated and hence unusable.
| Quadrant | # 1 sec bins | Bins with >0 counts | Bins with >2000 counts | High rate bins dominated by noise | Noise dominated (total time) | Noise dominated (detector-on time) | Marked lightcurve |
|---|---|---|---|---|---|---|---|
| A | 29147 | 26606 | 0 | 0 | 0.00% | 0.00% |  |
| B | 29147 | 26601 | 0 | 0 | 0.00% | 0.00% |  |
| C | 29147 | 26610 | 0 | 0 | 0.00% | 0.00% |  |
| D | 29147 | 26575 | 0 | 0 | 0.00% | 0.00% |  |
Top three noisy pixels from each quadrant. If the there are fewer than three noisy pixels in the level2.evt file, extra rows are filled as -1
| Pixel properties | Quadrant properties | ||||||
|---|---|---|---|---|---|---|---|
| Quadrant | DetID | PixID | Counts | Sigma | Mean | Median | Sigma |
| A | 0 | 29 | 1525 | 11.32 | 398 | 371 | 102.0 |
| A | 7 | 110 | 1224 | 8.37 | 398 | 371 | 102.0 |
| A | 0 | 30 | 1208 | 8.21 | 398 | 371 | 102.0 |
| B | 2 | 9 | 1153 | 9.99 | 385 | 365 | 78.9 |
| B | 3 | 17 | 1003 | 8.08 | 385 | 365 | 78.9 |
| B | 2 | 8 | 977 | 7.76 | 385 | 365 | 78.9 |
| C | 12 | 241 | 1080 | 6.94 | 392 | 362 | 103.4 |
| C | 3 | 126 | 1036 | 6.51 | 392 | 362 | 103.4 |
| C | 2 | 191 | 1004 | 6.21 | 392 | 362 | 103.4 |
| D | 3 | 14 | 970 | 6.32 | 368 | 334 | 100.6 |
| D | 7 | 3 | 938 | 6.0 | 368 | 334 | 100.6 |
| D | 10 | 189 | 934 | 5.96 | 368 | 334 | 100.6 |
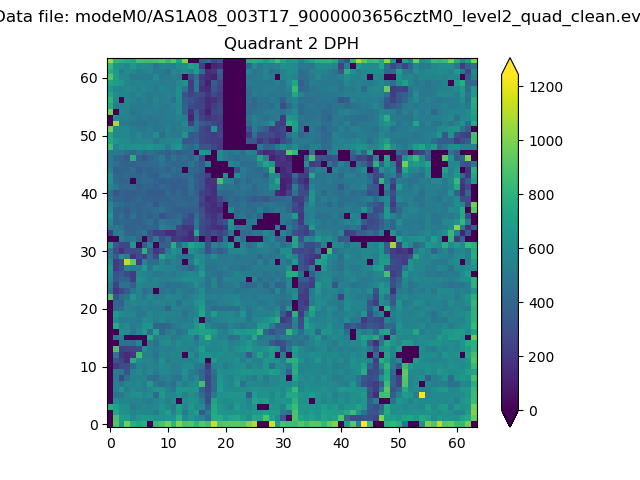
Histogram calculated using DETX and DETY for each event in the final _common_clean file
| Quadrant A |  |
 |
Quadrant B |
|---|---|---|---|
| Quadrant D |  |
 |
Quadrant C |
| Plot type | Count rate plots | Images |
|---|---|---|
| Comparison with Poisson distribution Blue bars denote a histogram of data divided into 1 sec bins. Red curve is a Poisson curve with rate = median count rate of data. |
 |
 |
| Quadrant-wise count rates Data is divided into 100 sec bins |
 |
|
| Module-wise count rates for Quadrant A Data is divided into 100 sec bins |
 |
 |
| Module-wise count rates for Quadrant B Data is divided into 100 sec bins |
 |
 |
| Module-wise count rates for Quadrant C Data is divided into 100 sec bins |
 |
 |
| Module-wise count rates for Quadrant D Data is divided into 100 sec bins |
 |
 |
| Parameter | Plot |
|---|---|
| CZT HV Monitor |  |
| D_VDD |  |
| Temperature 1 |  |
| Veto HV Monitor |  |
| Veto LLD |  |
| Alpha Counter |  |
| _CPM_Rate |  |
| CZT Counter |  |
| +2.5 Volts monitor |  |
| +5 Volts monitor |  |
| _ROLL_ROT |  |
| _Roll_DEC |  |
| _Roll_RA |  |
| Veto Counter | 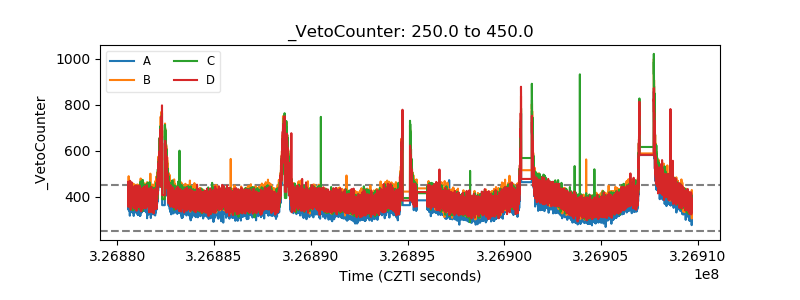 |