| Param | Original file | Final file |
|---|---|---|
| Filename | modeM0/AS1A08_003T17_9000003656_24973cztM0_level2.evt | modeM0/AS1A08_003T17_9000003656_24973cztM0_level2_quad_clean.evt |
| Size (bytes) | 259,752,960 | 28,537,920 |
| Size | 247.7 MB | 27.2 MB |
| Events in quadrant A | 1,677,097 | 163,658 |
| Events in quadrant B | 2,495,877 | 148,714 |
| Events in quadrant C | 1,698,745 | 159,136 |
| Events in quadrant D | 1,767,957 | 156,636 |
| Mode M0 | |||
|---|---|---|---|
| Quadrant | BADHDUFLAG | Total packets | Discarded packets |
| A | 0 | 7026 | 2 |
| B | 0 | 9479 | 2 |
| C | 0 | 7079 | 2 |
| D | 0 | 7352 | 2 |
| Mode SS | |||
|---|---|---|---|
| Quadrant | BADHDUFLAG | Total packets | Discarded packets |
| A | 0 | 70 | 0 |
| B | 0 | 70 | 0 |
| C | 0 | 70 | 0 |
| D | 0 | 70 | 0 |
| Mode M9 | |||
|---|---|---|---|
| Quadrant | BADHDUFLAG | Total packets | Discarded packets |
| A | 0 | 1 | 0 |
| B | 0 | 1 | 0 |
| C | 0 | 1 | 0 |
| D | 0 | 1 | 0 |
| Quadrant | Total seconds | Saturated seconds | Saturation percentage |
|---|---|---|---|
| A | 3307 | 163 | 4.928939% |
| B | 3307 | 461 | 13.940127% |
| C | 3307 | 171 | 5.170850% |
| D | 3307 | 115 | 3.477472% |
Noise dominated data is calculated using 1-second bins in cleaned event files. If a bin has >2000 counts, and if more than 50% of those come from <1% of pixels, then it is considered to be noise-dominated and hence unusable.
| Quadrant | # 1 sec bins | Bins with >0 counts | Bins with >2000 counts | High rate bins dominated by noise | Noise dominated (total time) | Noise dominated (detector-on time) | Marked lightcurve |
|---|---|---|---|---|---|---|---|
| A | 3477 | 3309 | 0 | 0 | 0.00% | 0.00% | 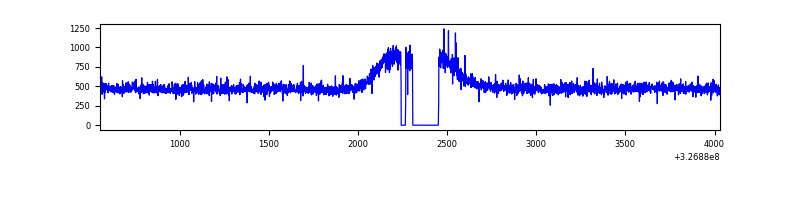 |
| B | 3477 | 3309 | 169 | 169 | 4.86% | 5.11% | 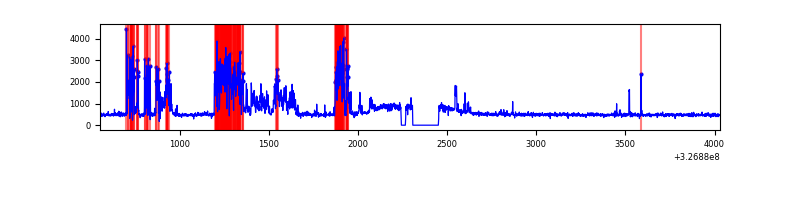 |
| C | 3477 | 3309 | 0 | 0 | 0.00% | 0.00% | 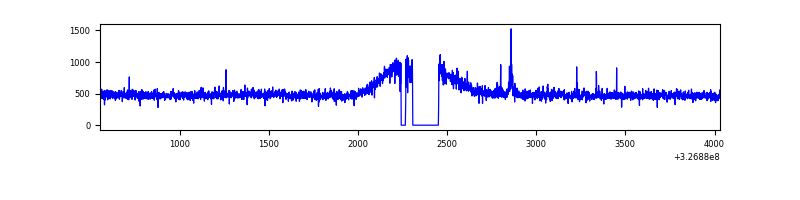 |
| D | 3477 | 3309 | 0 | 0 | 0.00% | 0.00% | 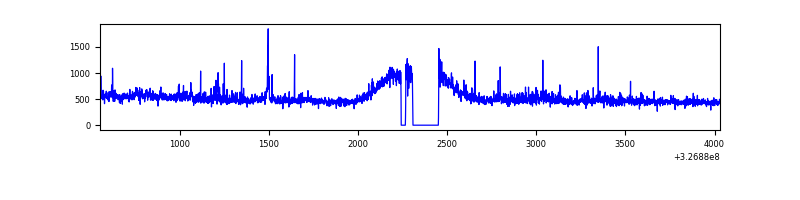 |
Top three noisy pixels from each quadrant. If the there are fewer than three noisy pixels in the level2.evt file, extra rows are filled as -1
| Pixel properties | Quadrant properties | ||||||
|---|---|---|---|---|---|---|---|
| Quadrant | DetID | PixID | Counts | Sigma | Mean | Median | Sigma |
| A | 6 | 16 | 9387 | 99.75 | 432 | 421 | 89.9 |
| A | 13 | 254 | 5182 | 52.97 | 432 | 421 | 89.9 |
| A | 3 | 137 | 4221 | 42.28 | 432 | 421 | 89.9 |
| B | 10 | 246 | 449492 | 5306.01 | 418 | 406 | 84.6 |
| B | 3 | 64 | 384084 | 4533.2 | 418 | 406 | 84.6 |
| B | 6 | 36 | 16230 | 186.96 | 418 | 406 | 84.6 |
| C | 14 | 238 | 64146 | 632.55 | 413 | 413 | 100.8 |
| C | 7 | 247 | 20854 | 202.87 | 413 | 413 | 100.8 |
| C | 13 | 61 | 2864 | 24.32 | 413 | 413 | 100.8 |
| D | 8 | 195 | 54844 | 521.62 | 418 | 405 | 104.4 |
| D | 2 | 244 | 47456 | 450.83 | 418 | 405 | 104.4 |
| D | 7 | 238 | 45737 | 434.36 | 418 | 405 | 104.4 |
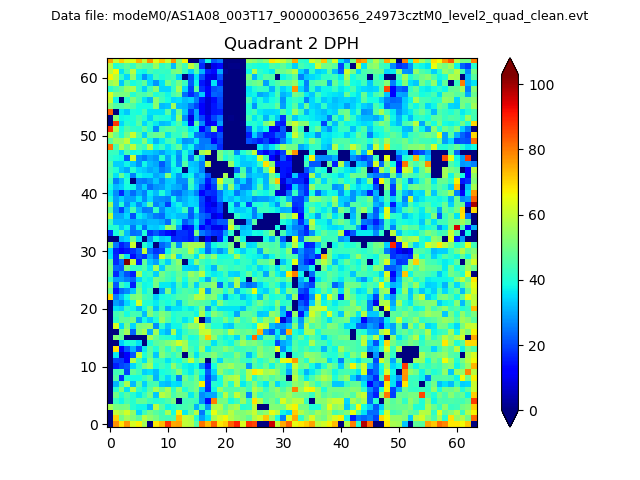
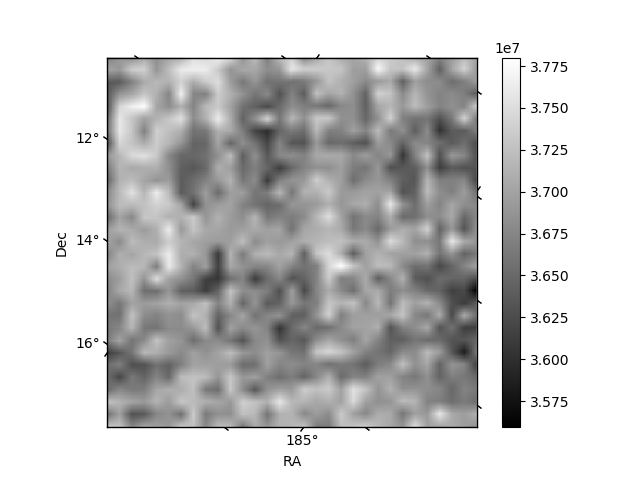
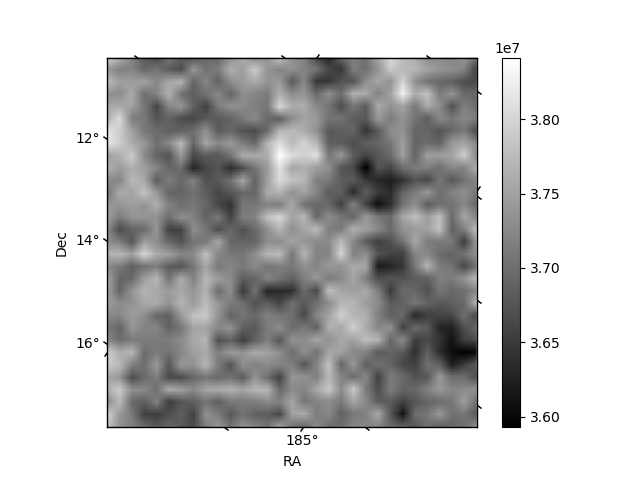
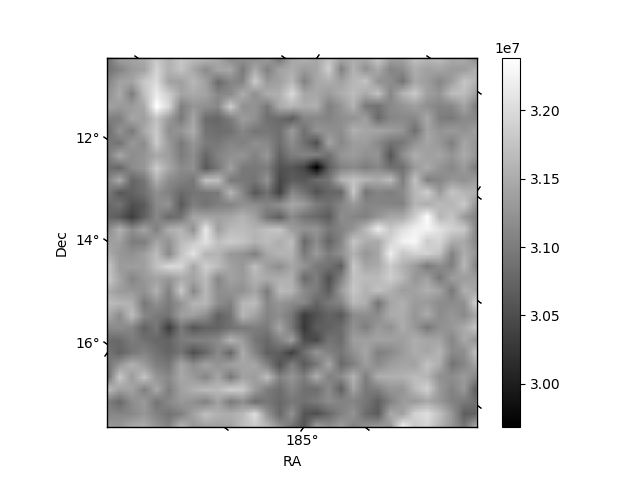
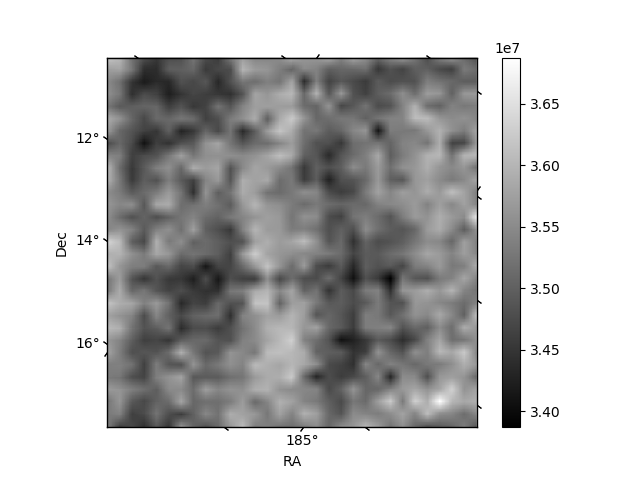
Histogram calculated using DETX and DETY for each event in the final _common_clean file
| Quadrant A |  |
 |
Quadrant B |
|---|---|---|---|
| Quadrant D | 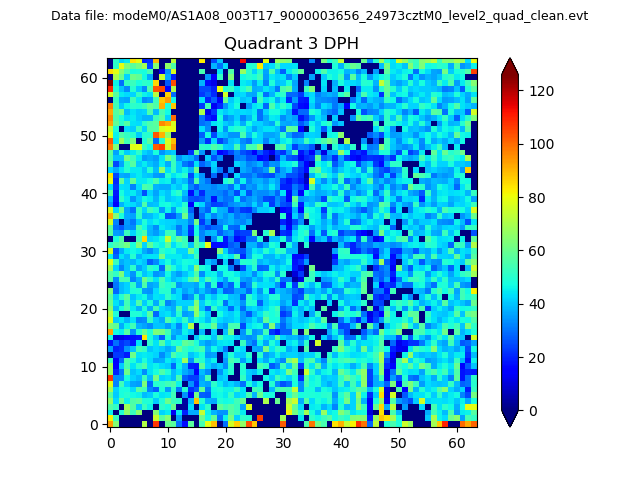 |
 |
Quadrant C |
| Plot type | Count rate plots | Images |
|---|---|---|
| Comparison with Poisson distribution Blue bars denote a histogram of data divided into 1 sec bins. Red curve is a Poisson curve with rate = median count rate of data. |
 |
 |
| Quadrant-wise count rates Data is divided into 100 sec bins |
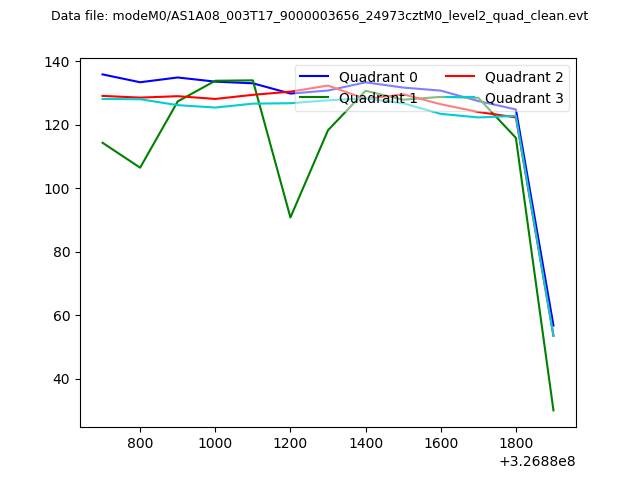 |
|
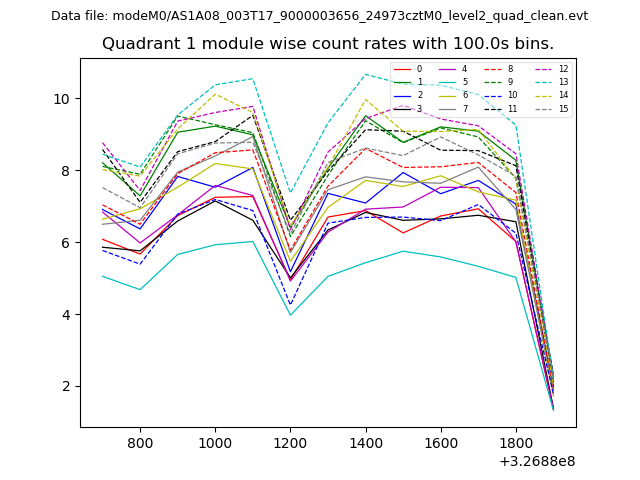
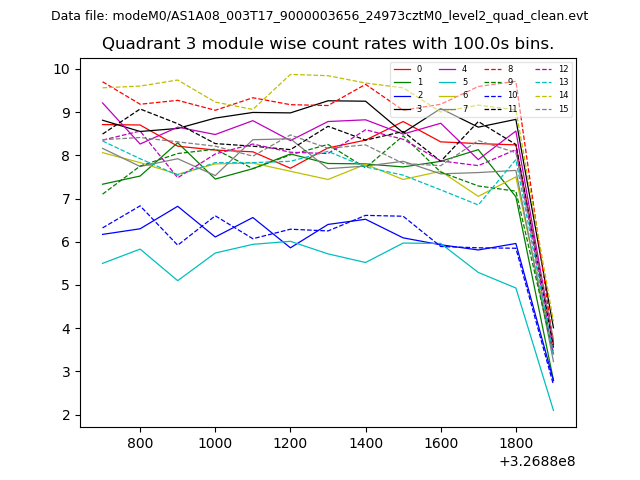
| Module-wise count rates for Quadrant A Data is divided into 100 sec bins |
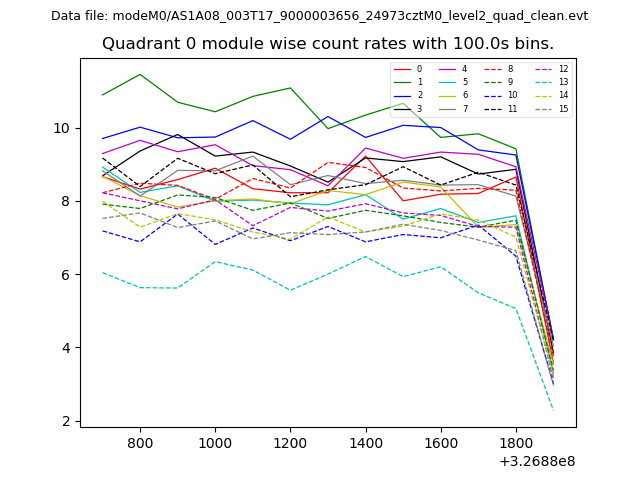 |
 |
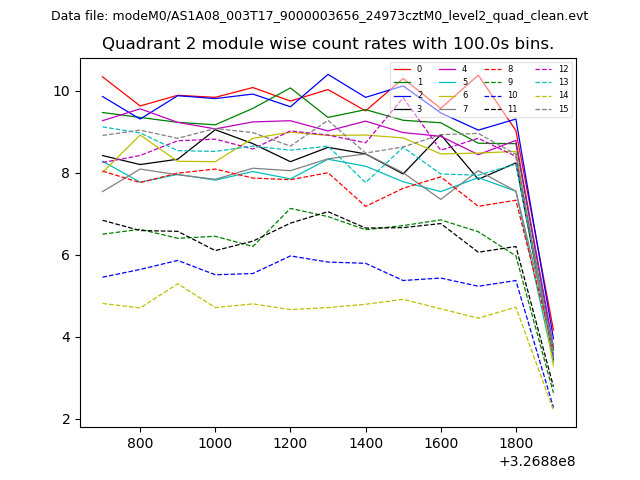
| Module-wise count rates for Quadrant B Data is divided into 100 sec bins |
 |
 |
| Module-wise count rates for Quadrant C Data is divided into 100 sec bins |
 |
 |
| Module-wise count rates for Quadrant D Data is divided into 100 sec bins |
 |
 |
| Parameter | Plot |
|---|---|
| CZT HV Monitor | 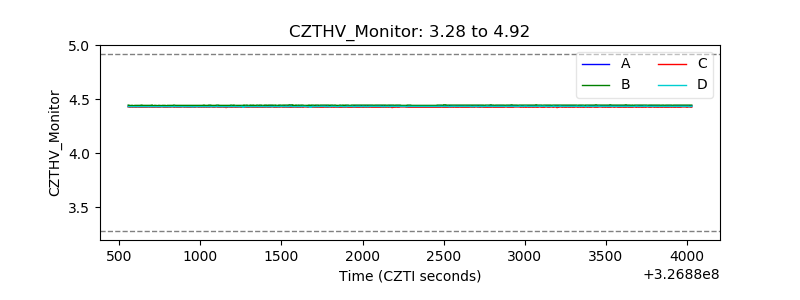 |
| D_VDD | 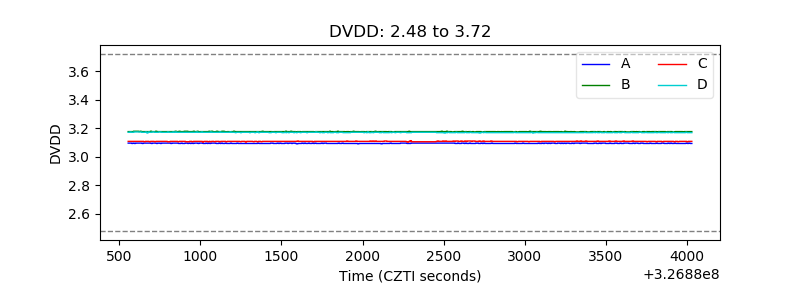 |
| Temperature 1 | 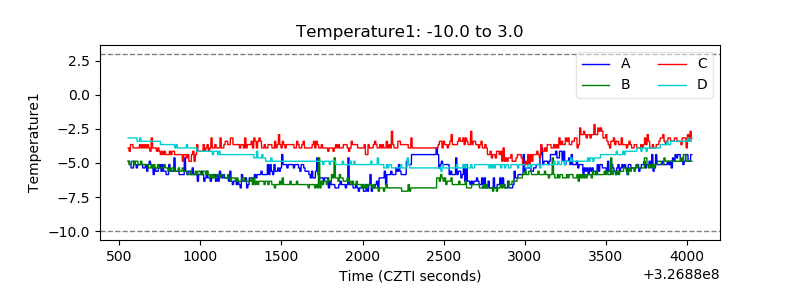 |
| Veto HV Monitor |  |
| Veto LLD | 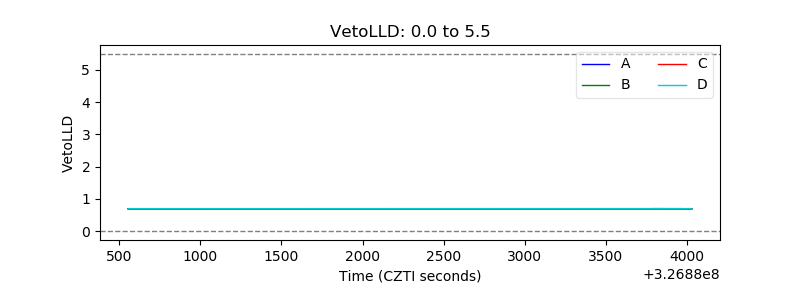 |
| Alpha Counter | 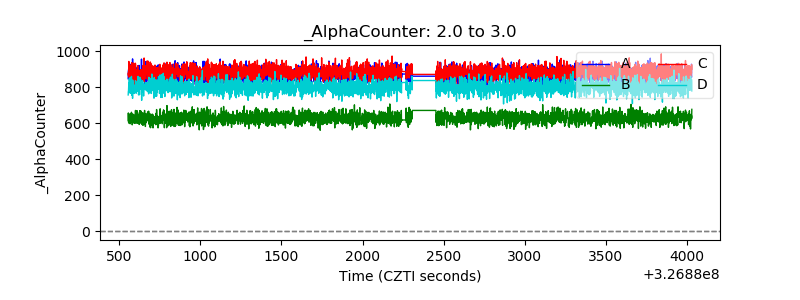 |
| _CPM_Rate | 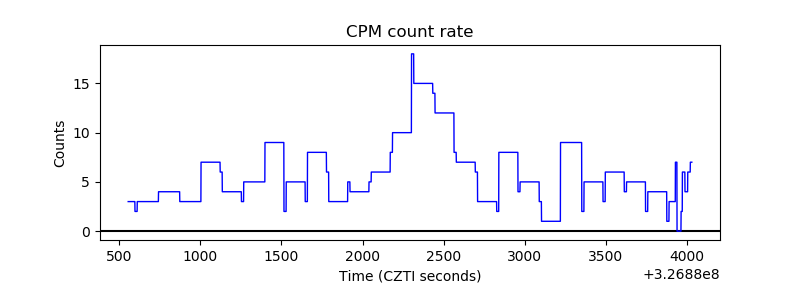 |
| CZT Counter | 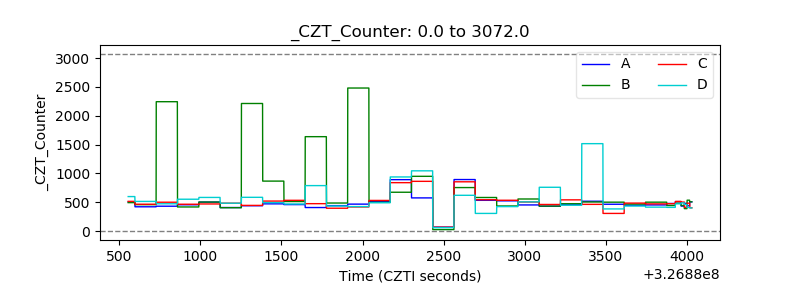 |
| +2.5 Volts monitor | 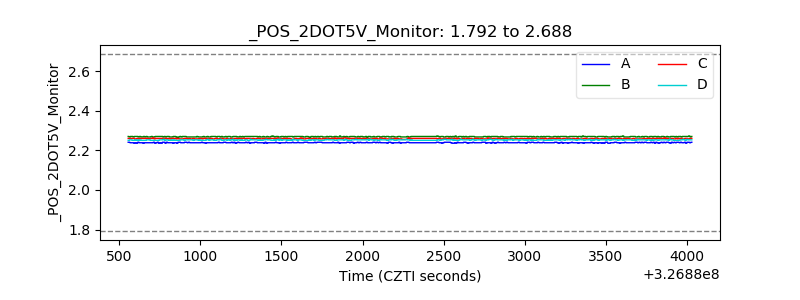 |
| +5 Volts monitor |  |
| _ROLL_ROT | 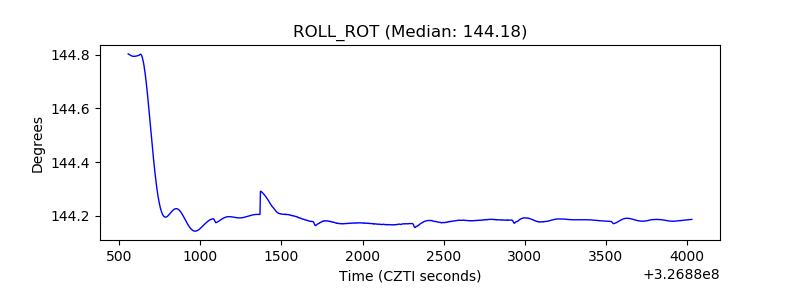 |
| _Roll_DEC | 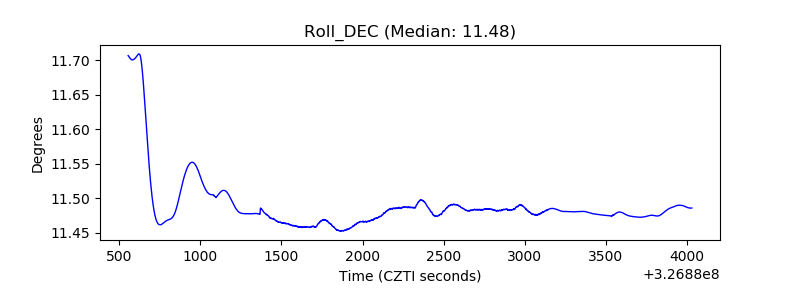 |
| _Roll_RA | 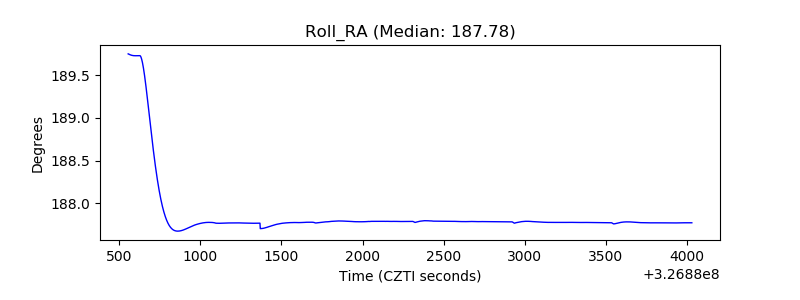 |
| Veto Counter | 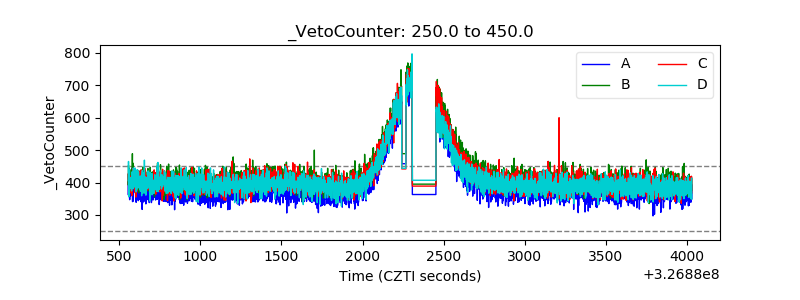 |