| Param | Original file | Final file |
|---|---|---|
| Filename | modeM0/AS1A08_003T17_9000003656_24974cztM0_level2.evt | modeM0/AS1A08_003T17_9000003656_24974cztM0_level2_quad_clean.evt |
| Size (bytes) | 632,076,480 | 91,215,360 |
| Size | 602.8 MB | 87.0 MB |
| Events in quadrant A | 4,249,668 | 555,189 |
| Events in quadrant B | 4,891,126 | 551,634 |
| Events in quadrant C | 4,397,864 | 533,209 |
| Events in quadrant D | 5,017,587 | 522,286 |
| Mode M0 | |||
|---|---|---|---|
| Quadrant | BADHDUFLAG | Total packets | Discarded packets |
| A | 0 | 18117 | 3 |
| B | 0 | 19940 | 3 |
| C | 0 | 18473 | 3 |
| D | 0 | 20594 | 3 |
| Mode SS | |||
|---|---|---|---|
| Quadrant | BADHDUFLAG | Total packets | Discarded packets |
| A | 0 | 178 | 0 |
| B | 0 | 178 | 0 |
| C | 0 | 178 | 0 |
| D | 0 | 178 | 0 |
| Mode M9 | |||
|---|---|---|---|
| Quadrant | BADHDUFLAG | Total packets | Discarded packets |
| A | 0 | 2 | 0 |
| B | 0 | 2 | 0 |
| C | 0 | 2 | 0 |
| D | 0 | 2 | 0 |
| Quadrant | Total seconds | Saturated seconds | Saturation percentage |
|---|---|---|---|
| A | 8633 | 396 | 4.587050% |
| B | 8633 | 601 | 6.961659% |
| C | 8633 | 415 | 4.807135% |
| D | 8634 | 409 | 4.737086% |
Noise dominated data is calculated using 1-second bins in cleaned event files. If a bin has >2000 counts, and if more than 50% of those come from <1% of pixels, then it is considered to be noise-dominated and hence unusable.
| Quadrant | # 1 sec bins | Bins with >0 counts | Bins with >2000 counts | High rate bins dominated by noise | Noise dominated (total time) | Noise dominated (detector-on time) | Marked lightcurve |
|---|---|---|---|---|---|---|---|
| A | 8878 | 8636 | 4 | 4 | 0.05% | 0.05% | 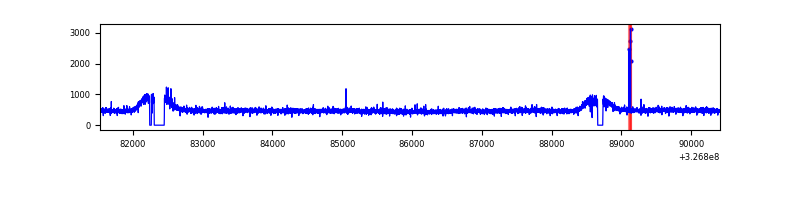 |
| B | 8878 | 8636 | 100 | 100 | 1.13% | 1.16% | 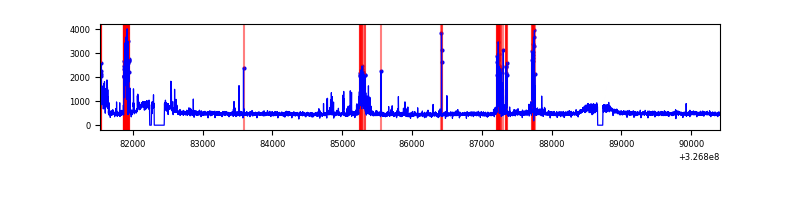 |
| C | 8878 | 8636 | 1 | 1 | 0.01% | 0.01% |  |
| D | 8879 | 8637 | 91 | 91 | 1.02% | 1.05% | 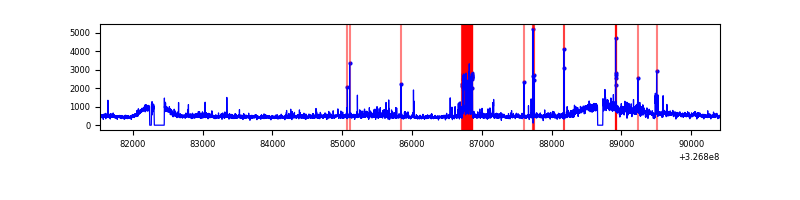 |
Top three noisy pixels from each quadrant. If the there are fewer than three noisy pixels in the level2.evt file, extra rows are filled as -1
| Pixel properties | Quadrant properties | ||||||
|---|---|---|---|---|---|---|---|
| Quadrant | DetID | PixID | Counts | Sigma | Mean | Median | Sigma |
| A | 6 | 16 | 23763 | 101.41 | 1096 | 1069 | 223.8 |
| A | 13 | 254 | 12605 | 51.55 | 1096 | 1069 | 223.8 |
| A | 3 | 137 | 10592 | 42.55 | 1096 | 1069 | 223.8 |
| B | 3 | 64 | 379712 | 1783.34 | 1079 | 1049 | 212.3 |
| B | 10 | 246 | 159703 | 747.19 | 1079 | 1049 | 212.3 |
| B | 15 | 32 | 65519 | 303.63 | 1079 | 1049 | 212.3 |
| C | 14 | 238 | 163876 | 652.38 | 1048 | 1049 | 249.6 |
| C | 7 | 247 | 134113 | 533.13 | 1048 | 1049 | 249.6 |
| C | 3 | 233 | 7556 | 26.07 | 1048 | 1049 | 249.6 |
| D | 8 | 195 | 311934 | 1187.93 | 1059 | 1026 | 261.7 |
| D | 7 | 238 | 289569 | 1102.47 | 1059 | 1026 | 261.7 |
| D | 1 | 52 | 289318 | 1101.52 | 1059 | 1026 | 261.7 |
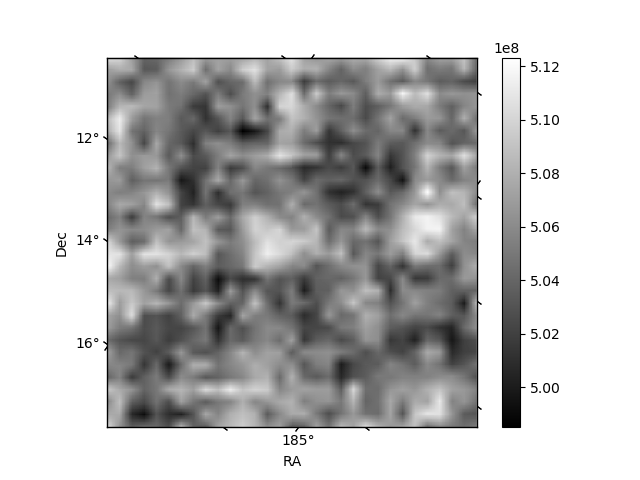
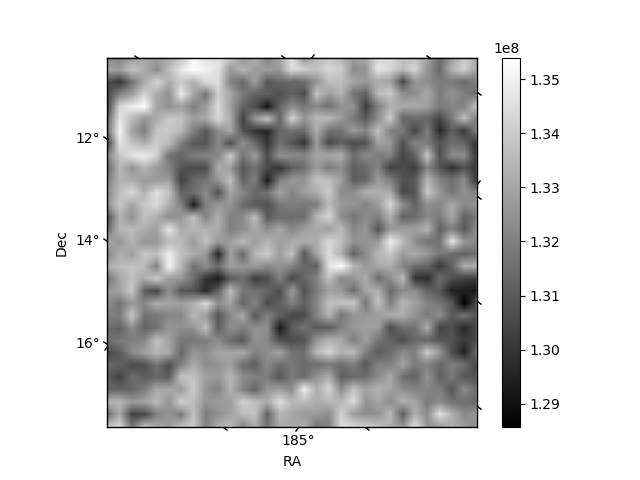
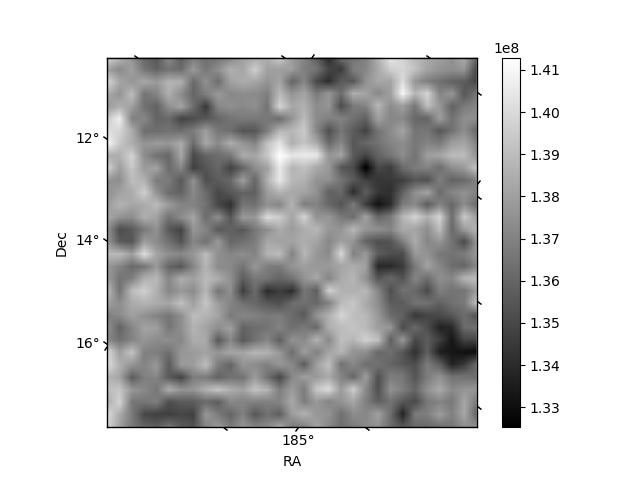
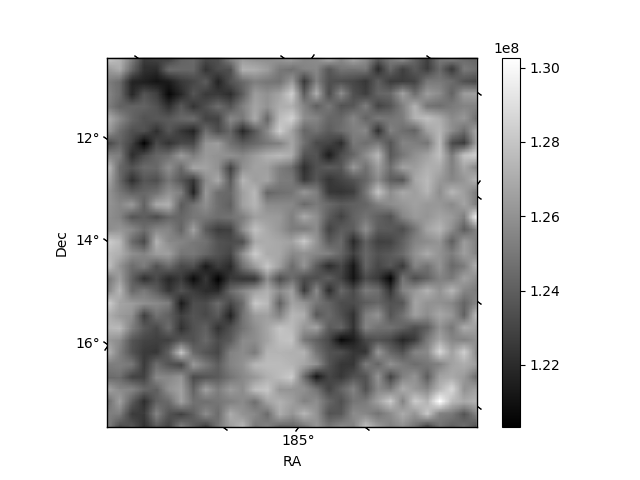
Histogram calculated using DETX and DETY for each event in the final _common_clean file
| Quadrant A | 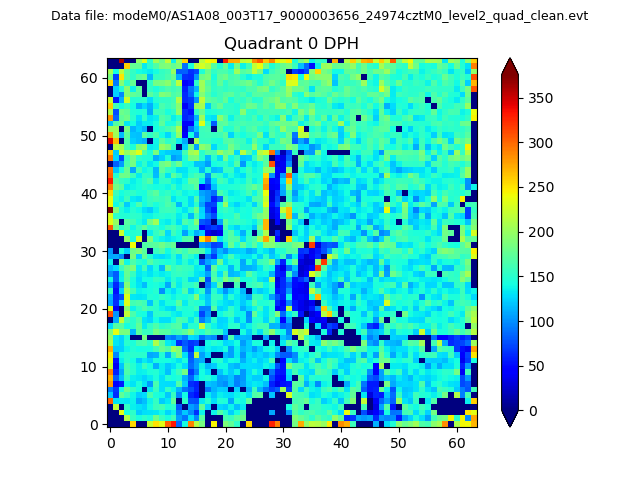 |
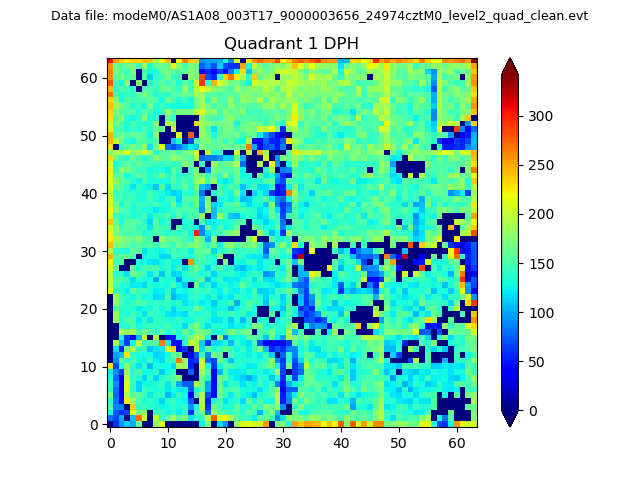 |
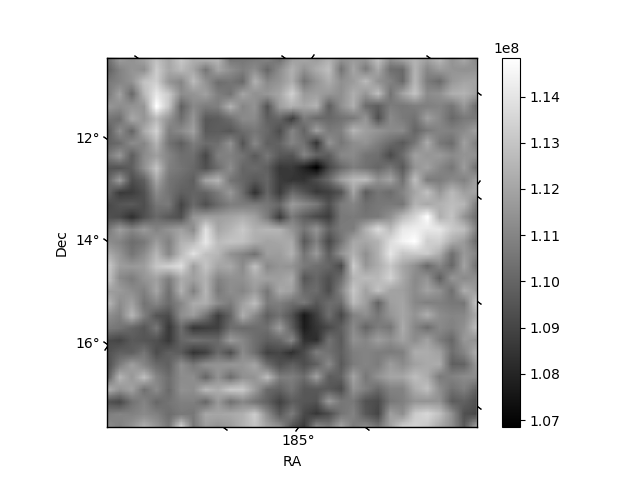
Quadrant B |
|---|---|---|---|
| Quadrant D | 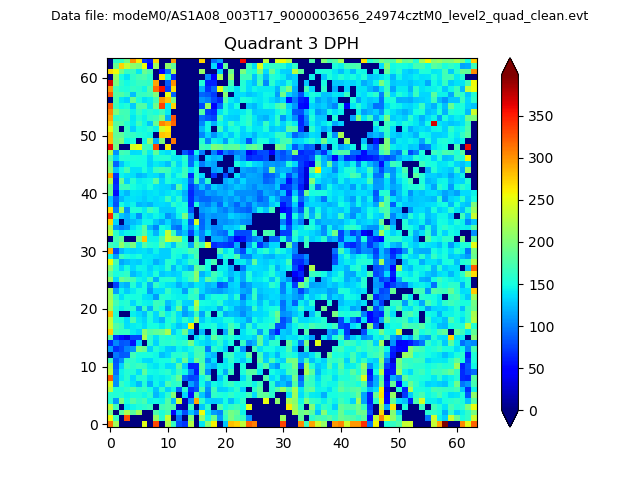 |
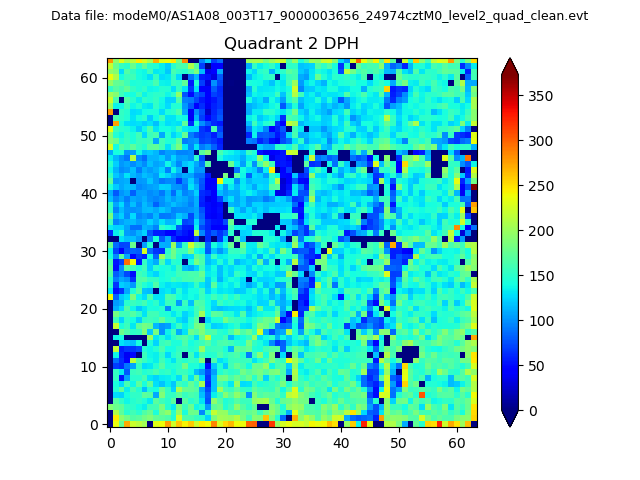 |
Quadrant C |
| Plot type | Count rate plots | Images |
|---|---|---|
| Comparison with Poisson distribution Blue bars denote a histogram of data divided into 1 sec bins. Red curve is a Poisson curve with rate = median count rate of data. |
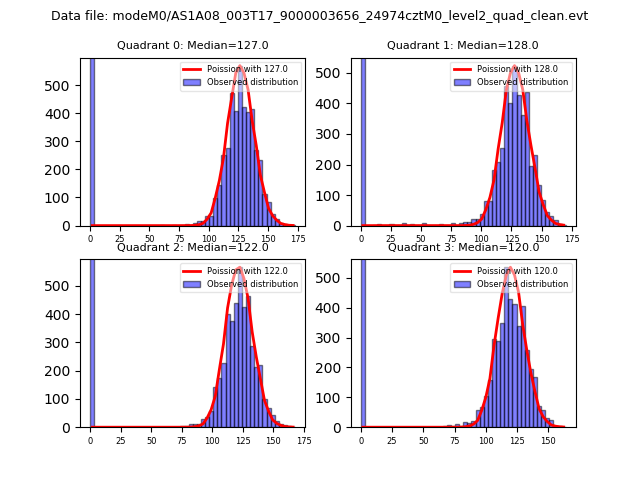 |
 |
| Quadrant-wise count rates Data is divided into 100 sec bins |
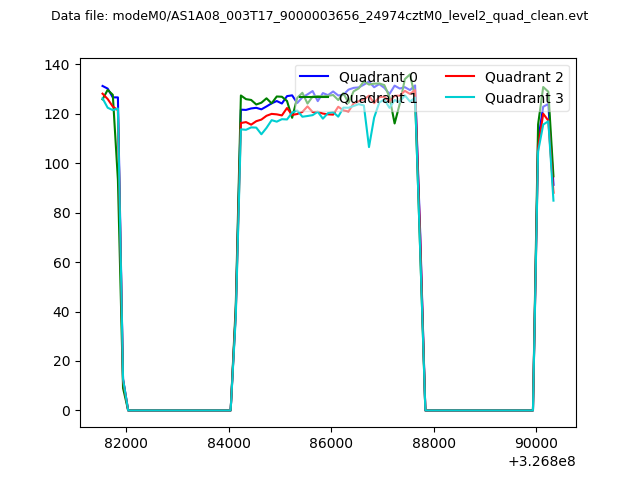 |
|
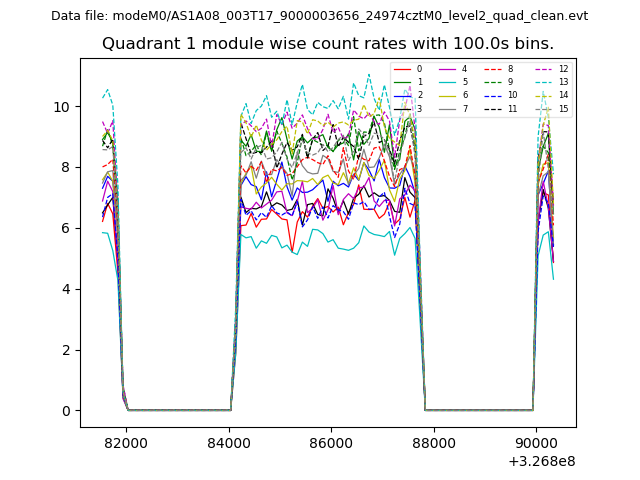
| Module-wise count rates for Quadrant A Data is divided into 100 sec bins |
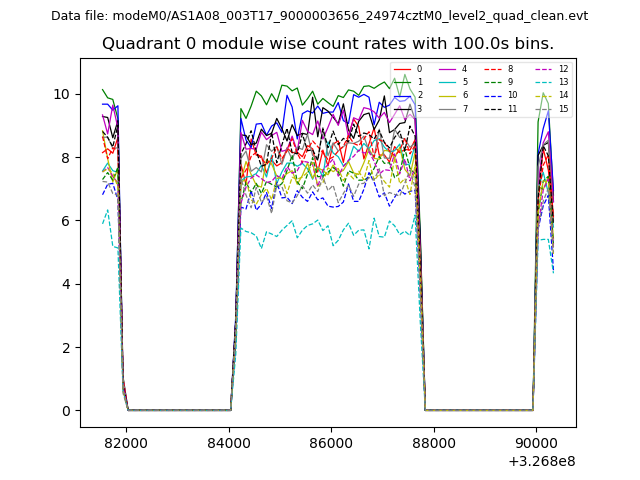 |
 |
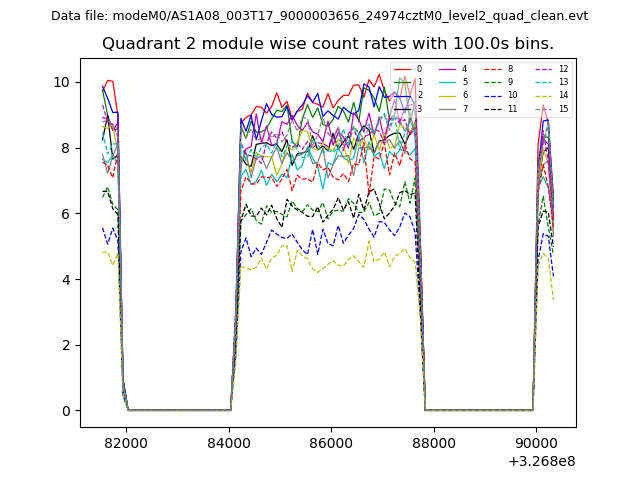
| Module-wise count rates for Quadrant B Data is divided into 100 sec bins |
 |
 |
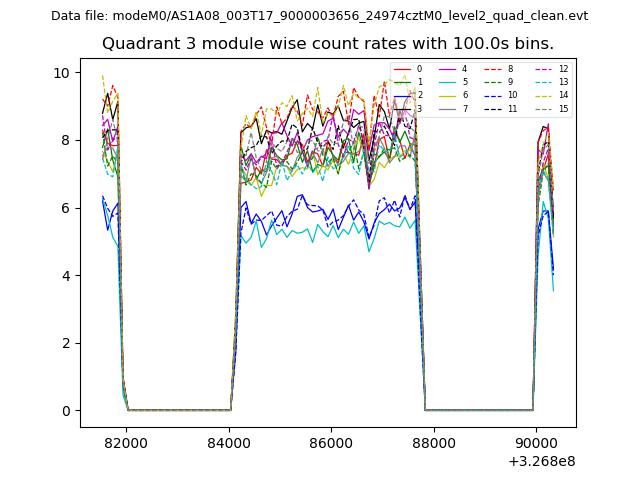
| Module-wise count rates for Quadrant C Data is divided into 100 sec bins |
 |
 |
| Module-wise count rates for Quadrant D Data is divided into 100 sec bins |
 |
 |
| Parameter | Plot |
|---|---|
| CZT HV Monitor | 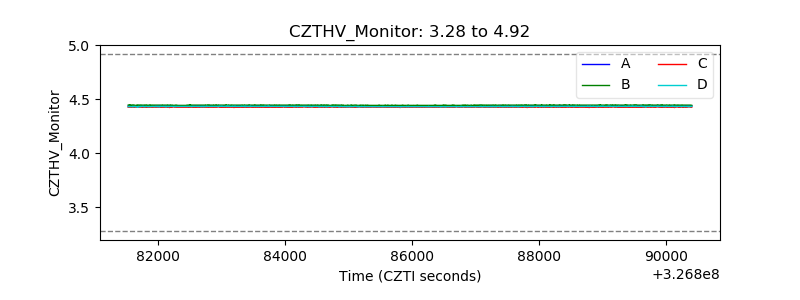 |
| D_VDD | 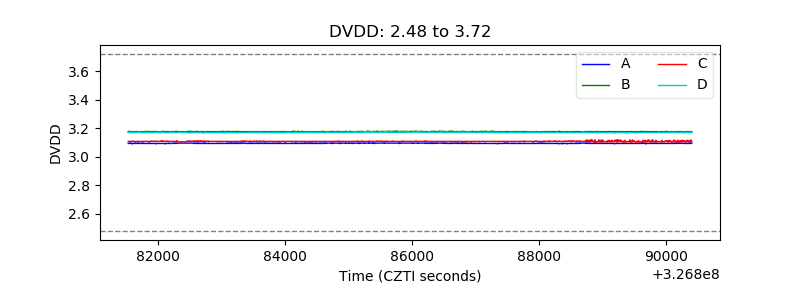 |
| Temperature 1 | 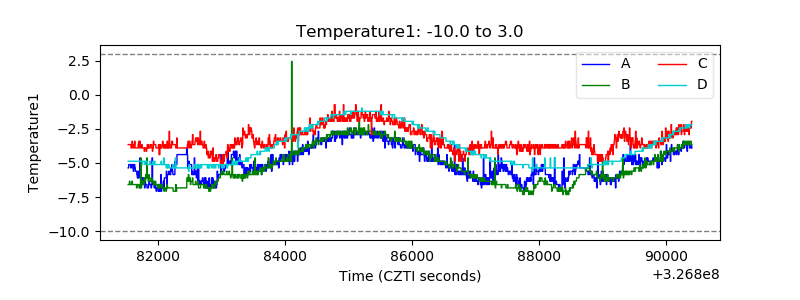 |
| Veto HV Monitor | 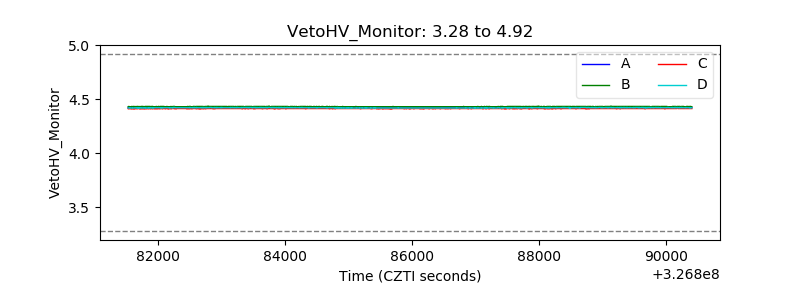 |
| Veto LLD | 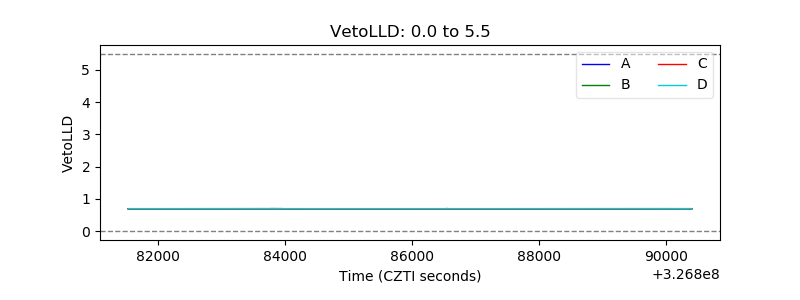 |
| Alpha Counter | 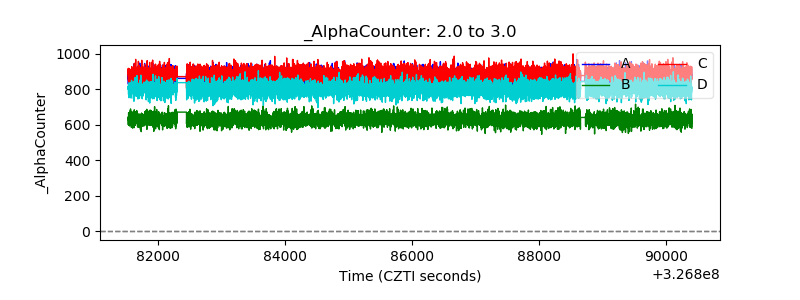 |
| _CPM_Rate | 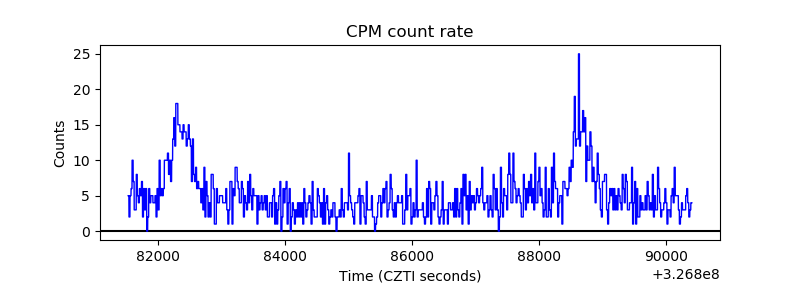 |
| CZT Counter |  |
| +2.5 Volts monitor |  |
| +5 Volts monitor |  |
| _ROLL_ROT | 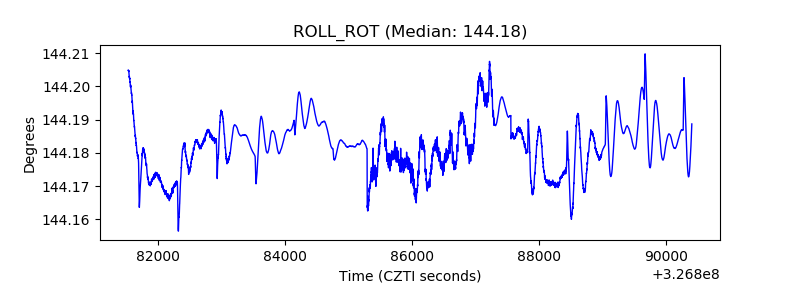 |
| _Roll_DEC | 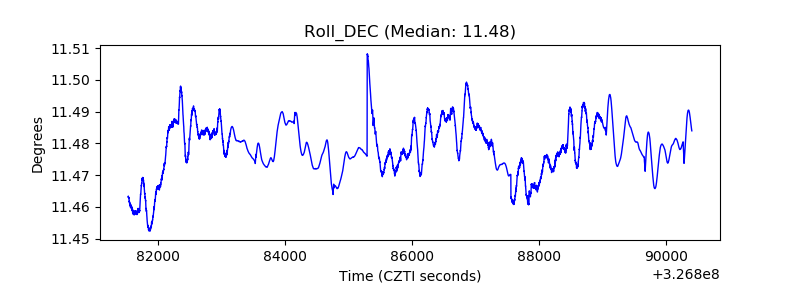 |
| _Roll_RA |  |
| Veto Counter | 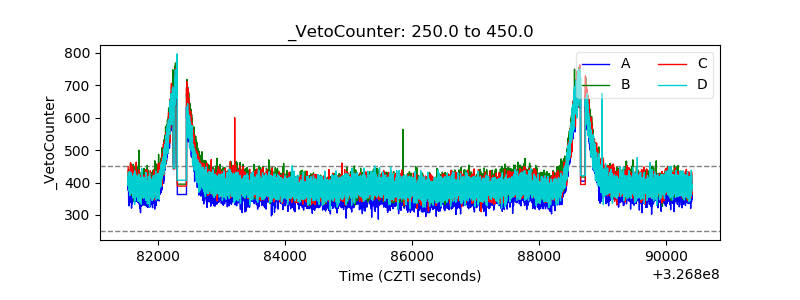 |