| Param | Original file | Final file |
|---|---|---|
| Filename | modeM0/AS1A08_003T17_9000003656_24975cztM0_level2.evt | modeM0/AS1A08_003T17_9000003656_24975cztM0_level2_quad_clean.evt |
| Size (bytes) | 512,392,320 | 74,073,600 |
| Size | 488.7 MB | 70.6 MB |
| Events in quadrant A | 3,366,201 | 448,308 |
| Events in quadrant B | 3,419,522 | 455,020 |
| Events in quadrant C | 3,828,730 | 428,743 |
| Events in quadrant D | 4,429,577 | 425,225 |
| Mode M0 | |||
|---|---|---|---|
| Quadrant | BADHDUFLAG | Total packets | Discarded packets |
| A | 0 | 14557 | 2 |
| B | 0 | 14627 | 2 |
| C | 0 | 15761 | 2 |
| D | 0 | 17765 | 3 |
| Mode SS | |||
|---|---|---|---|
| Quadrant | BADHDUFLAG | Total packets | Discarded packets |
| A | 0 | 144 | 0 |
| B | 0 | 144 | 0 |
| C | 0 | 144 | 0 |
| D | 0 | 144 | 0 |
| Mode M9 | |||
|---|---|---|---|
| Quadrant | BADHDUFLAG | Total packets | Discarded packets |
| A | 0 | 5 | 0 |
| B | 0 | 5 | 0 |
| C | 0 | 5 | 0 |
| D | 0 | 5 | 0 |
| Quadrant | Total seconds | Saturated seconds | Saturation percentage |
|---|---|---|---|
| A | 6969 | 309 | 4.433922% |
| B | 6970 | 324 | 4.648494% |
| C | 6970 | 354 | 5.078910% |
| D | 6969 | 318 | 4.563065% |
Noise dominated data is calculated using 1-second bins in cleaned event files. If a bin has >2000 counts, and if more than 50% of those come from <1% of pixels, then it is considered to be noise-dominated and hence unusable.
| Quadrant | # 1 sec bins | Bins with >0 counts | Bins with >2000 counts | High rate bins dominated by noise | Noise dominated (total time) | Noise dominated (detector-on time) | Marked lightcurve |
|---|---|---|---|---|---|---|---|
| A | 7429 | 6971 | 4 | 4 | 0.05% | 0.06% | 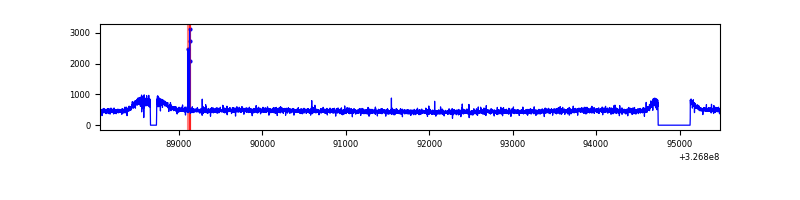 |
| B | 7430 | 6972 | 2 | 2 | 0.03% | 0.03% | 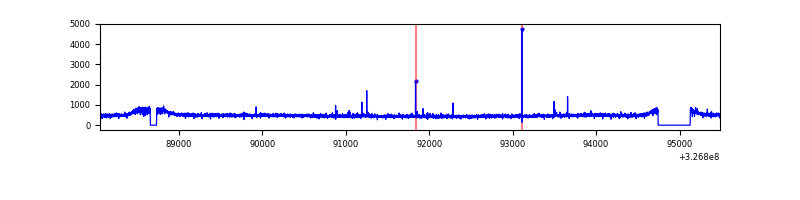 |
| C | 7430 | 6972 | 21 | 21 | 0.28% | 0.30% | 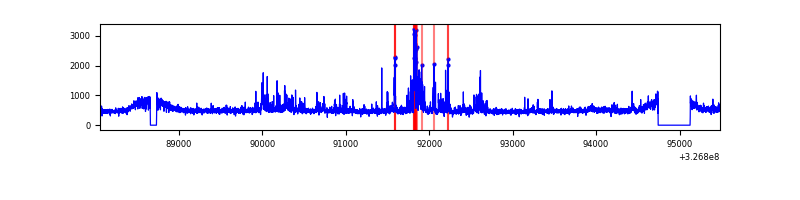 |
| D | 7429 | 6971 | 23 | 23 | 0.31% | 0.33% | 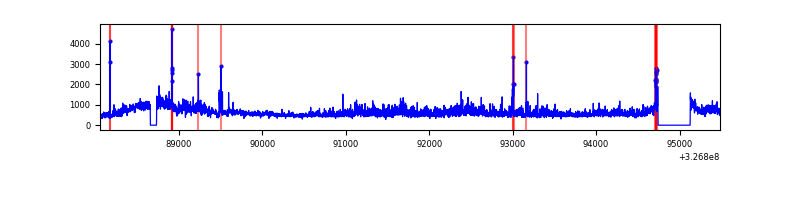 |
Top three noisy pixels from each quadrant. If the there are fewer than three noisy pixels in the level2.evt file, extra rows are filled as -1
| Pixel properties | Quadrant properties | ||||||
|---|---|---|---|---|---|---|---|
| Quadrant | DetID | PixID | Counts | Sigma | Mean | Median | Sigma |
| A | 6 | 16 | 14447 | 76.47 | 869 | 847 | 177.8 |
| A | 13 | 254 | 10251 | 52.87 | 869 | 847 | 177.8 |
| A | 3 | 137 | 8446 | 42.72 | 869 | 847 | 177.8 |
| B | 12 | 111 | 21111 | 120.1 | 862 | 837 | 168.8 |
| B | 11 | 111 | 19287 | 109.3 | 862 | 837 | 168.8 |
| B | 14 | 111 | 17359 | 97.88 | 862 | 837 | 168.8 |
| C | 7 | 247 | 428238 | 2182.93 | 831 | 835 | 195.8 |
| C | 14 | 238 | 128770 | 653.42 | 831 | 835 | 195.8 |
| C | 8 | 128 | 12399 | 59.06 | 831 | 835 | 195.8 |
| D | 8 | 195 | 730737 | 3523.81 | 839 | 810 | 207.1 |
| D | 7 | 238 | 344864 | 1660.96 | 839 | 810 | 207.1 |
| D | 1 | 52 | 113093 | 542.06 | 839 | 810 | 207.1 |
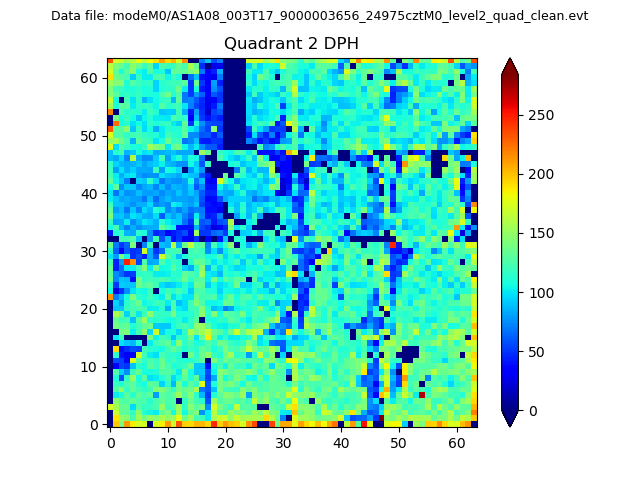
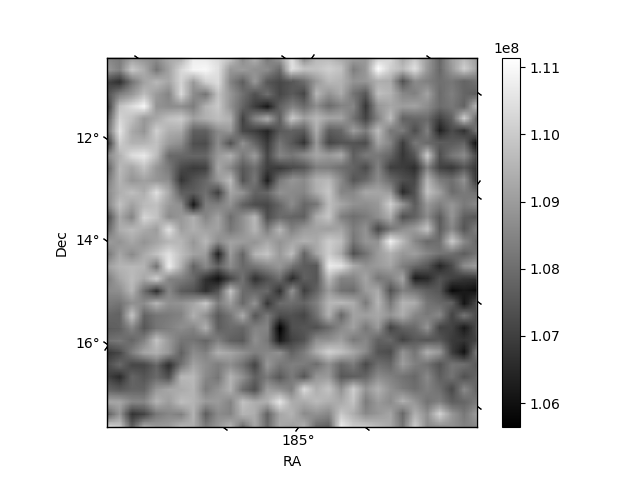
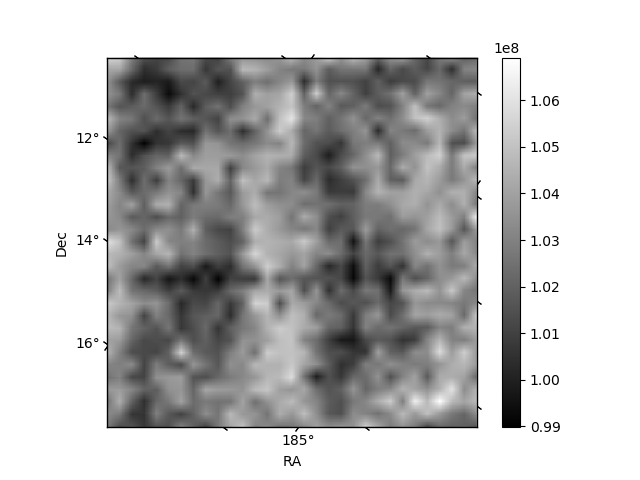
Histogram calculated using DETX and DETY for each event in the final _common_clean file
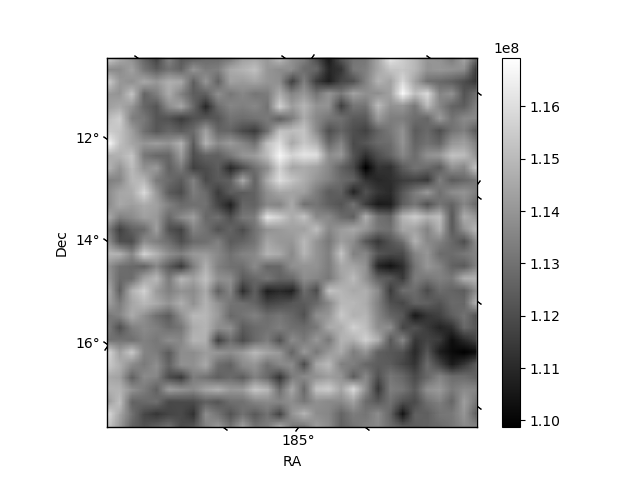
| Quadrant A | 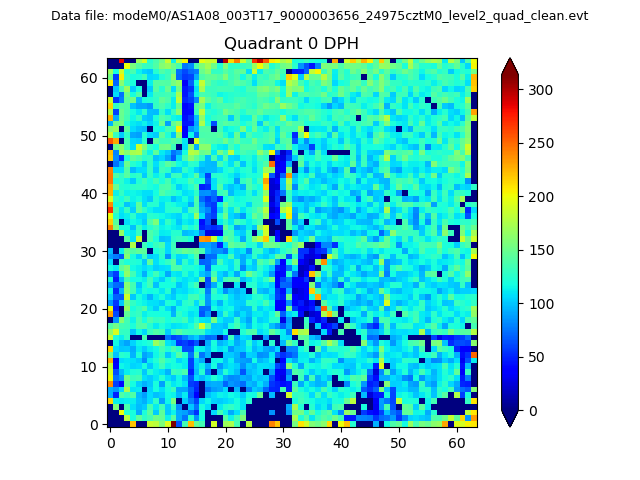 |
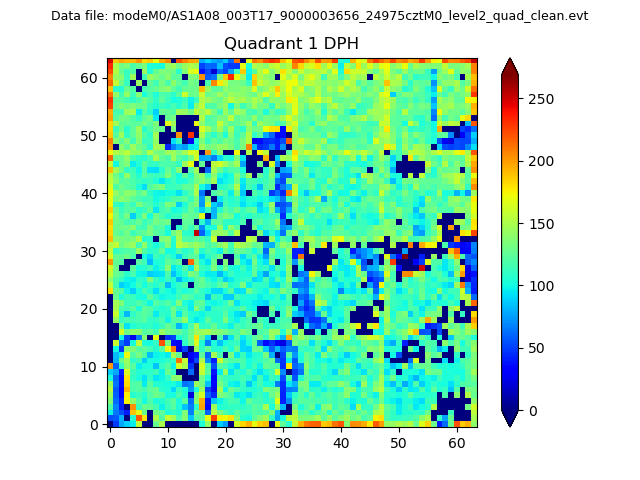 |
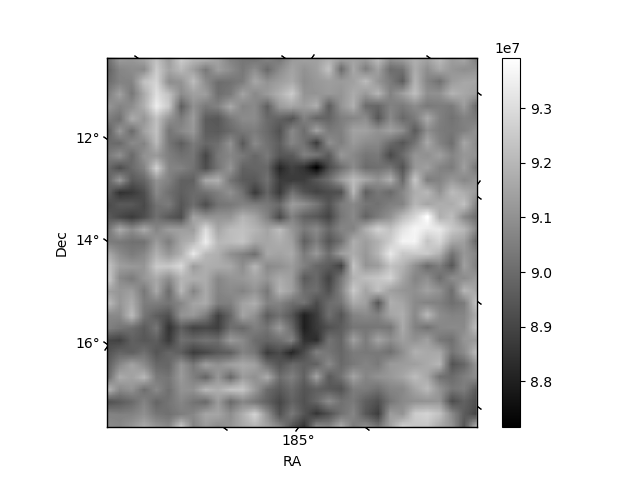
Quadrant B |
|---|---|---|---|
| Quadrant D | 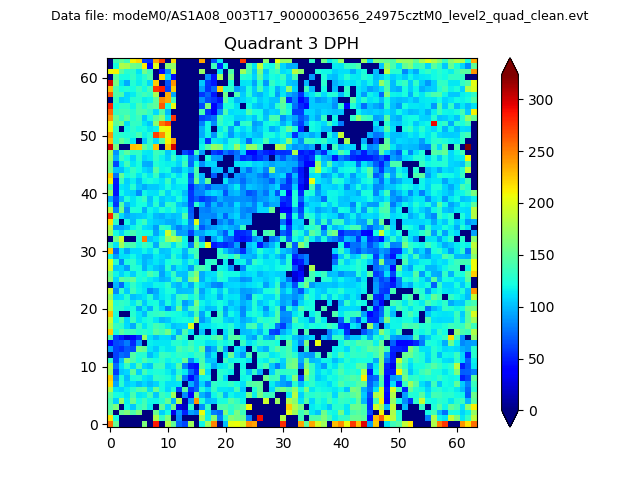 |
 |
Quadrant C |
| Plot type | Count rate plots | Images |
|---|---|---|
| Comparison with Poisson distribution Blue bars denote a histogram of data divided into 1 sec bins. Red curve is a Poisson curve with rate = median count rate of data. |
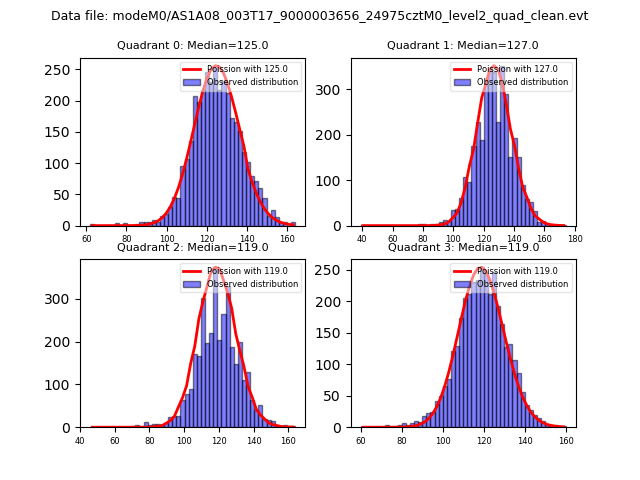 |
 |
| Quadrant-wise count rates Data is divided into 100 sec bins |
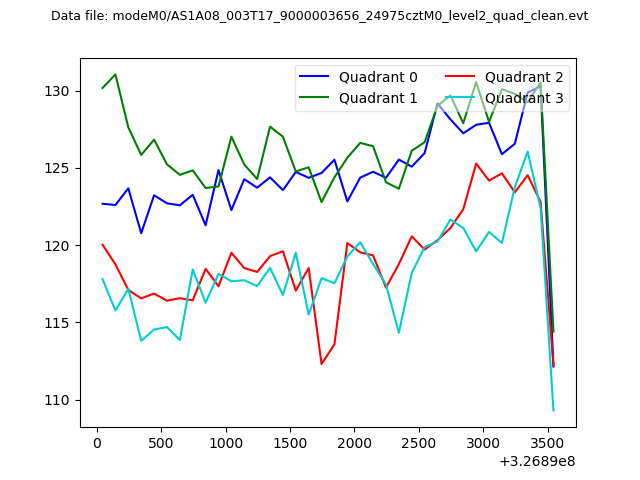 |
|
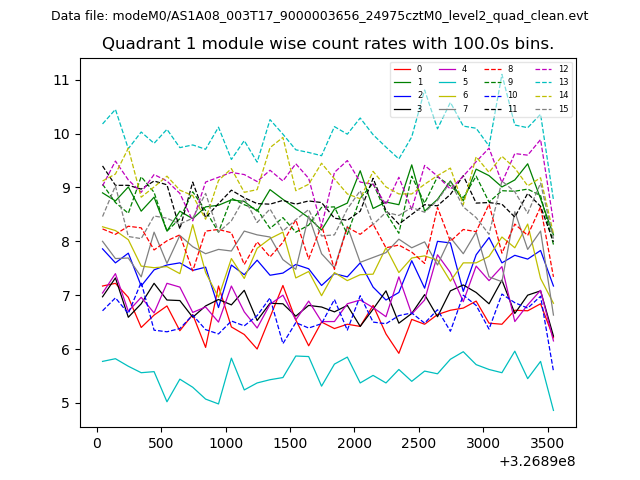
| Module-wise count rates for Quadrant A Data is divided into 100 sec bins |
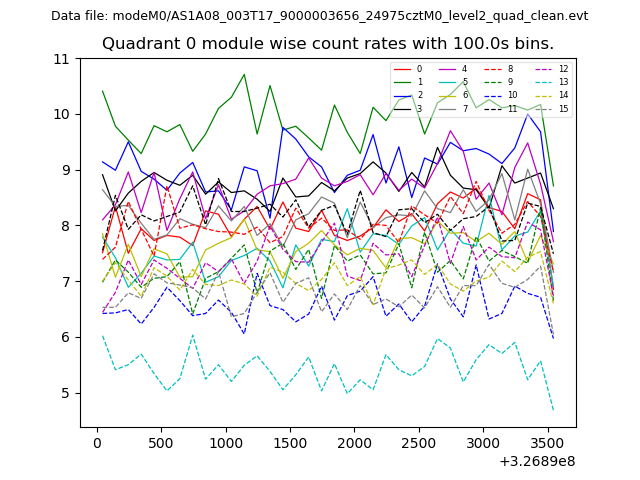 |
 |
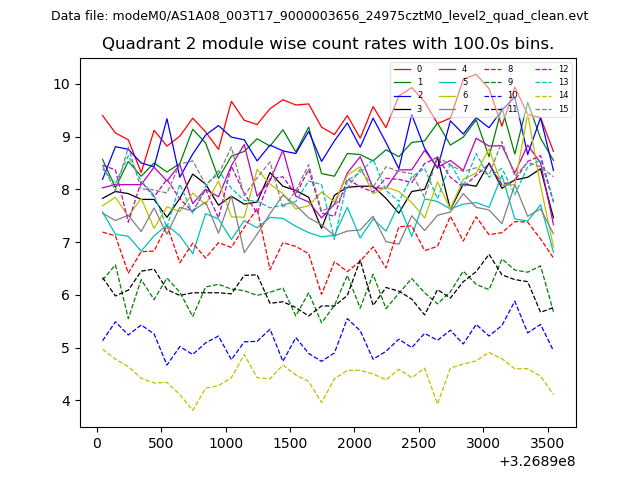
| Module-wise count rates for Quadrant B Data is divided into 100 sec bins |
 |
 |
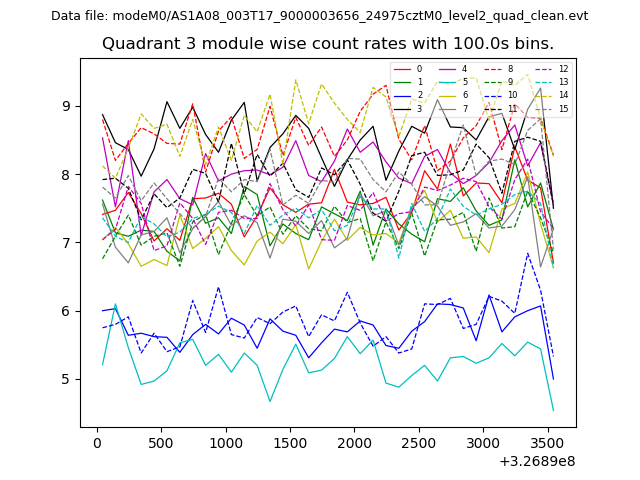
| Module-wise count rates for Quadrant C Data is divided into 100 sec bins |
 |
 |
| Module-wise count rates for Quadrant D Data is divided into 100 sec bins |
 |
 |
| Parameter | Plot |
|---|---|
| CZT HV Monitor | 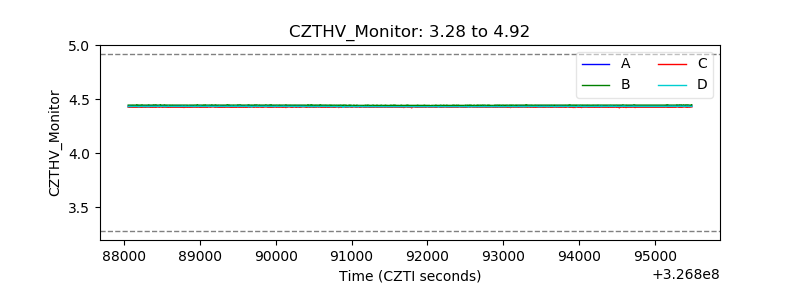 |
| D_VDD | 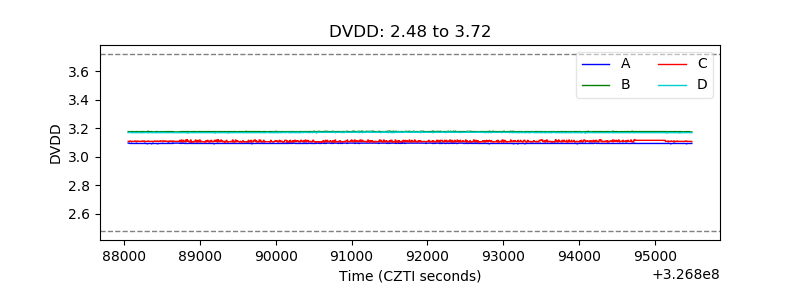 |
| Temperature 1 | 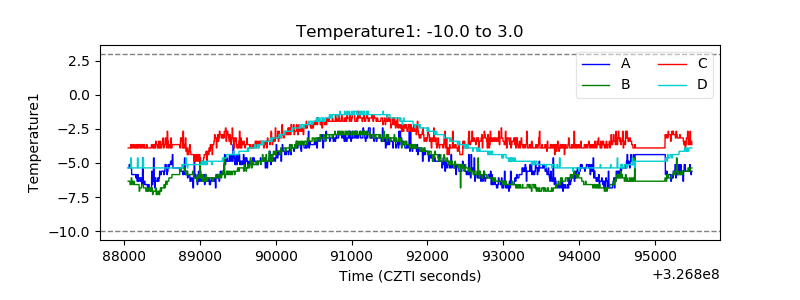 |
| Veto HV Monitor | 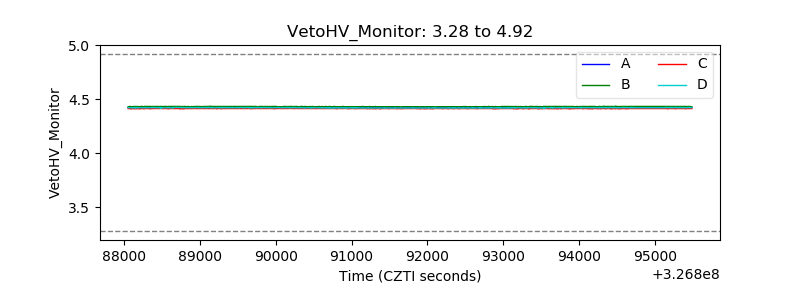 |
| Veto LLD | 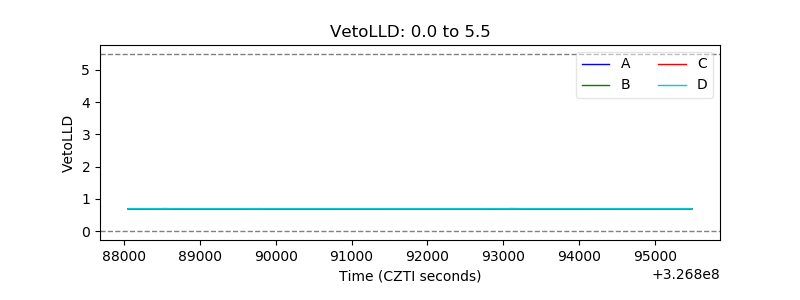 |
| Alpha Counter | 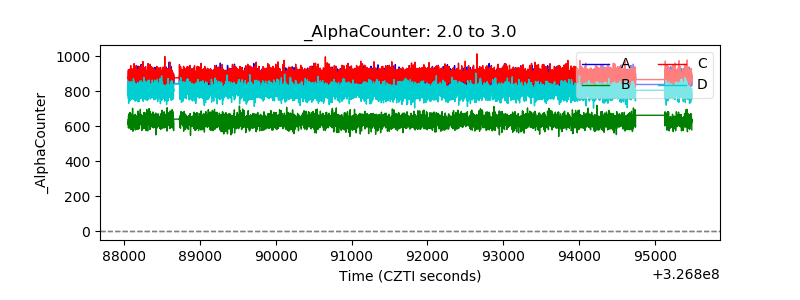 |
| _CPM_Rate | 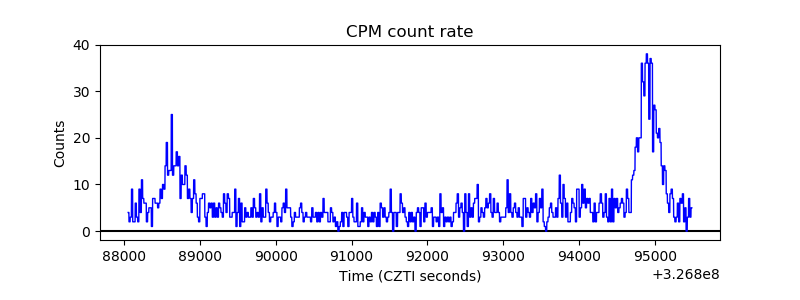 |
| CZT Counter | 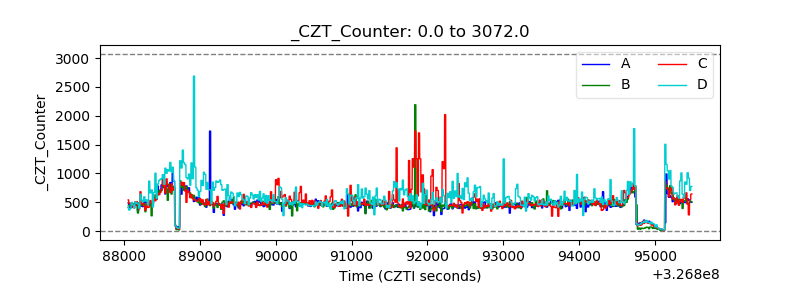 |
| +2.5 Volts monitor |  |
| +5 Volts monitor | 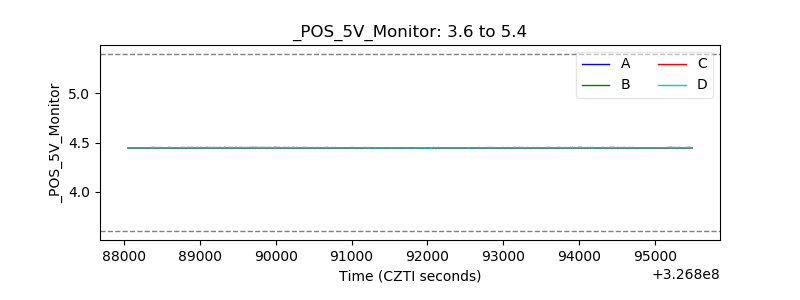 |
| _ROLL_ROT | 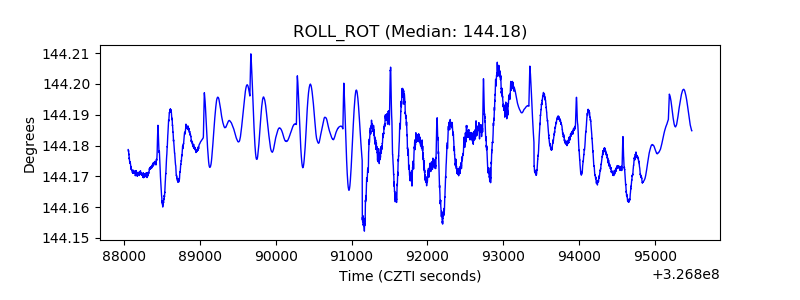 |
| _Roll_DEC | 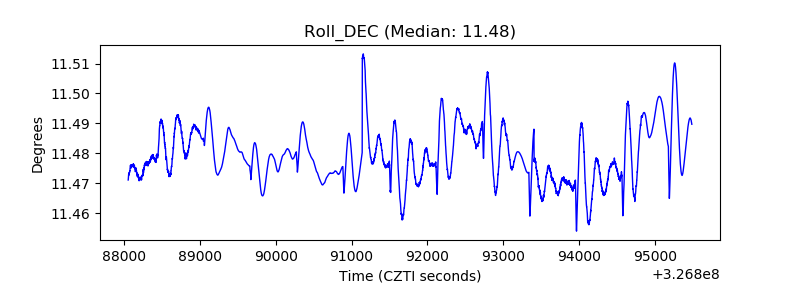 |
| _Roll_RA | 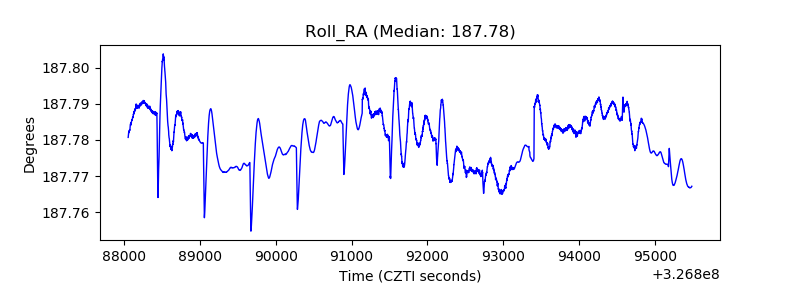 |
| Veto Counter |  |