| Param | Original file | Final file |
|---|---|---|
| Filename | modeM0/AS1A08_003T17_9000003656_24977cztM0_level2.evt | modeM0/AS1A08_003T17_9000003656_24977cztM0_level2_quad_clean.evt |
| Size (bytes) | 893,770,560 | 165,142,080 |
| Size | 852.4 MB | 157.5 MB |
| Events in quadrant A | 5,757,391 | 1,068,898 |
| Events in quadrant B | 6,423,632 | 1,071,519 |
| Events in quadrant C | 6,132,971 | 1,025,934 |
| Events in quadrant D | 7,927,988 | 991,521 |
| Mode M0 | |||
|---|---|---|---|
| Quadrant | BADHDUFLAG | Total packets | Discarded packets |
| A | 0 | 25593 | 529 |
| B | 0 | 27537 | 527 |
| C | 0 | 26410 | 533 |
| D | 0 | 32253 | 622 |
| Mode SS | |||
|---|---|---|---|
| Quadrant | BADHDUFLAG | Total packets | Discarded packets |
| A | 0 | 256 | 6 |
| B | 0 | 256 | 6 |
| C | 0 | 256 | 6 |
| D | 0 | 257 | 5 |
| Mode M9 | |||
|---|---|---|---|
| Quadrant | BADHDUFLAG | Total packets | Discarded packets |
| A | 0 | 17 | 0 |
| B | 0 | 18 | 2 |
| C | 0 | 17 | 1 |
| D | 0 | 17 | 1 |
| Quadrant | Total seconds | Saturated seconds | Saturation percentage |
|---|---|---|---|
| A | 12197 | 183 | 1.500369% |
| B | 12200 | 370 | 3.032787% |
| C | 12204 | 260 | 2.130449% |
| D | 12203 | 521 | 4.269442% |
Noise dominated data is calculated using 1-second bins in cleaned event files. If a bin has >2000 counts, and if more than 50% of those come from <1% of pixels, then it is considered to be noise-dominated and hence unusable.
| Quadrant | # 1 sec bins | Bins with >0 counts | Bins with >2000 counts | High rate bins dominated by noise | Noise dominated (total time) | Noise dominated (detector-on time) | Marked lightcurve |
|---|---|---|---|---|---|---|---|
| A | 14870 | 12219 | 1 | 1 | 0.01% | 0.01% | 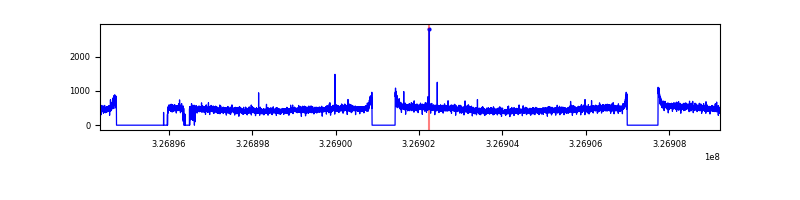 |
| B | 14871 | 12227 | 76 | 76 | 0.51% | 0.62% | 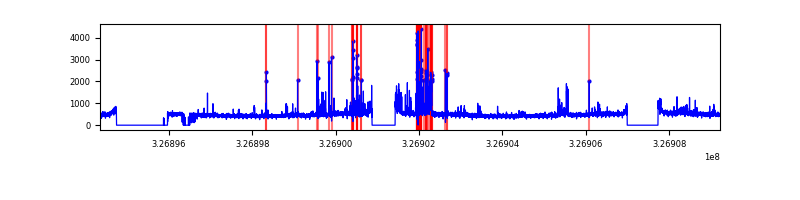 |
| C | 14871 | 12224 | 9 | 9 | 0.06% | 0.07% | 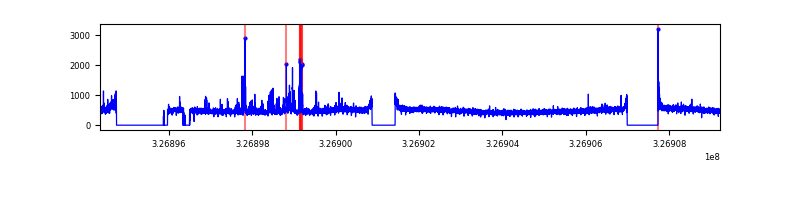 |
| D | 14870 | 12221 | 294 | 294 | 1.98% | 2.41% | 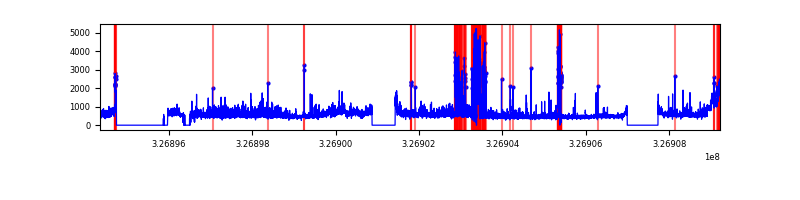 |
Top three noisy pixels from each quadrant. If the there are fewer than three noisy pixels in the level2.evt file, extra rows are filled as -1
| Pixel properties | Quadrant properties | ||||||
|---|---|---|---|---|---|---|---|
| Quadrant | DetID | PixID | Counts | Sigma | Mean | Median | Sigma |
| A | 13 | 254 | 18459 | 56.31 | 1491 | 1454 | 302.0 |
| A | 3 | 137 | 14264 | 42.42 | 1491 | 1454 | 302.0 |
| A | 0 | 226 | 12653 | 37.09 | 1491 | 1454 | 302.0 |
| B | 3 | 64 | 541231 | 1904.93 | 1467 | 1428 | 283.4 |
| B | 10 | 246 | 86277 | 299.43 | 1467 | 1428 | 283.4 |
| B | 12 | 111 | 35951 | 121.83 | 1467 | 1428 | 283.4 |
| C | 7 | 247 | 285532 | 846.31 | 1430 | 1441 | 335.7 |
| C | 14 | 238 | 224117 | 663.36 | 1430 | 1441 | 335.7 |
| C | 8 | 128 | 17028 | 46.43 | 1430 | 1441 | 335.7 |
| D | 1 | 52 | 795362 | 2284.93 | 1428 | 1388 | 347.5 |
| D | 8 | 195 | 790862 | 2271.98 | 1428 | 1388 | 347.5 |
| D | 7 | 238 | 512473 | 1470.82 | 1428 | 1388 | 347.5 |
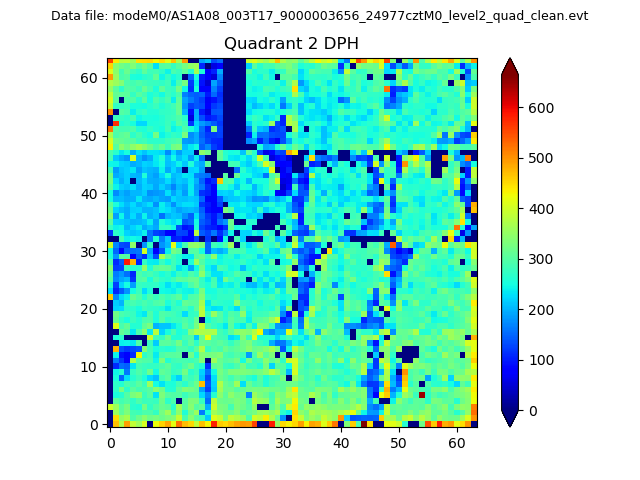
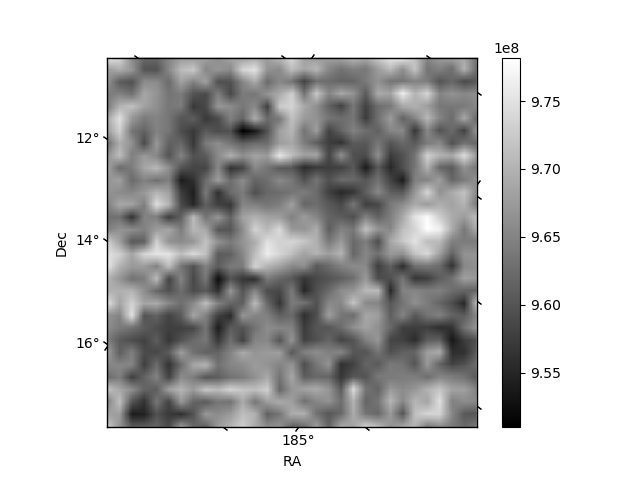
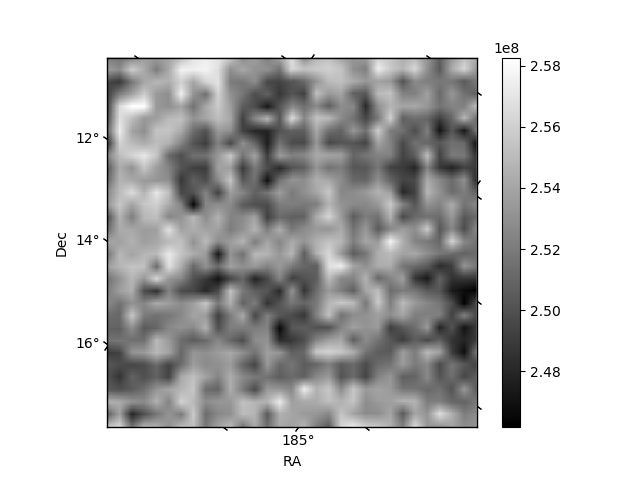
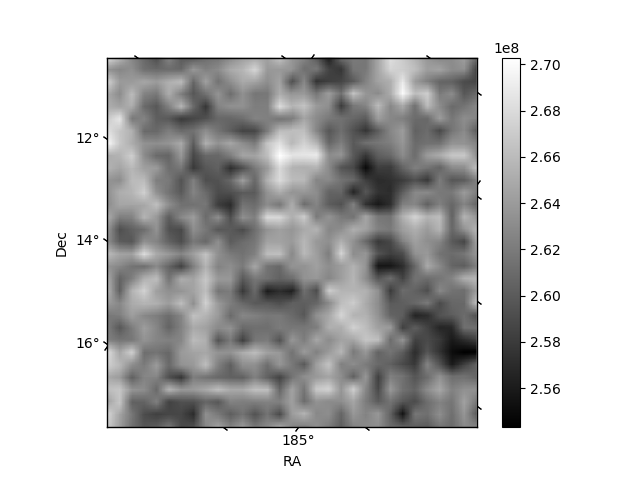
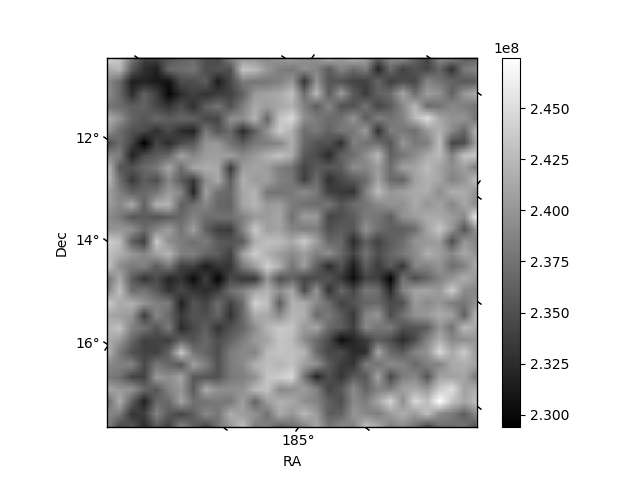
Histogram calculated using DETX and DETY for each event in the final _common_clean file
| Quadrant A | 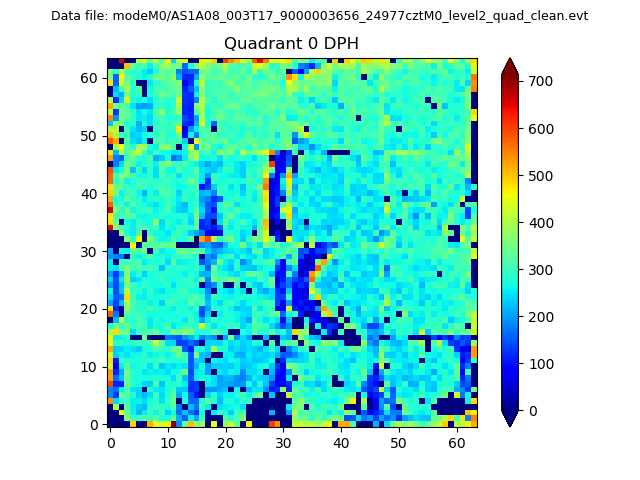 |
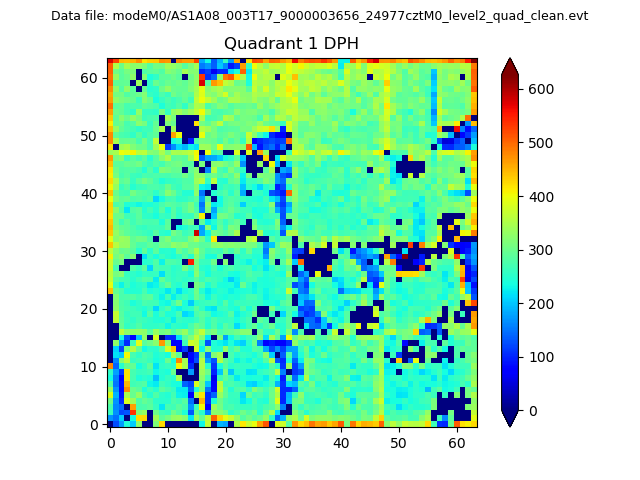 |
Quadrant B |
|---|---|---|---|
| Quadrant D | 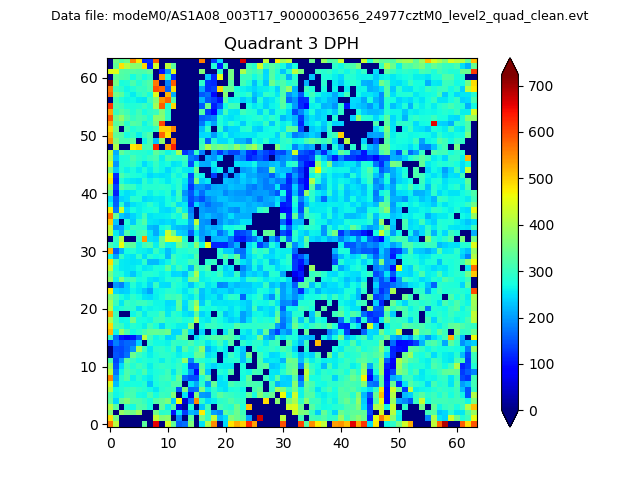 |
 |
Quadrant C |
| Plot type | Count rate plots | Images |
|---|---|---|
| Comparison with Poisson distribution Blue bars denote a histogram of data divided into 1 sec bins. Red curve is a Poisson curve with rate = median count rate of data. |
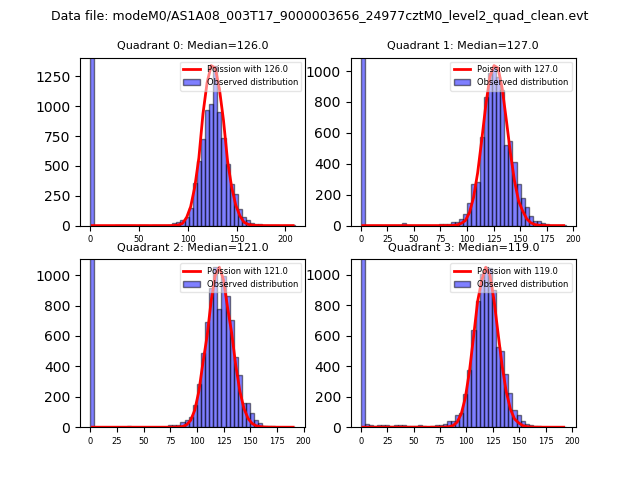 |
 |
| Quadrant-wise count rates Data is divided into 100 sec bins |
 |
|
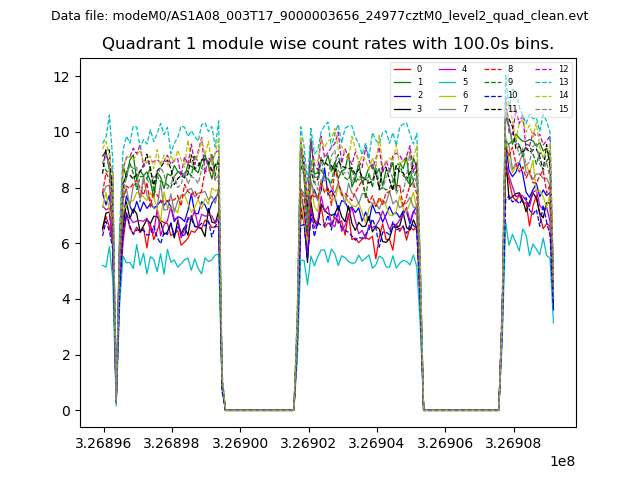
| Module-wise count rates for Quadrant A Data is divided into 100 sec bins |
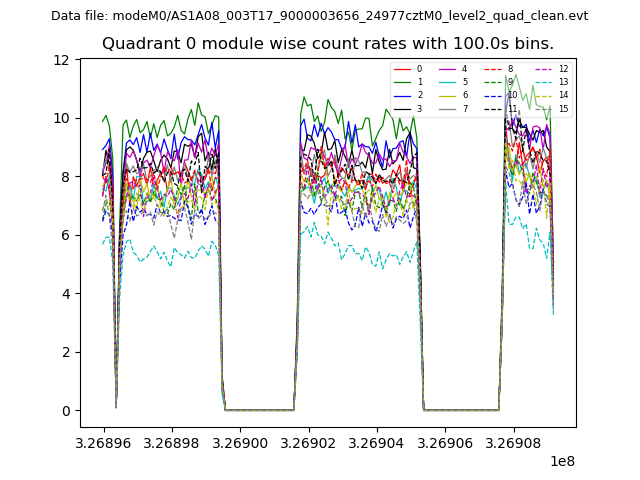 |
 |
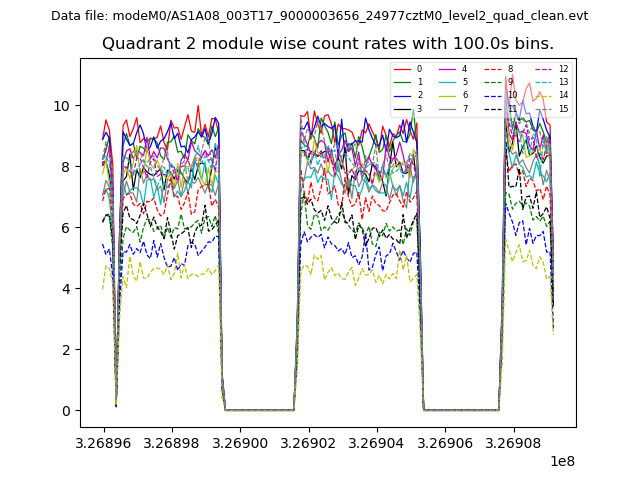
| Module-wise count rates for Quadrant B Data is divided into 100 sec bins |
 |
 |
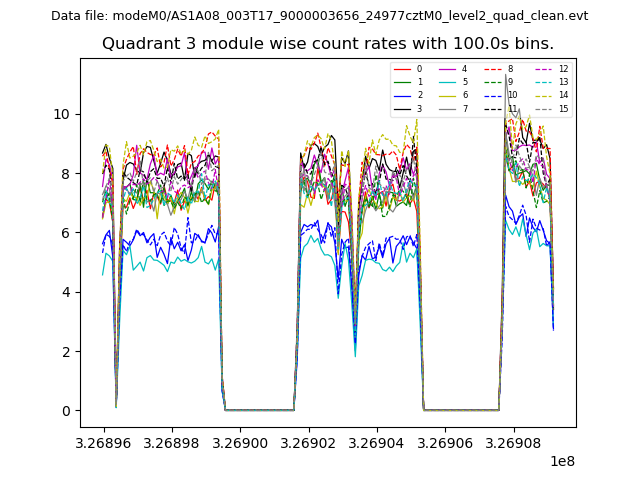
| Module-wise count rates for Quadrant C Data is divided into 100 sec bins |
 |
 |
| Module-wise count rates for Quadrant D Data is divided into 100 sec bins |
 |
 |
| Parameter | Plot |
|---|---|
| CZT HV Monitor | 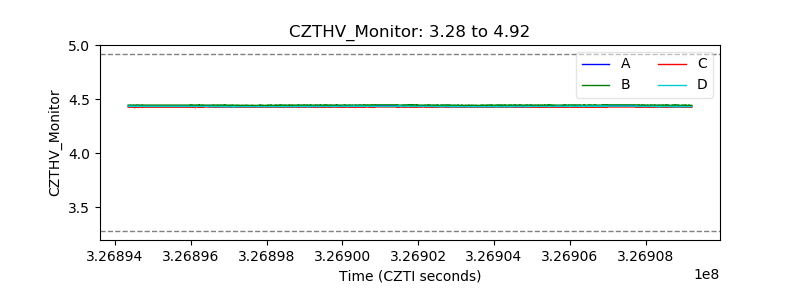 |
| D_VDD | 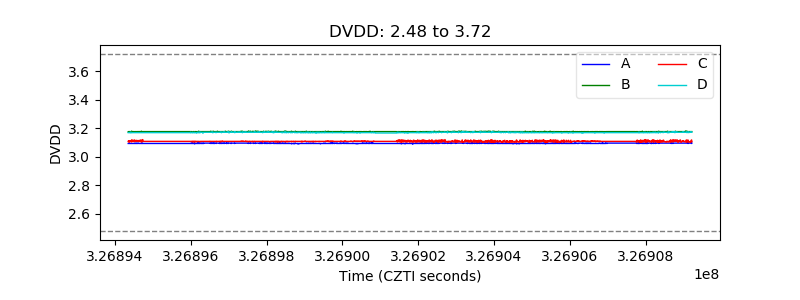 |
| Temperature 1 | 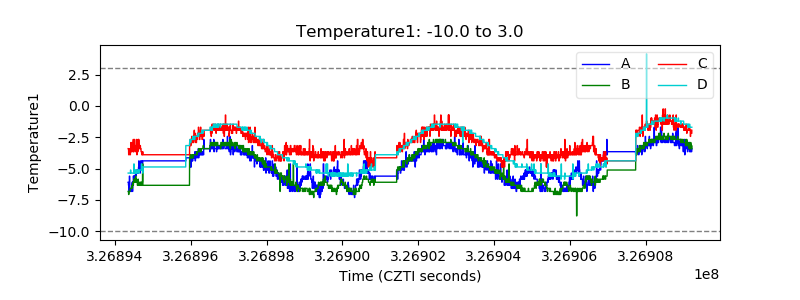 |
| Veto HV Monitor | 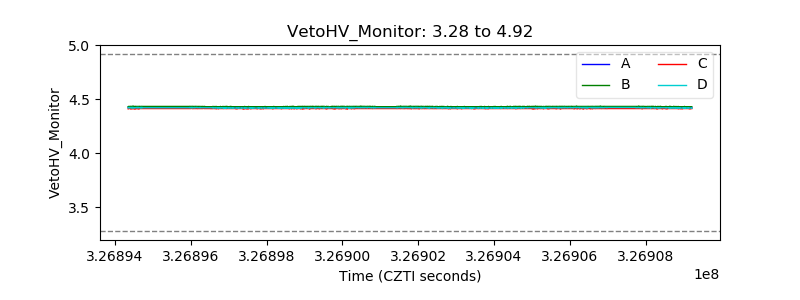 |
| Veto LLD | 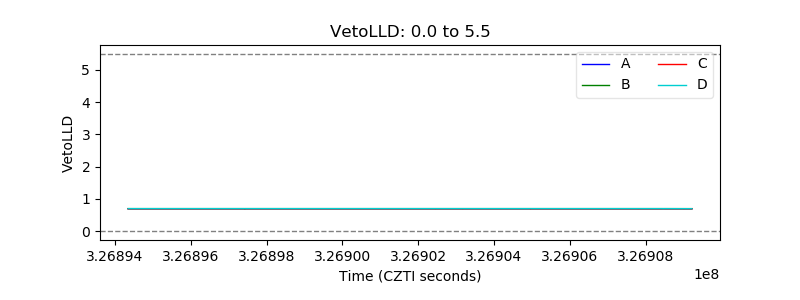 |
| Alpha Counter |  |
| _CPM_Rate |  |
| CZT Counter | 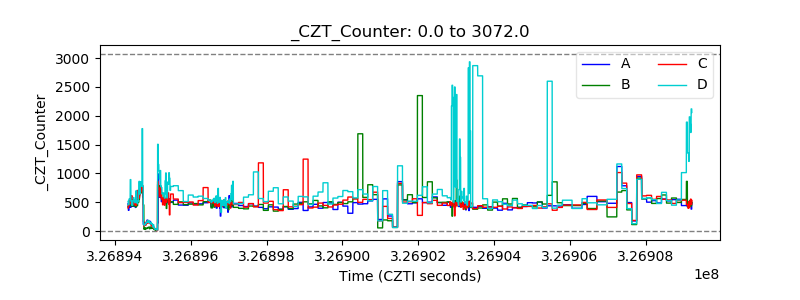 |
| +2.5 Volts monitor |  |
| +5 Volts monitor |  |
| _ROLL_ROT | 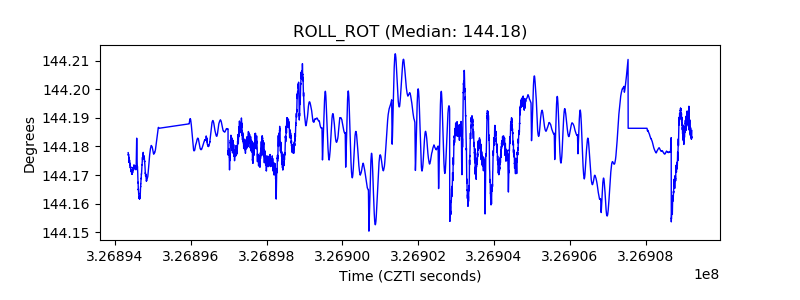 |
| _Roll_DEC | 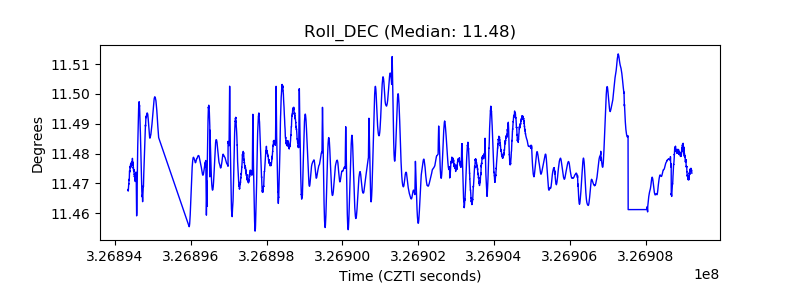 |
| _Roll_RA | 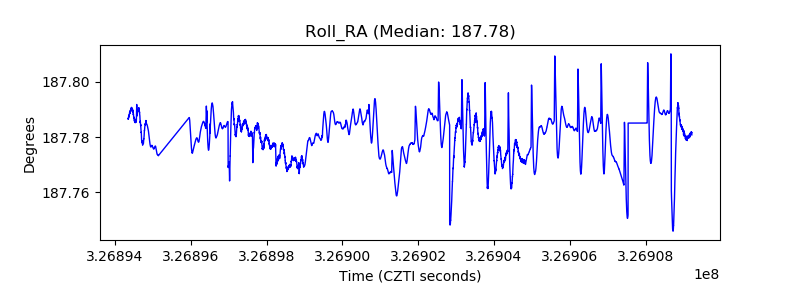 |
| Veto Counter | 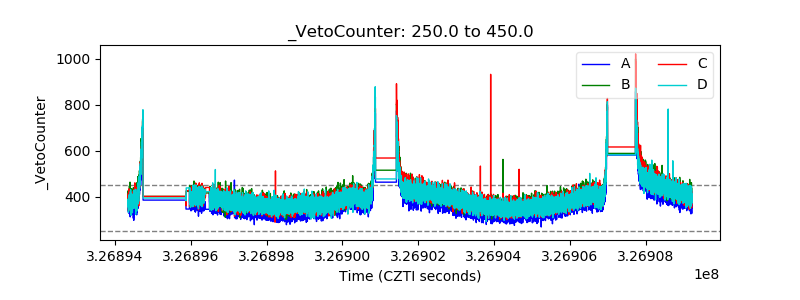 |