| Param | Original file | Final file |
|---|---|---|
| Filename | modeM0/AS1A08_003T17_9000003656_24978cztM0_level2.evt | modeM0/AS1A08_003T17_9000003656_24978cztM0_level2_quad_clean.evt |
| Size (bytes) | 151,004,160 | 34,513,920 |
| Size | 144.0 MB | 32.9 MB |
| Events in quadrant A | 870,316 | 234,810 |
| Events in quadrant B | 925,507 | 236,906 |
| Events in quadrant C | 893,245 | 225,565 |
| Events in quadrant D | 1,760,225 | 216,667 |
| Mode M0 | |||
|---|---|---|---|
| Quadrant | BADHDUFLAG | Total packets | Discarded packets |
| A | 0 | 3654 | 0 |
| B | 0 | 3873 | 0 |
| C | 0 | 3693 | 0 |
| D | 0 | 6367 | 0 |
| Mode SS | |||
|---|---|---|---|
| Quadrant | BADHDUFLAG | Total packets | Discarded packets |
| A | 0 | 36 | 0 |
| B | 0 | 36 | 0 |
| C | 0 | 36 | 0 |
| D | 0 | 36 | 0 |
| Quadrant | Total seconds | Saturated seconds | Saturation percentage |
|---|---|---|---|
| A | 1785 | 3 | 0.168067% |
| B | 1786 | 3 | 0.167973% |
| C | 1786 | 14 | 0.783875% |
| D | 1786 | 68 | 3.807391% |
Noise dominated data is calculated using 1-second bins in cleaned event files. If a bin has >2000 counts, and if more than 50% of those come from <1% of pixels, then it is considered to be noise-dominated and hence unusable.
| Quadrant | # 1 sec bins | Bins with >0 counts | Bins with >2000 counts | High rate bins dominated by noise | Noise dominated (total time) | Noise dominated (detector-on time) | Marked lightcurve |
|---|---|---|---|---|---|---|---|
| A | 1785 | 1785 | 0 | 0 | 0.00% | 0.00% | 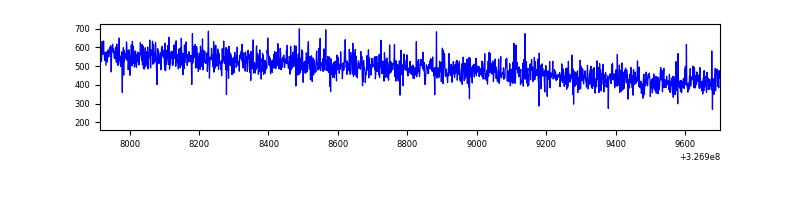 |
| B | 1786 | 1786 | 2 | 2 | 0.11% | 0.11% | 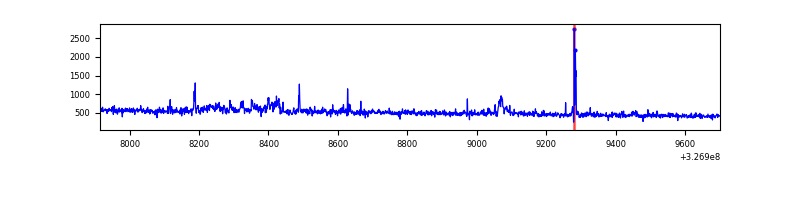 |
| C | 1786 | 1786 | 0 | 0 | 0.00% | 0.00% | 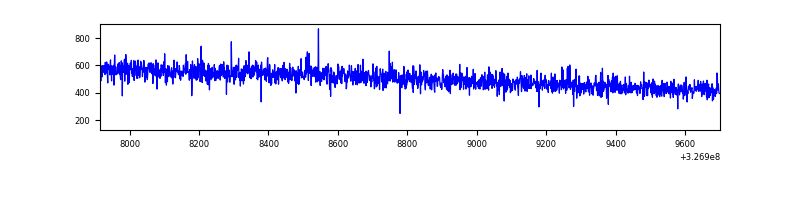 |
| D | 1786 | 1786 | 70 | 70 | 3.92% | 3.92% | 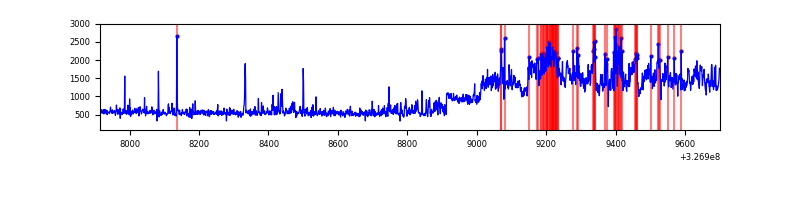 |
Top three noisy pixels from each quadrant. If the there are fewer than three noisy pixels in the level2.evt file, extra rows are filled as -1
| Pixel properties | Quadrant properties | ||||||
|---|---|---|---|---|---|---|---|
| Quadrant | DetID | PixID | Counts | Sigma | Mean | Median | Sigma |
| A | 13 | 254 | 2657 | 51.76 | 225 | 220 | 47.1 |
| A | 3 | 137 | 2064 | 39.16 | 225 | 220 | 47.1 |
| A | 0 | 226 | 1955 | 36.85 | 225 | 220 | 47.1 |
| B | 3 | 64 | 32622 | 730.21 | 221 | 215 | 44.4 |
| B | 10 | 251 | 15027 | 333.75 | 221 | 215 | 44.4 |
| B | 0 | 190 | 5213 | 112.62 | 221 | 215 | 44.4 |
| C | 14 | 238 | 34308 | 649.35 | 216 | 217 | 52.5 |
| C | 7 | 247 | 6371 | 117.22 | 216 | 217 | 52.5 |
| C | 8 | 128 | 4713 | 85.64 | 216 | 217 | 52.5 |
| D | 7 | 238 | 736913 | 13252.8 | 220 | 214 | 55.6 |
| D | 8 | 195 | 66030 | 1183.99 | 220 | 214 | 55.6 |
| D | 1 | 52 | 48640 | 871.16 | 220 | 214 | 55.6 |
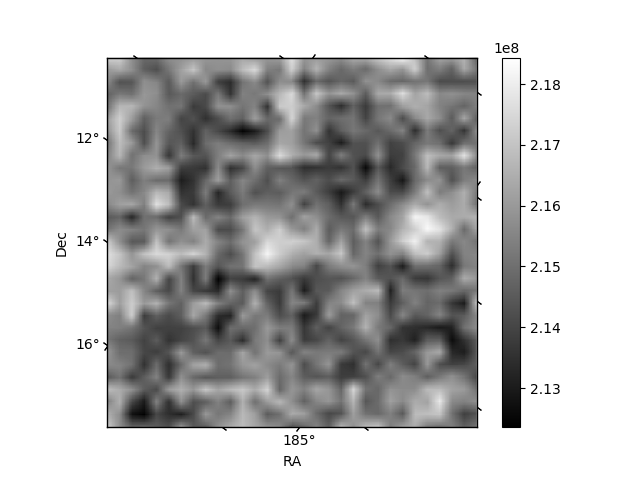
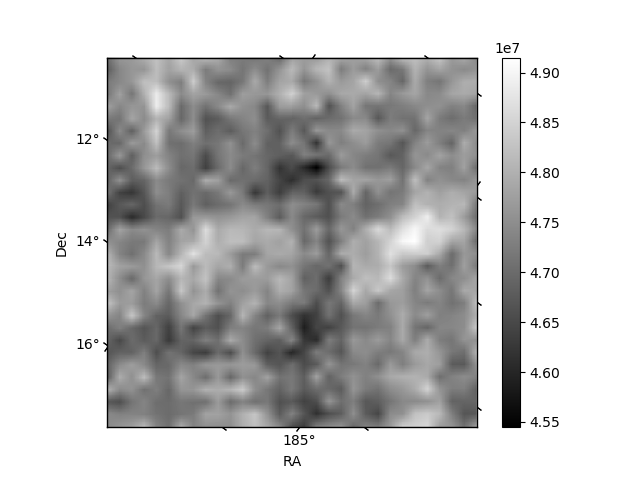
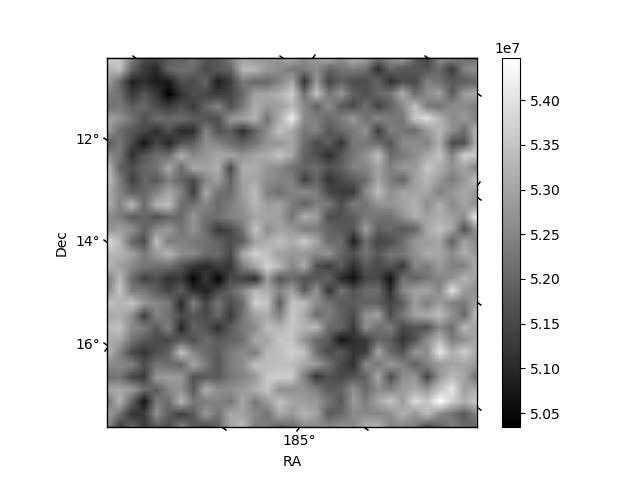
Histogram calculated using DETX and DETY for each event in the final _common_clean file
| Quadrant A | 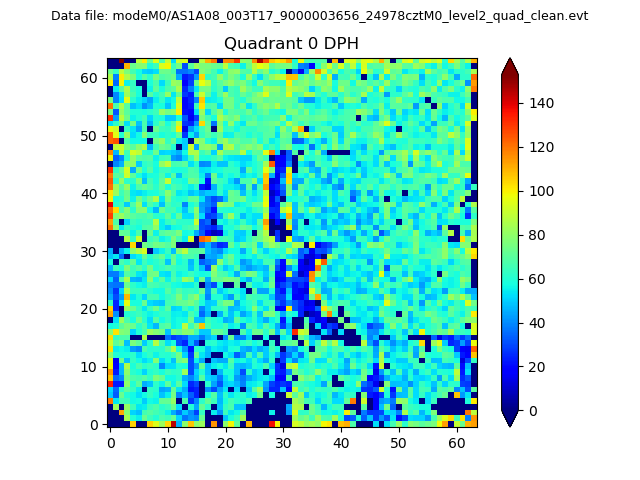 |
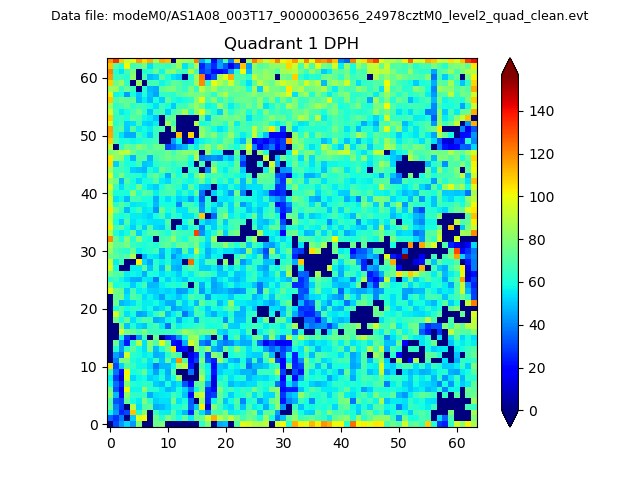 |
Quadrant B |
|---|---|---|---|
| Quadrant D | 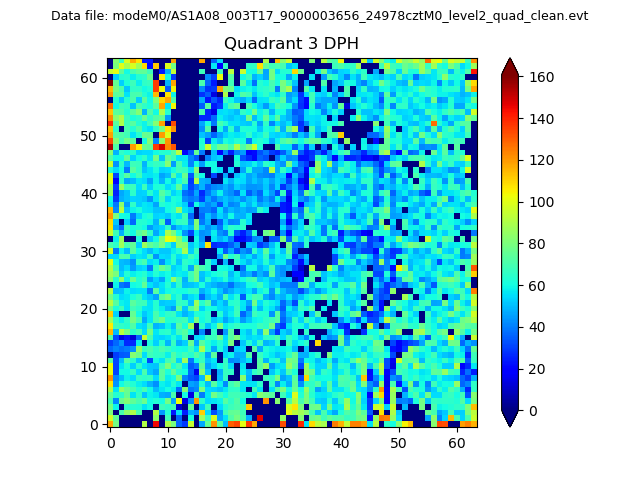 |
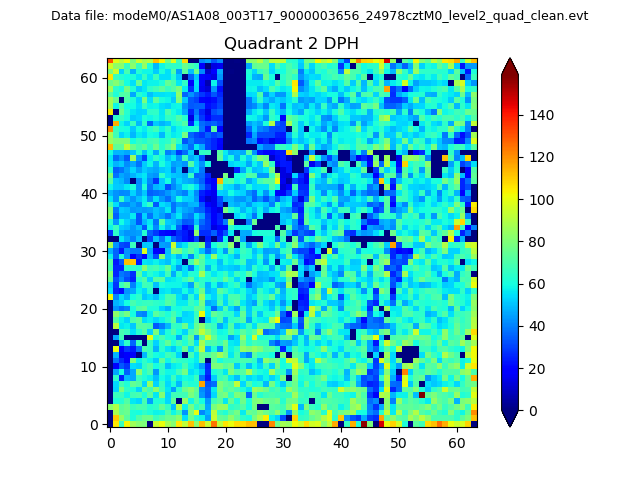 |
Quadrant C |
| Plot type | Count rate plots | Images |
|---|---|---|
| Comparison with Poisson distribution Blue bars denote a histogram of data divided into 1 sec bins. Red curve is a Poisson curve with rate = median count rate of data. |
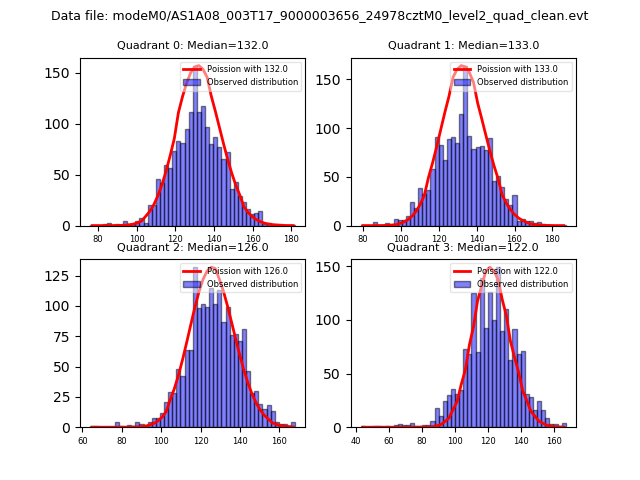 |
 |
| Quadrant-wise count rates Data is divided into 100 sec bins |
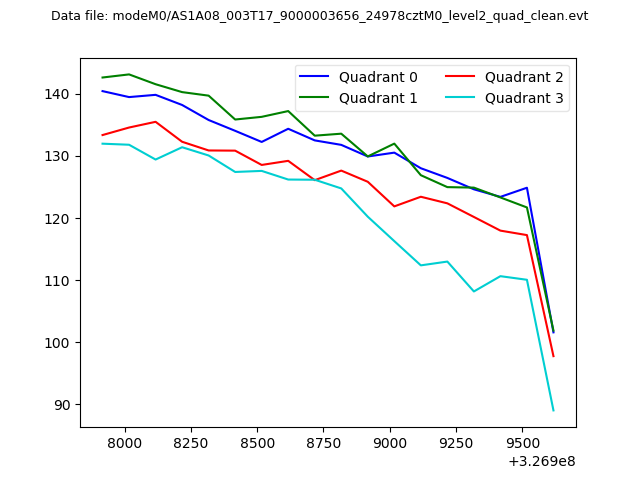 |
|
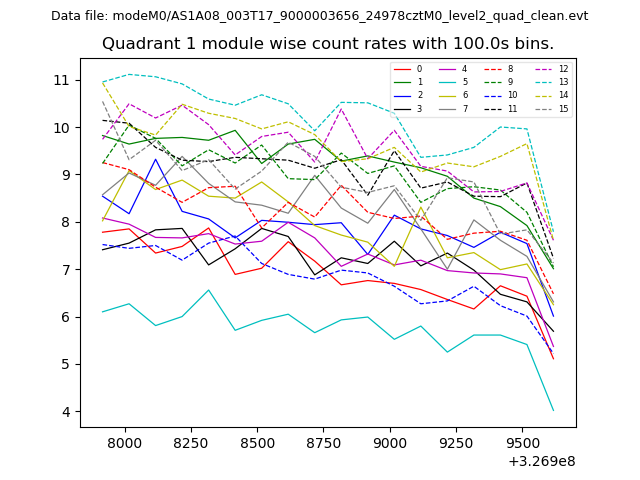
| Module-wise count rates for Quadrant A Data is divided into 100 sec bins |
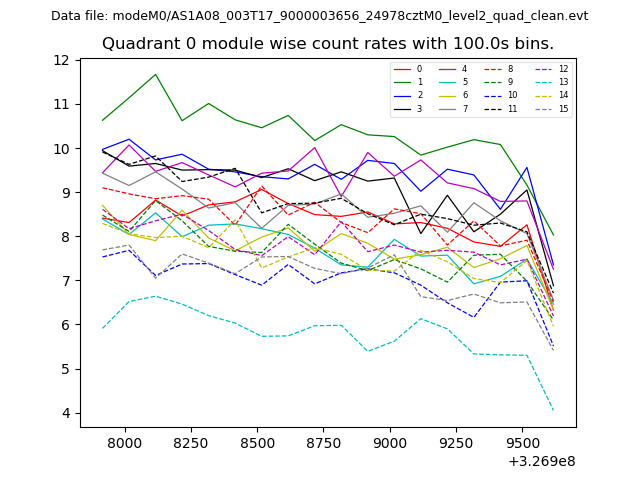 |
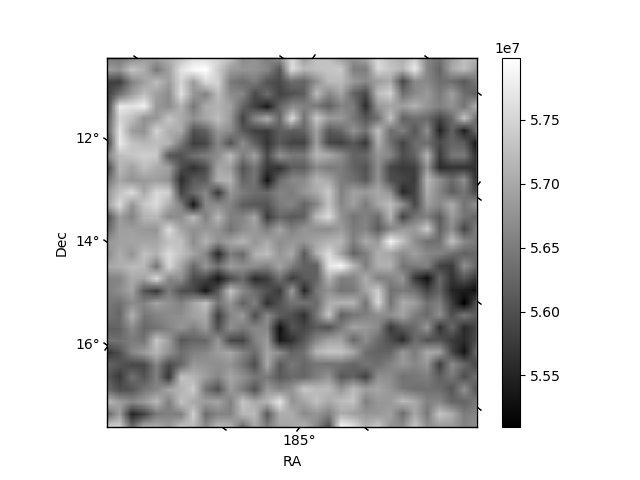 |
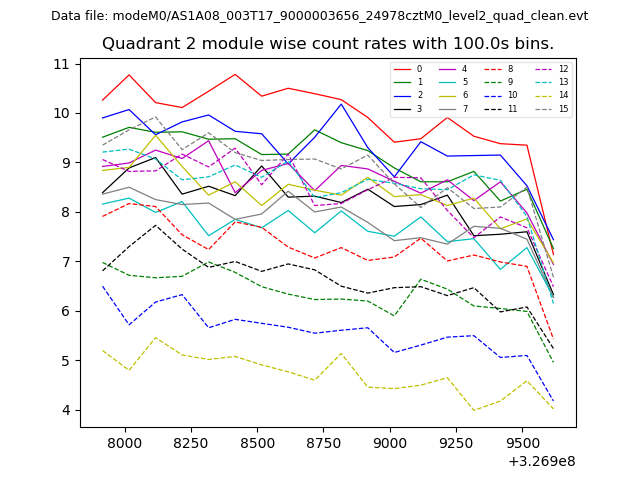
| Module-wise count rates for Quadrant B Data is divided into 100 sec bins |
 |
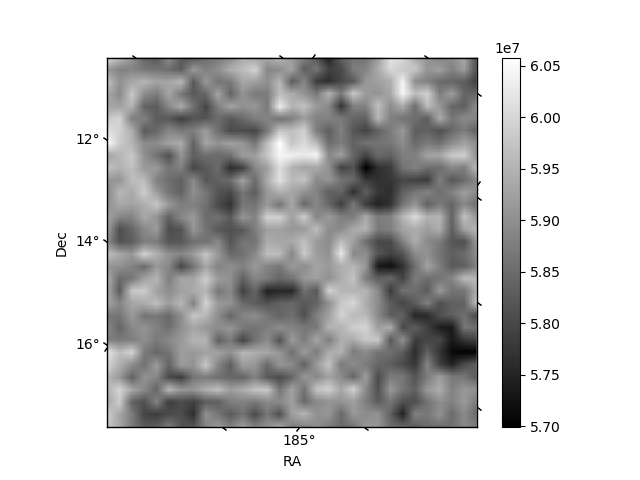 |
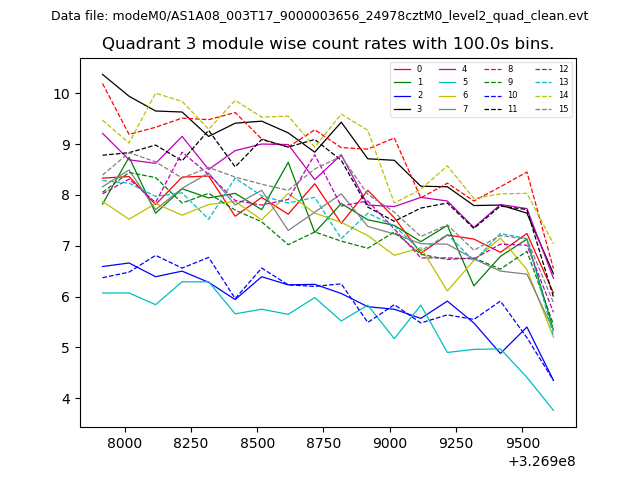
| Module-wise count rates for Quadrant C Data is divided into 100 sec bins |
 |
 |
| Module-wise count rates for Quadrant D Data is divided into 100 sec bins |
 |
 |
| Parameter | Plot |
|---|---|
| CZT HV Monitor | 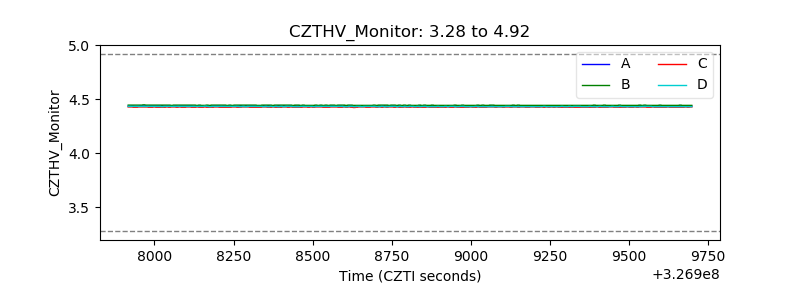 |
| D_VDD | 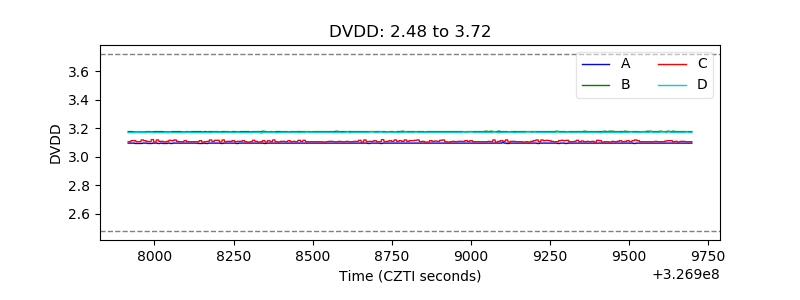 |
| Temperature 1 | 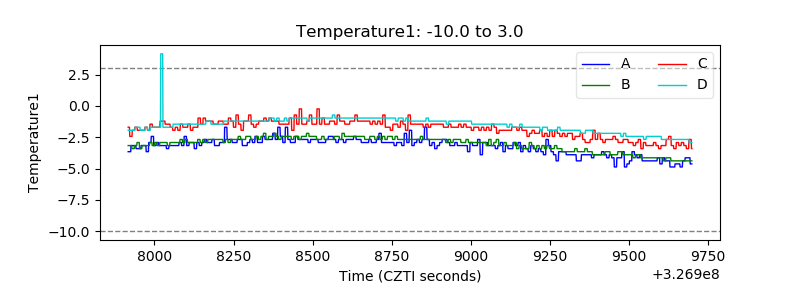 |
| Veto HV Monitor |  |
| Veto LLD | 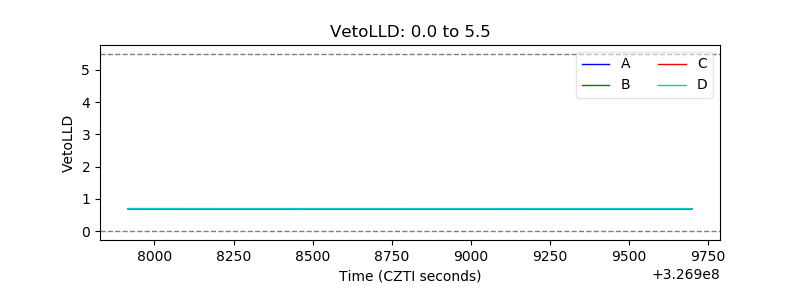 |
| Alpha Counter | 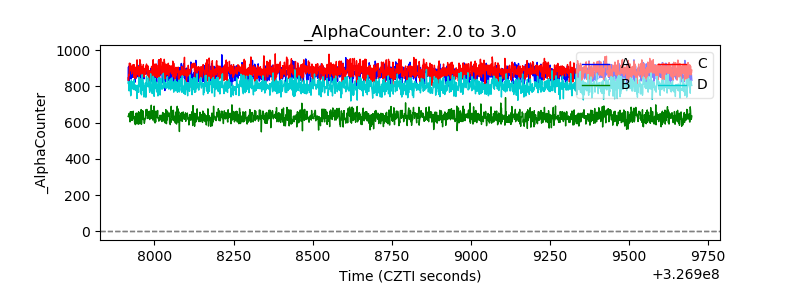 |
| _CPM_Rate |  |
| CZT Counter | 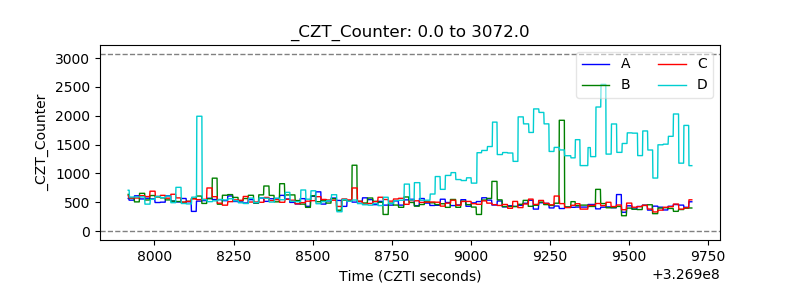 |
| +2.5 Volts monitor | 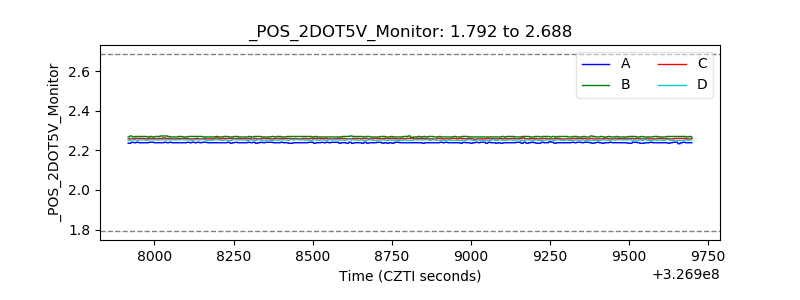 |
| +5 Volts monitor | 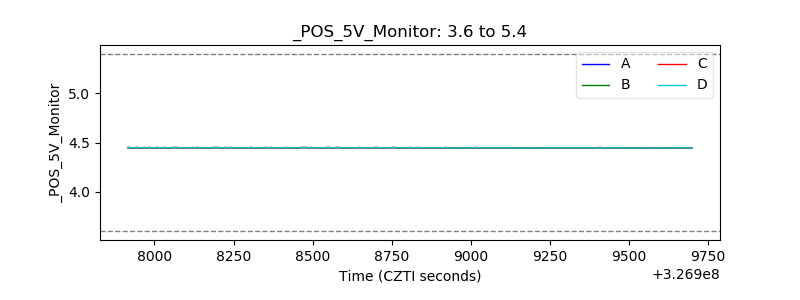 |
| _ROLL_ROT | 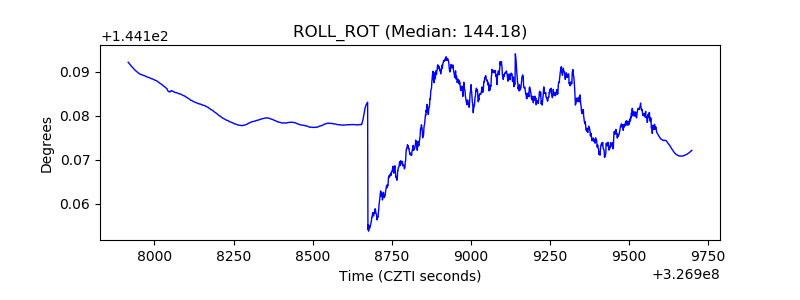 |
| _Roll_DEC | 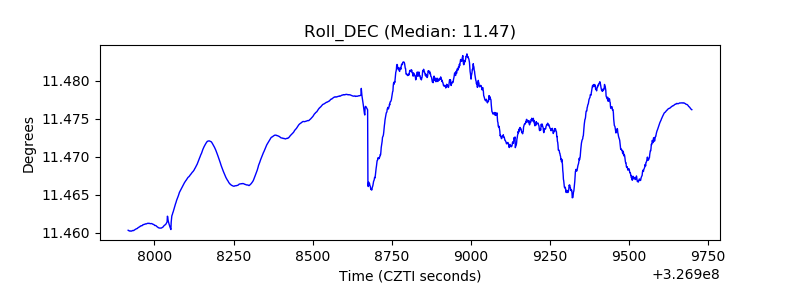 |
| _Roll_RA | 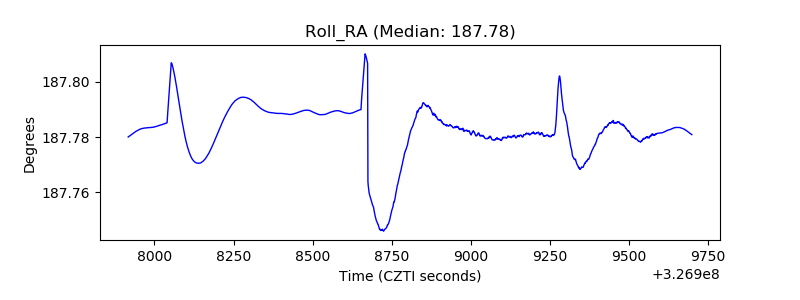 |
| Veto Counter | 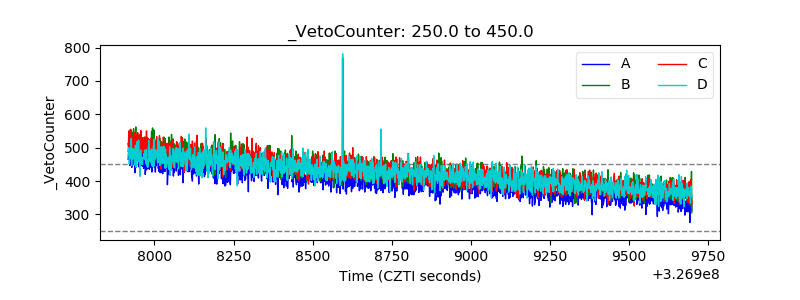 |