| Param | Original file | Final file |
|---|---|---|
| Filename | modeM0/AS1A08_003T18_9000003658cztM0_level2.fits | modeM0/AS1A08_003T18_9000003658cztM0_level2_quad_clean.evt |
| Size (bytes) | 438,465,600 | 214,035,840 |
| Size | 418.2 MB | 204.1 MB |
| Events in quadrant A | 2,768,038 | 945,010 |
| Events in quadrant B | 2,663,064 | 948,996 |
| Events in quadrant C | 2,635,706 | 862,949 |
| Events in quadrant D | 2,297,122 | 806,231 |
| Mode M9 | |||
|---|---|---|---|
| Quadrant | BADHDUFLAG | Total packets | Discarded packets |
| A | 0 | 96 | 0 |
| B | 0 | 96 | 0 |
| C | 0 | 96 | 0 |
| D | 0 | 96 | 0 |
| Mode SS | |||
|---|---|---|---|
| Quadrant | BADHDUFLAG | Total packets | Discarded packets |
| A | 0 | 866 | 0 |
| B | 0 | 866 | 0 |
| C | 0 | 866 | 0 |
| D | 0 | 866 | 0 |
| Mode M0 | |||
|---|---|---|---|
| Quadrant | BADHDUFLAG | Total packets | Discarded packets |
| A | 0 | 88652 | 0 |
| B | 0 | 90158 | 0 |
| C | 0 | 98560 | 0 |
| D | 0 | 114226 | 0 |
| Quadrant | Total seconds | Saturated seconds | Saturation percentage |
|---|---|---|---|
| A | 42465 | 286 | 0.673496% |
| B | 42465 | 381 | 0.897209% |
| C | 42464 | 1064 | 2.505652% |
| D | 42465 | 1031 | 2.427882% |
Noise dominated data is calculated using 1-second bins in cleaned event files. If a bin has >2000 counts, and if more than 50% of those come from <1% of pixels, then it is considered to be noise-dominated and hence unusable.
| Quadrant | # 1 sec bins | Bins with >0 counts | Bins with >2000 counts | High rate bins dominated by noise | Noise dominated (total time) | Noise dominated (detector-on time) | Marked lightcurve |
|---|---|---|---|---|---|---|---|
| A | 52015 | 42465 | 0 | 0 | 0.00% | 0.00% |  |
| B | 52015 | 42465 | 0 | 0 | 0.00% | 0.00% |  |
| C | 52015 | 42457 | 0 | 0 | 0.00% | 0.00% |  |
| D | 52015 | 42461 | 0 | 0 | 0.00% | 0.00% |  |
Top three noisy pixels from each quadrant. If the there are fewer than three noisy pixels in the level2.evt file, extra rows are filled as -1
| Pixel properties | Quadrant properties | ||||||
|---|---|---|---|---|---|---|---|
| Quadrant | DetID | PixID | Counts | Sigma | Mean | Median | Sigma |
| A | 0 | 29 | 2654 | 11.07 | 720 | 678 | 178.4 |
| A | 7 | 110 | 2209 | 8.58 | 720 | 678 | 178.4 |
| A | 0 | 30 | 2098 | 7.96 | 720 | 678 | 178.4 |
| B | 2 | 9 | 2114 | 10.41 | 703 | 672 | 138.5 |
| B | 5 | 255 | 1730 | 7.64 | 703 | 672 | 138.5 |
| B | 2 | 8 | 1725 | 7.6 | 703 | 672 | 138.5 |
| C | 1 | 80 | 2074 | 7.95 | 696 | 653 | 178.6 |
| C | 1 | 81 | 2030 | 7.71 | 696 | 653 | 178.6 |
| C | 12 | 241 | 1809 | 6.47 | 696 | 653 | 178.6 |
| D | 7 | 3 | 1624 | 5.82 | 654 | 596 | 176.7 |
| D | 10 | 189 | 1602 | 5.69 | 654 | 596 | 176.7 |
| D | 6 | 231 | 1593 | 5.64 | 654 | 596 | 176.7 |
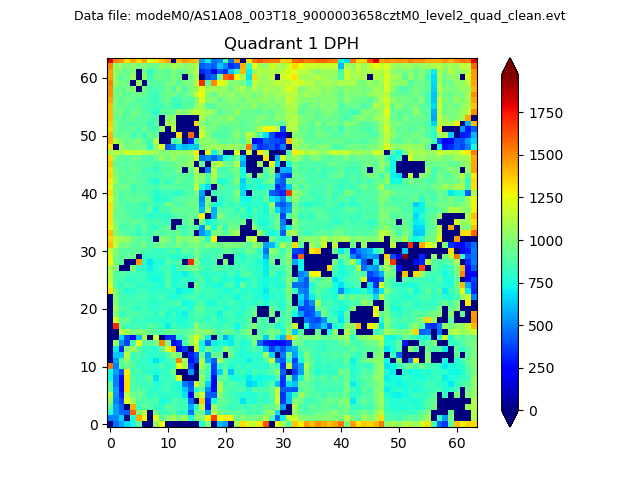
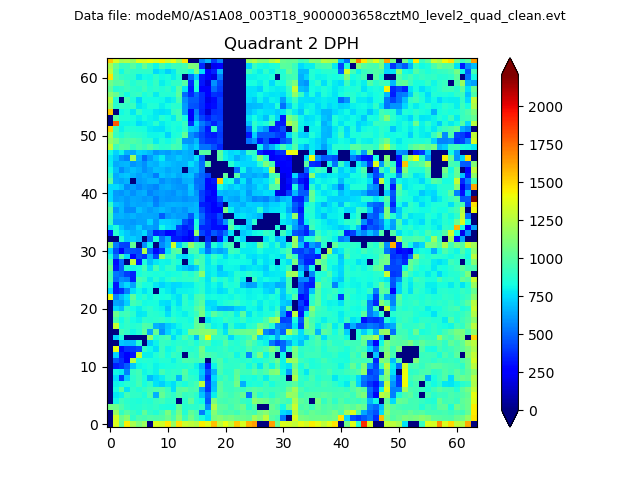
Histogram calculated using DETX and DETY for each event in the final _common_clean file
| Quadrant A |  |
 |
Quadrant B |
|---|---|---|---|
| Quadrant D | 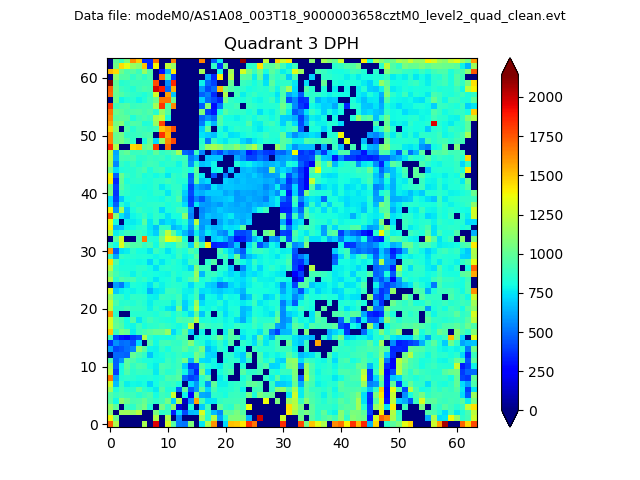 |
 |
Quadrant C |
| Plot type | Count rate plots | Images |
|---|---|---|
| Comparison with Poisson distribution Blue bars denote a histogram of data divided into 1 sec bins. Red curve is a Poisson curve with rate = median count rate of data. |
 |
 |
| Quadrant-wise count rates Data is divided into 100 sec bins |
 |
|
| Module-wise count rates for Quadrant A Data is divided into 100 sec bins |
 |
 |
| Module-wise count rates for Quadrant B Data is divided into 100 sec bins |
 |
 |
| Module-wise count rates for Quadrant C Data is divided into 100 sec bins |
 |
 |
| Module-wise count rates for Quadrant D Data is divided into 100 sec bins |
 |
 |
| Parameter | Plot |
|---|---|
| CZT HV Monitor |  |
| D_VDD | 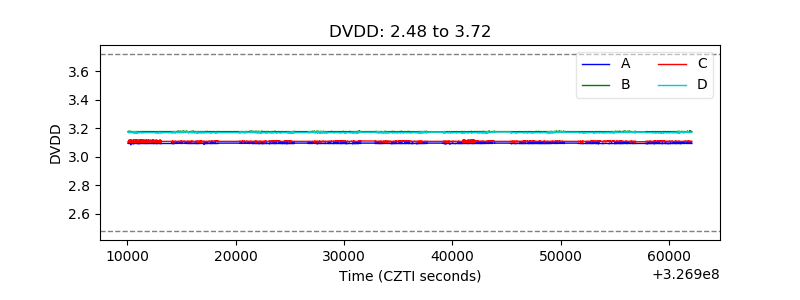 |
| Temperature 1 |  |
| Veto HV Monitor |  |
| Veto LLD |  |
| Alpha Counter |  |
| _CPM_Rate |  |
| CZT Counter |  |
| +2.5 Volts monitor |  |
| +5 Volts monitor |  |
| _ROLL_ROT |  |
| _Roll_DEC |  |
| _Roll_RA |  |
| Veto Counter |  |