| Param | Original file | Final file |
|---|---|---|
| Filename | modeM0/AS1A08_003T18_9000003658_24980cztM0_level2.evt | modeM0/AS1A08_003T18_9000003658_24980cztM0_level2_quad_clean.evt |
| Size (bytes) | 759,182,400 | 119,479,680 |
| Size | 724.0 MB | 113.9 MB |
| Events in quadrant A | 4,608,930 | 759,830 |
| Events in quadrant B | 4,865,273 | 769,890 |
| Events in quadrant C | 4,837,230 | 725,182 |
| Events in quadrant D | 8,025,932 | 692,749 |
| Mode M9 | |||
|---|---|---|---|
| Quadrant | BADHDUFLAG | Total packets | Discarded packets |
| A | 0 | 20 | 0 |
| B | 0 | 20 | 0 |
| C | 0 | 20 | 0 |
| D | 0 | 20 | 0 |
| Mode SS | |||
|---|---|---|---|
| Quadrant | BADHDUFLAG | Total packets | Discarded packets |
| A | 0 | 198 | 0 |
| B | 0 | 198 | 0 |
| C | 0 | 198 | 0 |
| D | 0 | 198 | 0 |
| Mode M0 | |||
|---|---|---|---|
| Quadrant | BADHDUFLAG | Total packets | Discarded packets |
| A | 0 | 20136 | 2 |
| B | 0 | 20681 | 2 |
| C | 0 | 20565 | 4 |
| D | 0 | 30571 | 2 |
| Quadrant | Total seconds | Saturated seconds | Saturation percentage |
|---|---|---|---|
| A | 9672 | 92 | 0.951199% |
| B | 9672 | 110 | 1.137304% |
| C | 9671 | 185 | 1.912936% |
| D | 9672 | 544 | 5.624483% |
Noise dominated data is calculated using 1-second bins in cleaned event files. If a bin has >2000 counts, and if more than 50% of those come from <1% of pixels, then it is considered to be noise-dominated and hence unusable.
| Quadrant | # 1 sec bins | Bins with >0 counts | Bins with >2000 counts | High rate bins dominated by noise | Noise dominated (total time) | Noise dominated (detector-on time) | Marked lightcurve |
|---|---|---|---|---|---|---|---|
| A | 11692 | 9674 | 0 | 0 | 0.00% | 0.00% | 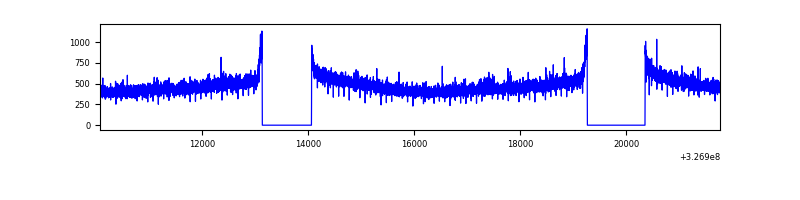 |
| B | 11692 | 9674 | 15 | 15 | 0.13% | 0.16% | 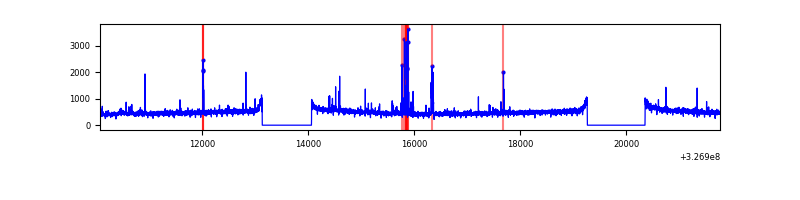 |
| C | 11692 | 9674 | 26 | 26 | 0.22% | 0.27% | 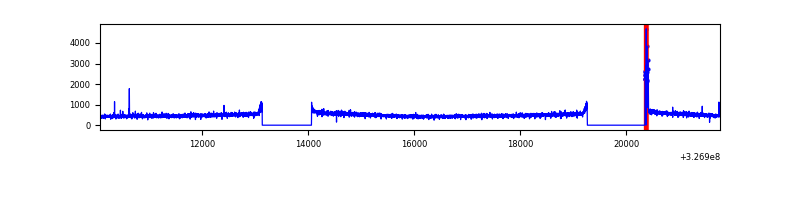 |
| D | 11692 | 9674 | 413 | 413 | 3.53% | 4.27% | 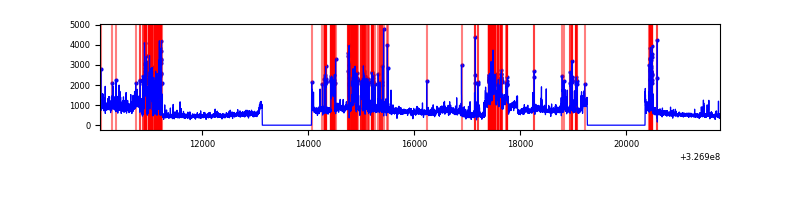 |
Top three noisy pixels from each quadrant. If the there are fewer than three noisy pixels in the level2.evt file, extra rows are filled as -1
| Pixel properties | Quadrant properties | ||||||
|---|---|---|---|---|---|---|---|
| Quadrant | DetID | PixID | Counts | Sigma | Mean | Median | Sigma |
| A | 13 | 254 | 13324 | 50.63 | 1193 | 1168 | 240.1 |
| A | 3 | 137 | 10796 | 40.1 | 1193 | 1168 | 240.1 |
| A | 0 | 226 | 10162 | 37.46 | 1193 | 1168 | 240.1 |
| B | 10 | 246 | 87795 | 387.34 | 1187 | 1158 | 223.7 |
| B | 3 | 64 | 66408 | 291.72 | 1187 | 1158 | 223.7 |
| B | 0 | 190 | 31319 | 134.84 | 1187 | 1158 | 223.7 |
| C | 14 | 238 | 180754 | 668.05 | 1141 | 1149 | 268.9 |
| C | 0 | 10 | 100397 | 369.16 | 1141 | 1149 | 268.9 |
| C | 7 | 247 | 84048 | 308.35 | 1141 | 1149 | 268.9 |
| D | 7 | 238 | 1660971 | 5992.74 | 1139 | 1109 | 277.0 |
| D | 10 | 70 | 836885 | 3017.47 | 1139 | 1109 | 277.0 |
| D | 1 | 52 | 819353 | 2954.18 | 1139 | 1109 | 277.0 |
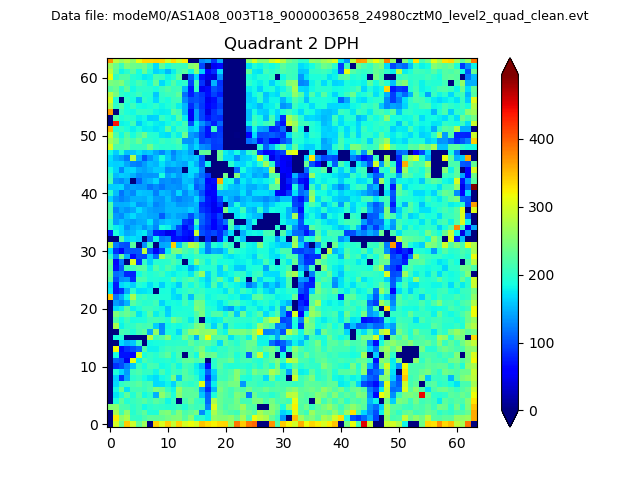
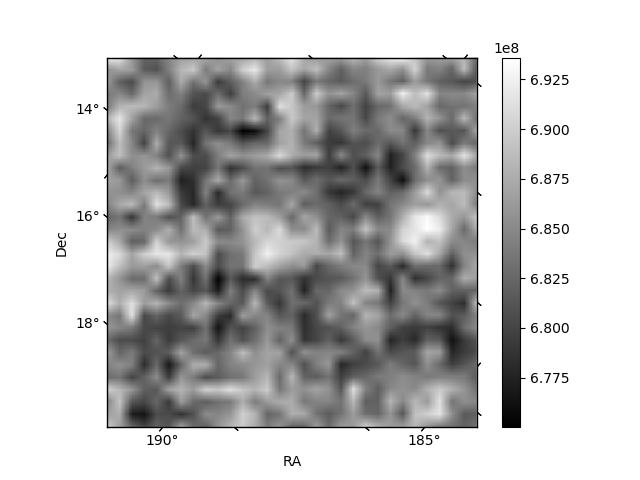
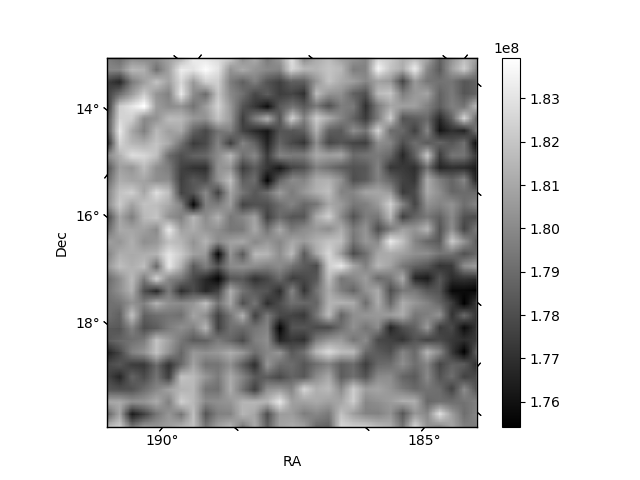
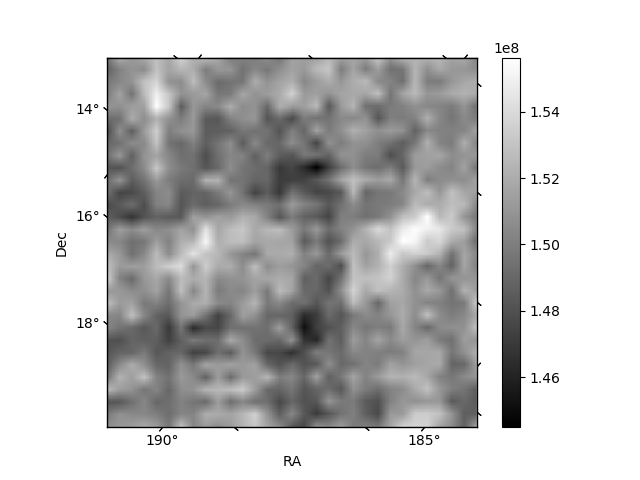
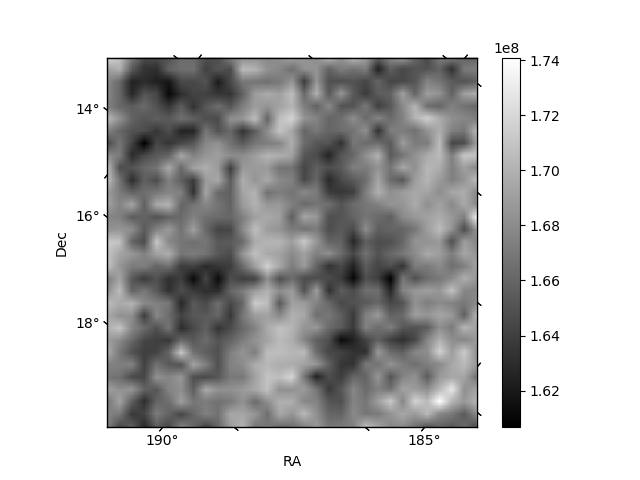
Histogram calculated using DETX and DETY for each event in the final _common_clean file
| Quadrant A | 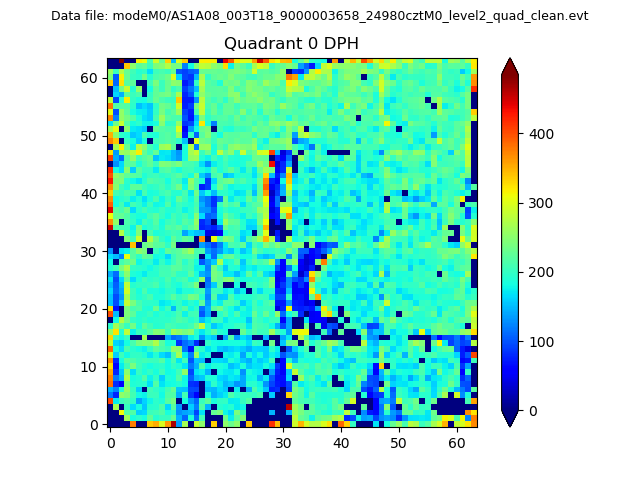 |
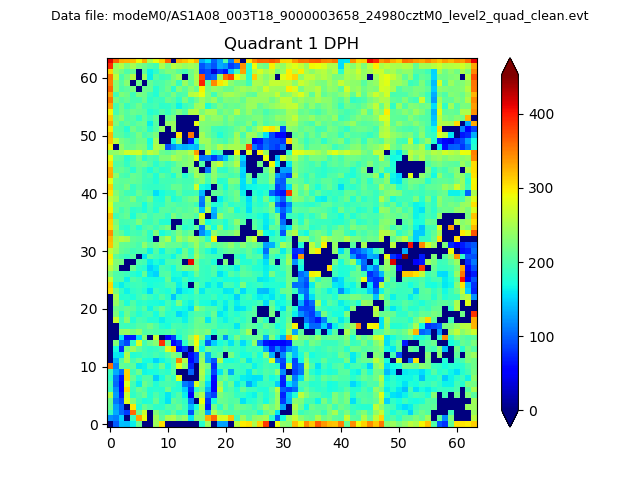 |
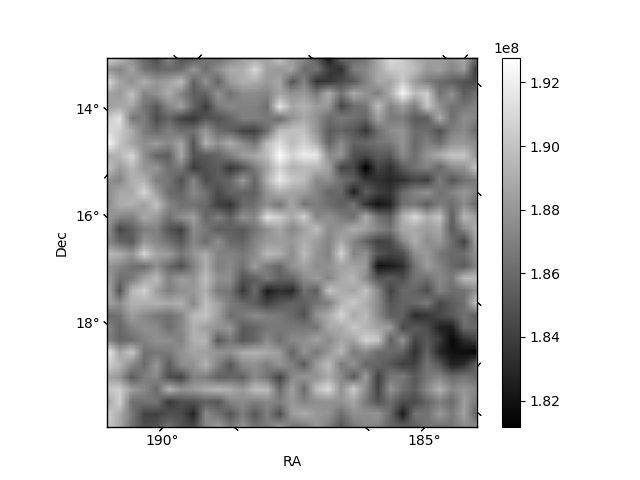
Quadrant B |
|---|---|---|---|
| Quadrant D | 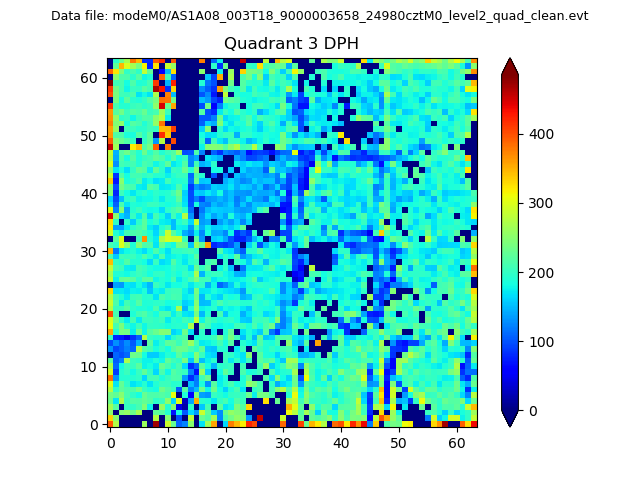 |
 |
Quadrant C |
| Plot type | Count rate plots | Images |
|---|---|---|
| Comparison with Poisson distribution Blue bars denote a histogram of data divided into 1 sec bins. Red curve is a Poisson curve with rate = median count rate of data. |
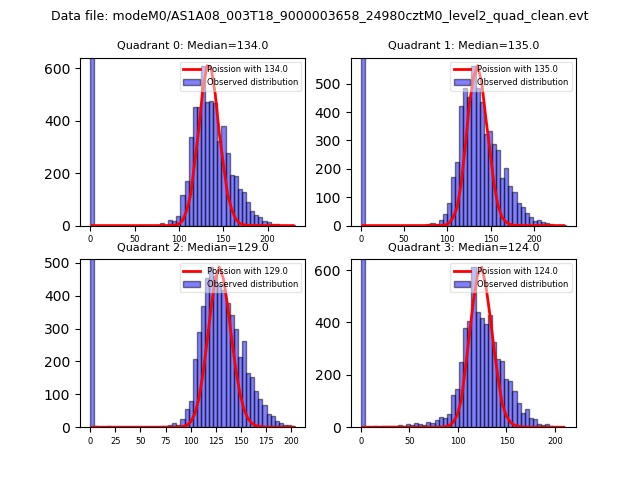 |
 |
| Quadrant-wise count rates Data is divided into 100 sec bins |
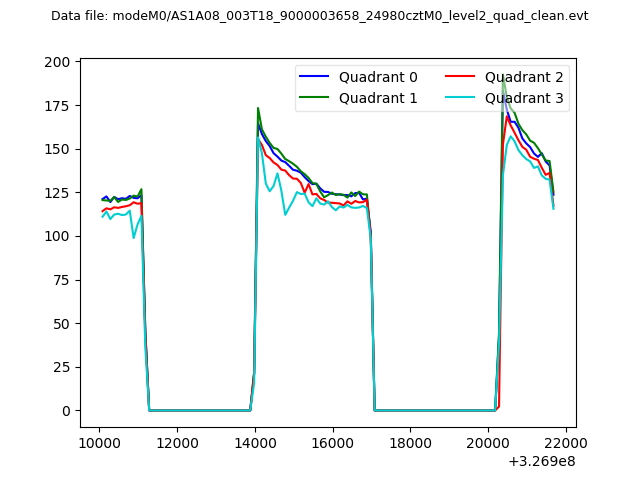 |
|
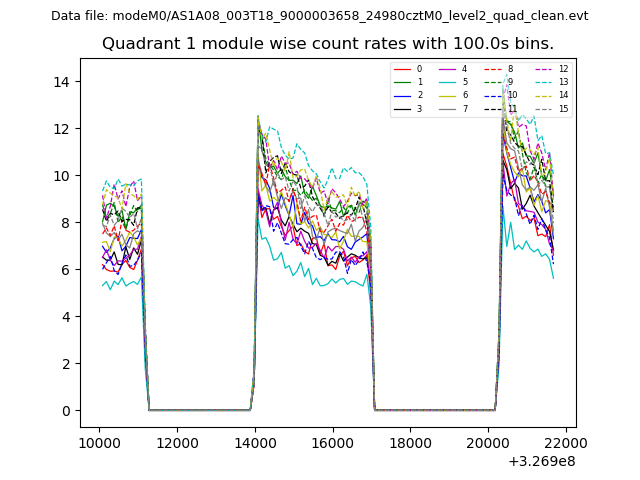
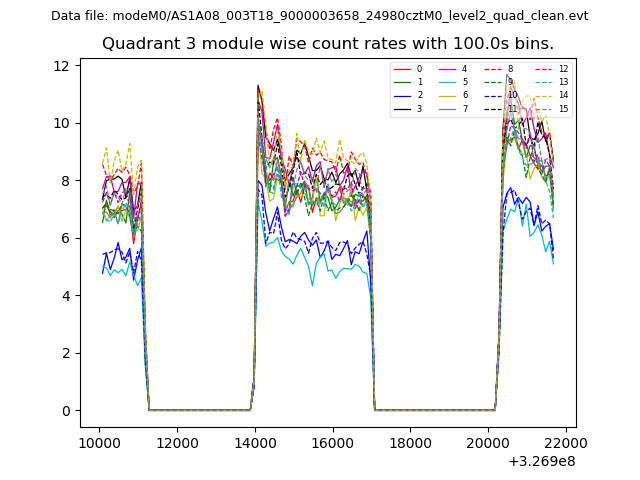
| Module-wise count rates for Quadrant A Data is divided into 100 sec bins |
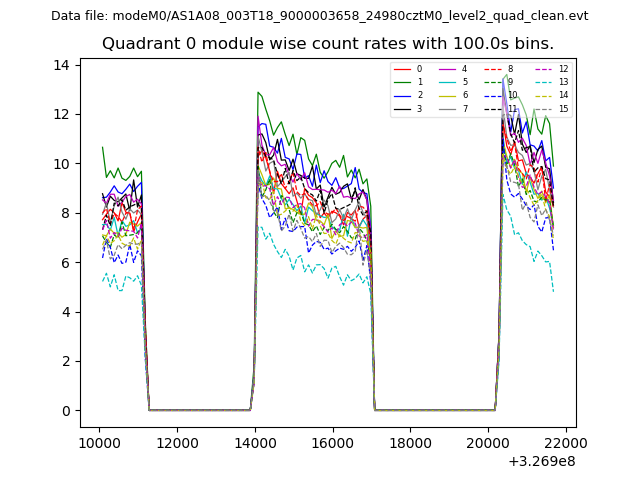 |
 |
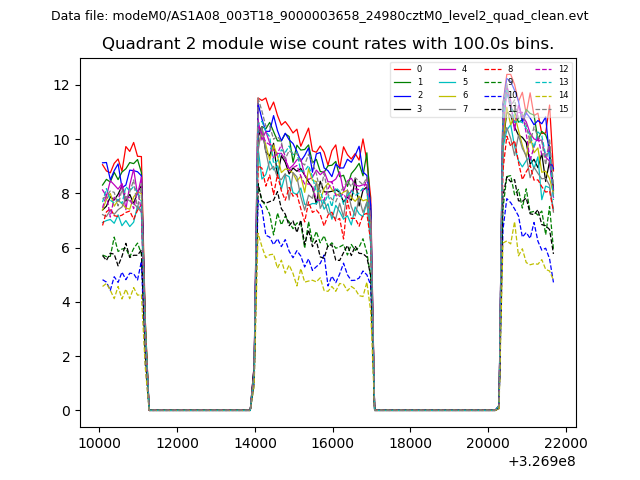
| Module-wise count rates for Quadrant B Data is divided into 100 sec bins |
 |
 |
| Module-wise count rates for Quadrant C Data is divided into 100 sec bins |
 |
 |
| Module-wise count rates for Quadrant D Data is divided into 100 sec bins |
 |
 |
| Parameter | Plot |
|---|---|
| CZT HV Monitor | 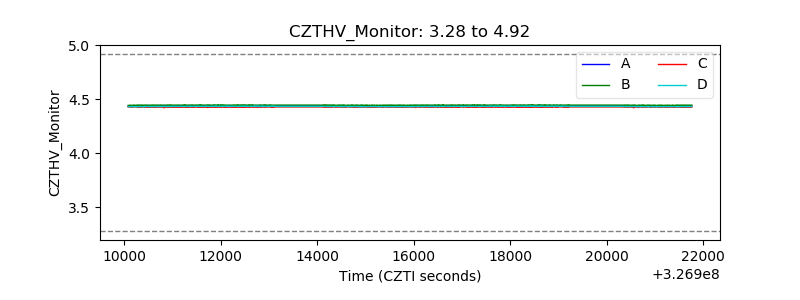 |
| D_VDD | 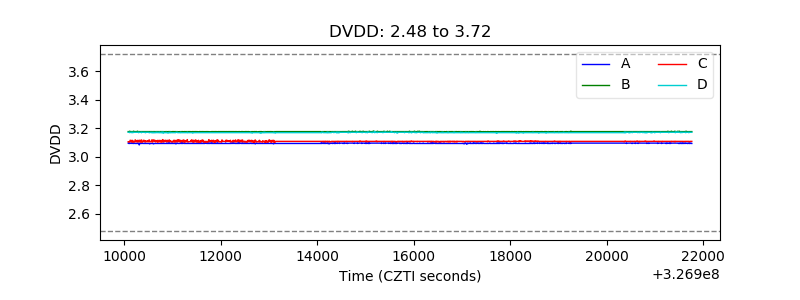 |
| Temperature 1 | 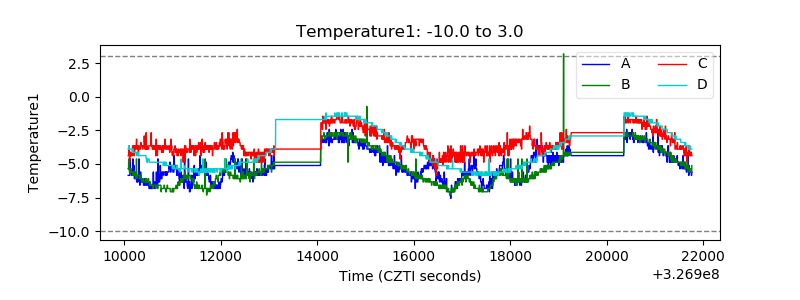 |
| Veto HV Monitor | 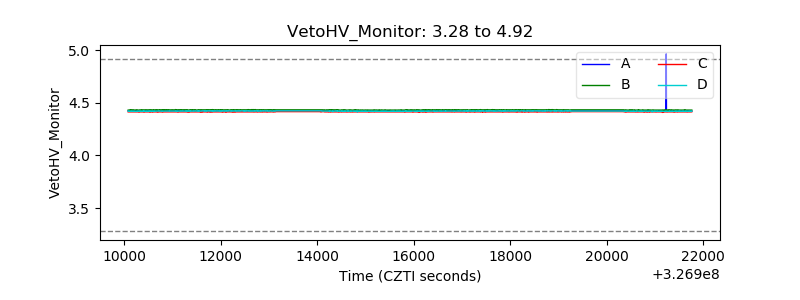 |
| Veto LLD | 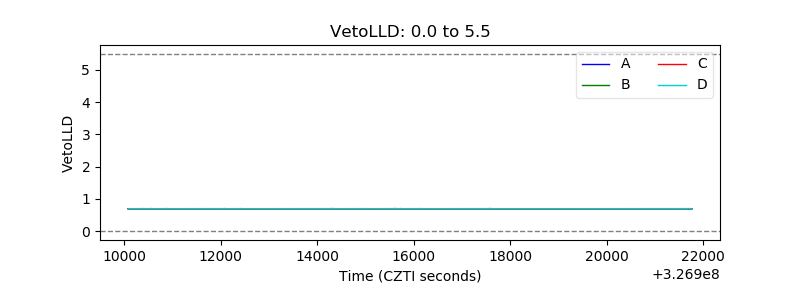 |
| Alpha Counter | 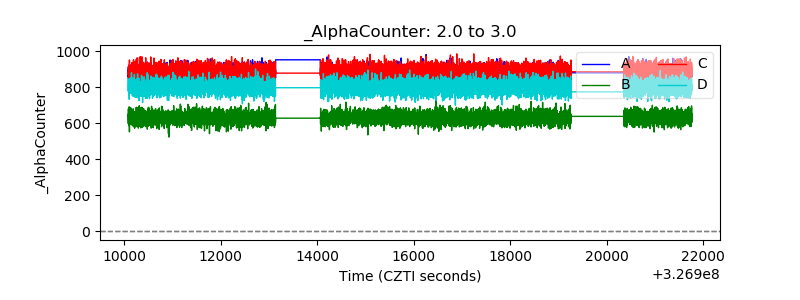 |
| _CPM_Rate | 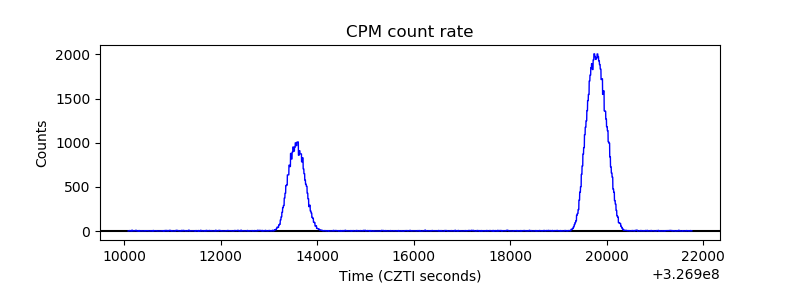 |
| CZT Counter | 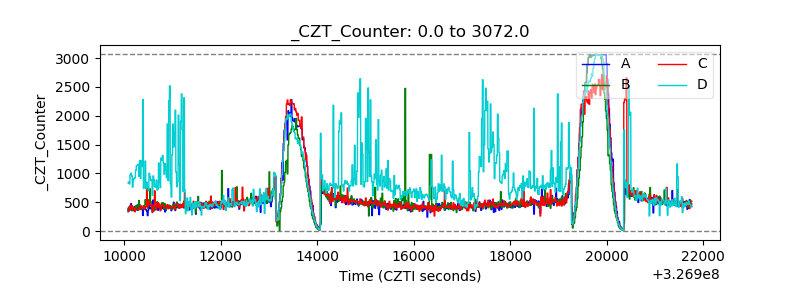 |
| +2.5 Volts monitor |  |
| +5 Volts monitor |  |
| _ROLL_ROT | 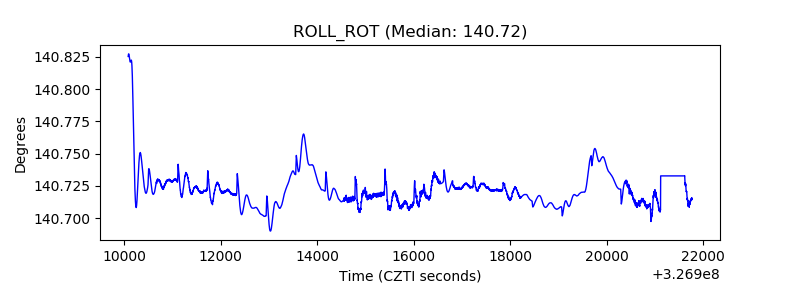 |
| _Roll_DEC | 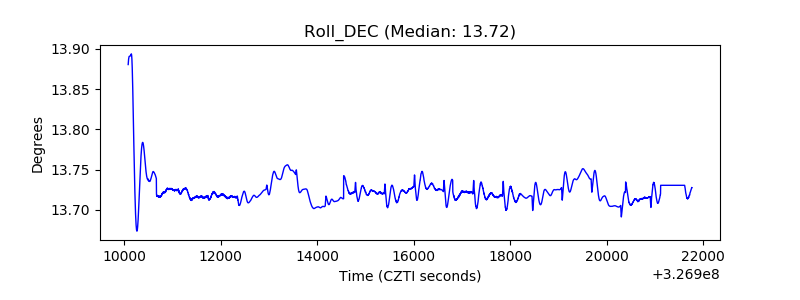 |
| _Roll_RA | 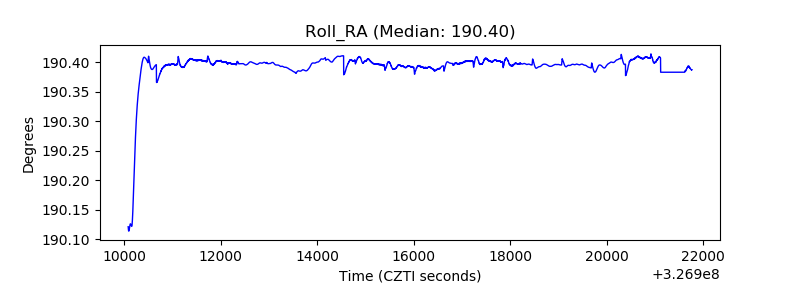 |
| Veto Counter | 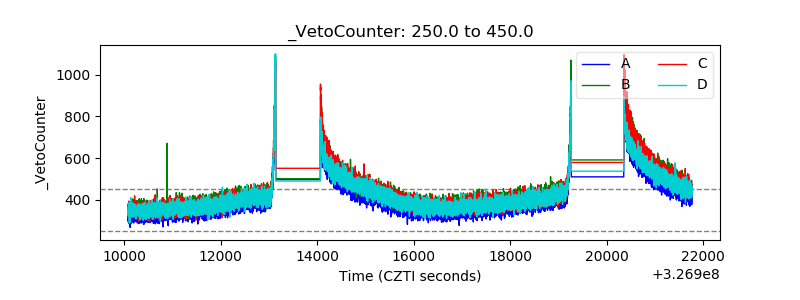 |