| Param | Original file | Final file |
|---|---|---|
| Filename | modeM0/AS1A08_003T18_9000003658_24981cztM0_level2.evt | modeM0/AS1A08_003T18_9000003658_24981cztM0_level2_quad_clean.evt |
| Size (bytes) | 1,032,382,080 | 179,591,040 |
| Size | 984.6 MB | 171.3 MB |
| Events in quadrant A | 6,517,700 | 1,154,011 |
| Events in quadrant B | 6,851,058 | 1,176,850 |
| Events in quadrant C | 6,810,358 | 1,104,535 |
| Events in quadrant D | 10,160,813 | 1,057,421 |
| Mode M9 | |||
|---|---|---|---|
| Quadrant | BADHDUFLAG | Total packets | Discarded packets |
| A | 0 | 27 | 0 |
| B | 0 | 27 | 0 |
| C | 0 | 27 | 0 |
| D | 0 | 27 | 0 |
| Mode SS | |||
|---|---|---|---|
| Quadrant | BADHDUFLAG | Total packets | Discarded packets |
| A | 0 | 282 | 0 |
| B | 0 | 282 | 0 |
| C | 0 | 282 | 0 |
| D | 0 | 282 | 0 |
| Mode M0 | |||
|---|---|---|---|
| Quadrant | BADHDUFLAG | Total packets | Discarded packets |
| A | 0 | 28521 | 3 |
| B | 0 | 29218 | 3 |
| C | 0 | 29073 | 5 |
| D | 0 | 39460 | 3 |
| Quadrant | Total seconds | Saturated seconds | Saturation percentage |
|---|---|---|---|
| A | 13689 | 91 | 0.664767% |
| B | 13689 | 111 | 0.810870% |
| C | 13687 | 205 | 1.497772% |
| D | 13687 | 551 | 4.025718% |
Noise dominated data is calculated using 1-second bins in cleaned event files. If a bin has >2000 counts, and if more than 50% of those come from <1% of pixels, then it is considered to be noise-dominated and hence unusable.
| Quadrant | # 1 sec bins | Bins with >0 counts | Bins with >2000 counts | High rate bins dominated by noise | Noise dominated (total time) | Noise dominated (detector-on time) | Marked lightcurve |
|---|---|---|---|---|---|---|---|
| A | 17808 | 13692 | 0 | 0 | 0.00% | 0.00% |  |
| B | 17808 | 13692 | 16 | 16 | 0.09% | 0.12% | 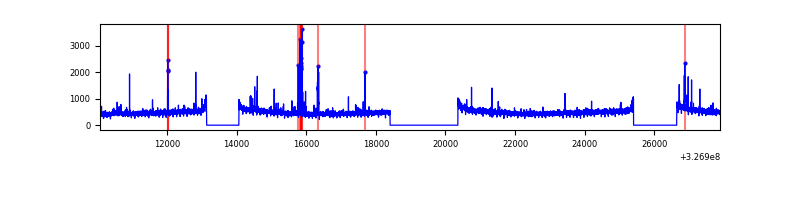 |
| C | 17807 | 13690 | 29 | 29 | 0.16% | 0.21% |  |
| D | 17807 | 13690 | 447 | 447 | 2.51% | 3.27% | 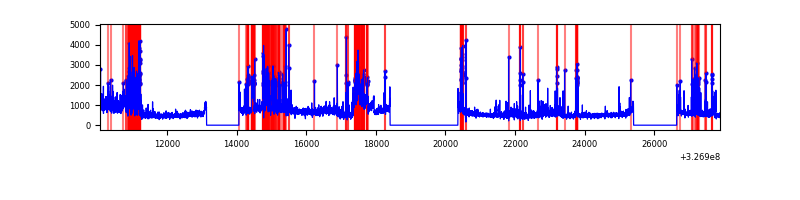 |
Top three noisy pixels from each quadrant. If the there are fewer than three noisy pixels in the level2.evt file, extra rows are filled as -1
| Pixel properties | Quadrant properties | ||||||
|---|---|---|---|---|---|---|---|
| Quadrant | DetID | PixID | Counts | Sigma | Mean | Median | Sigma |
| A | 13 | 254 | 19256 | 52.22 | 1688 | 1652 | 337.1 |
| A | 3 | 137 | 14965 | 39.49 | 1688 | 1652 | 337.1 |
| A | 0 | 226 | 14486 | 38.07 | 1688 | 1652 | 337.1 |
| B | 10 | 246 | 96518 | 302.64 | 1683 | 1642 | 313.5 |
| B | 3 | 64 | 79096 | 247.07 | 1683 | 1642 | 313.5 |
| B | 12 | 111 | 39174 | 119.72 | 1683 | 1642 | 313.5 |
| C | 14 | 238 | 258449 | 678.29 | 1617 | 1631 | 378.6 |
| C | 0 | 10 | 128569 | 335.26 | 1617 | 1631 | 378.6 |
| C | 7 | 247 | 94765 | 245.98 | 1617 | 1631 | 378.6 |
| D | 7 | 238 | 1512307 | 3862.96 | 1614 | 1569 | 391.1 |
| D | 10 | 70 | 970216 | 2476.83 | 1614 | 1569 | 391.1 |
| D | 1 | 52 | 926730 | 2365.64 | 1614 | 1569 | 391.1 |
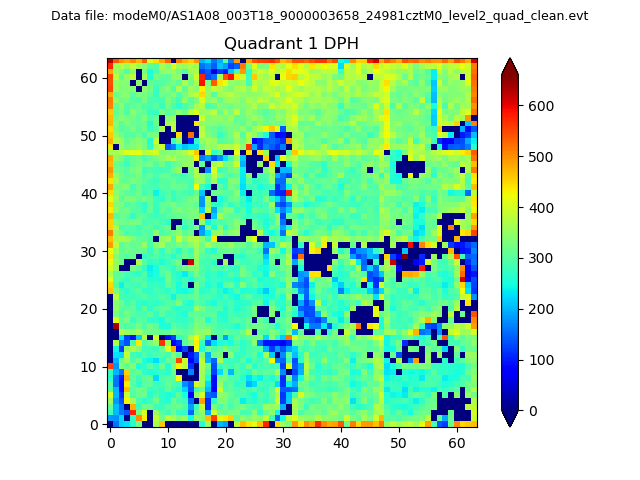
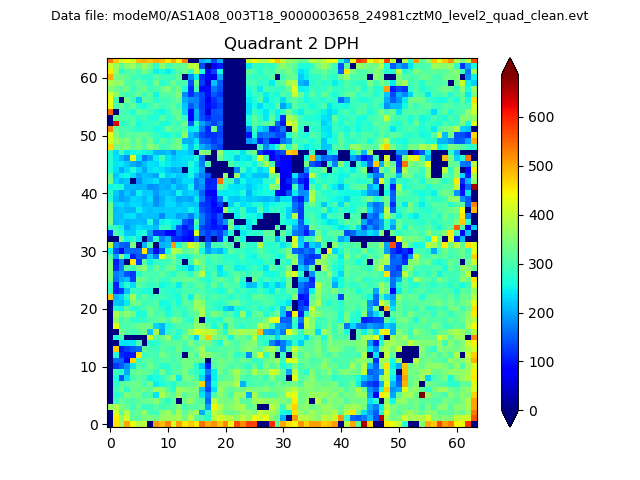
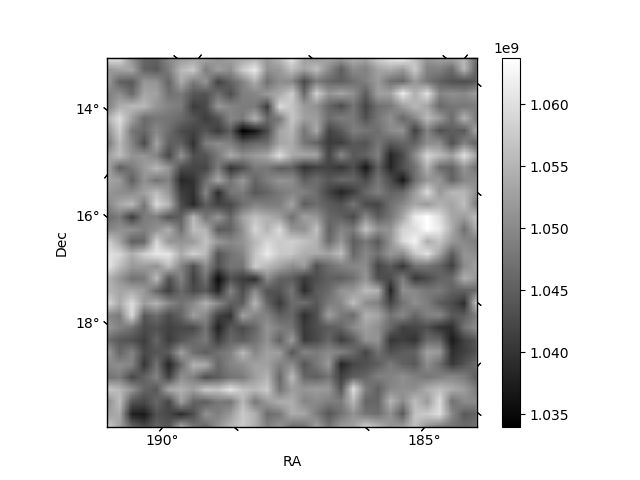
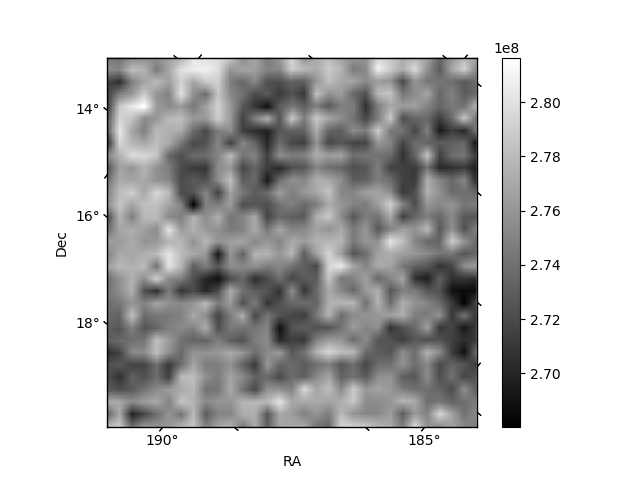
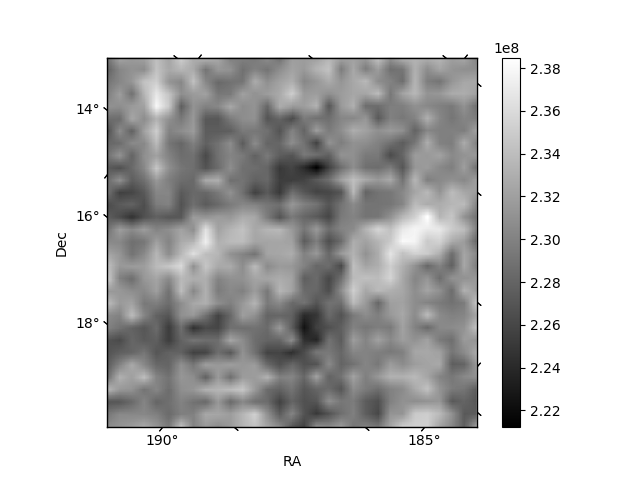
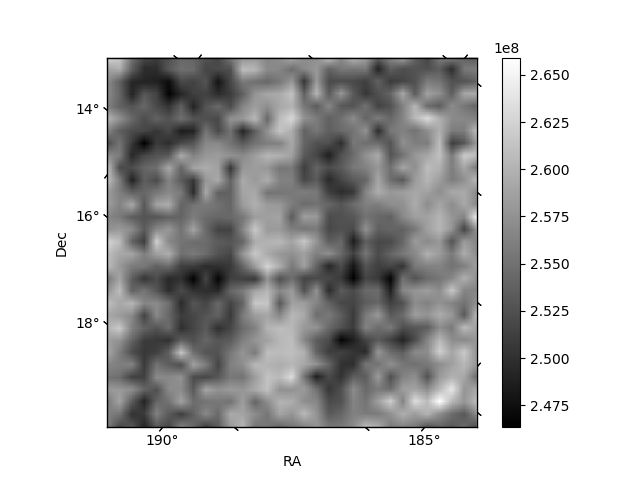
Histogram calculated using DETX and DETY for each event in the final _common_clean file
| Quadrant A |  |
 |
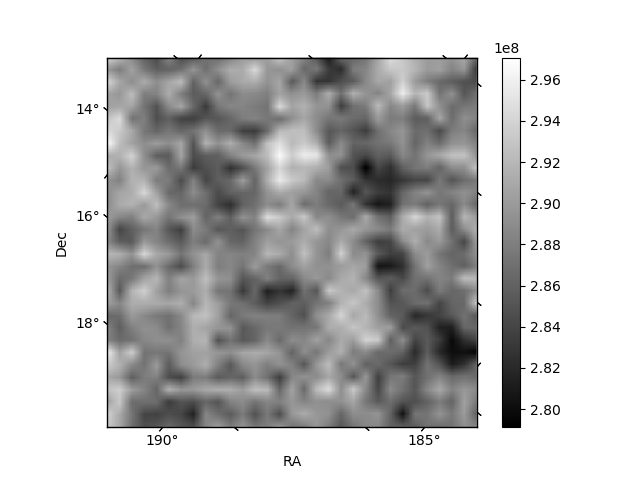
Quadrant B |
|---|---|---|---|
| Quadrant D |  |
 |
Quadrant C |
| Plot type | Count rate plots | Images |
|---|---|---|
| Comparison with Poisson distribution Blue bars denote a histogram of data divided into 1 sec bins. Red curve is a Poisson curve with rate = median count rate of data. |
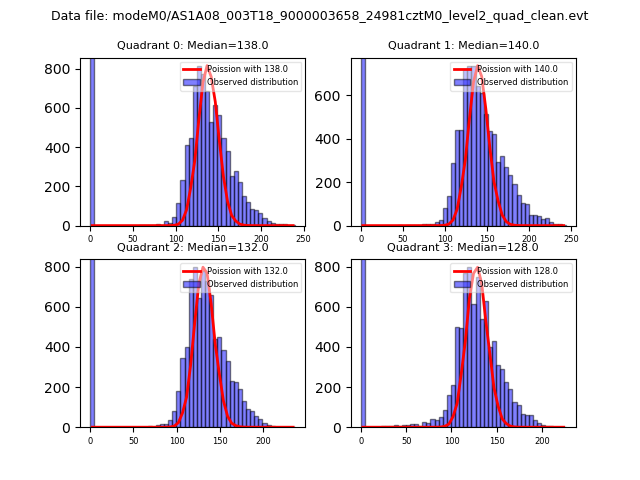 |
 |
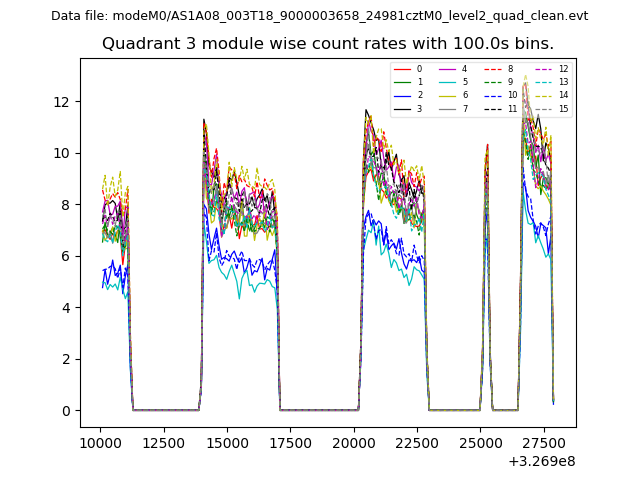
| Quadrant-wise count rates Data is divided into 100 sec bins |
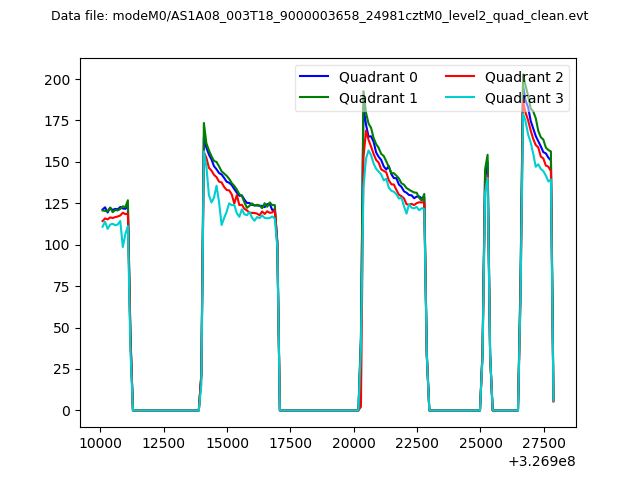 |
|
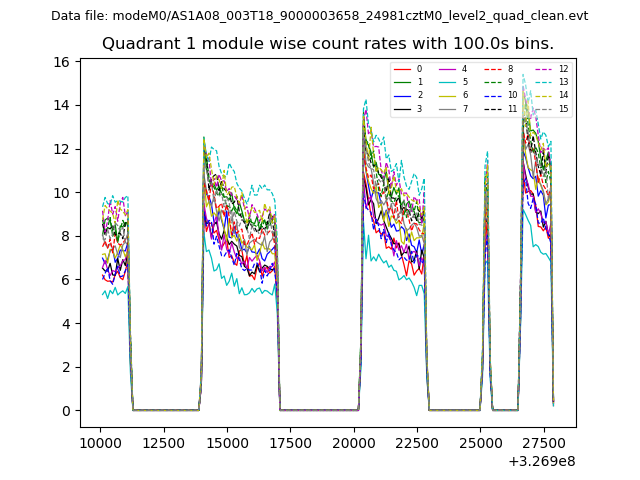
| Module-wise count rates for Quadrant A Data is divided into 100 sec bins |
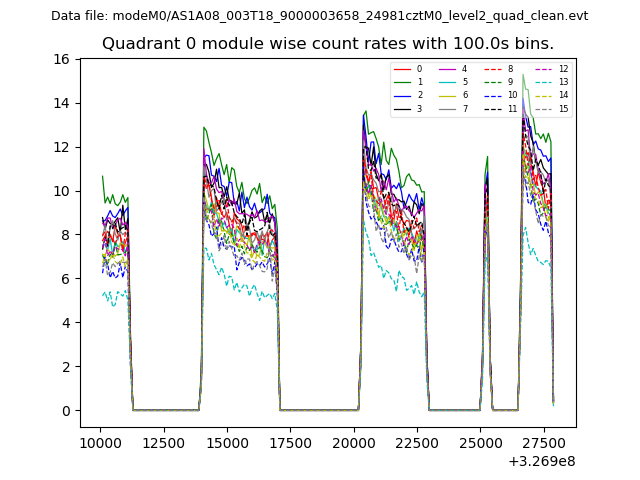 |
 |
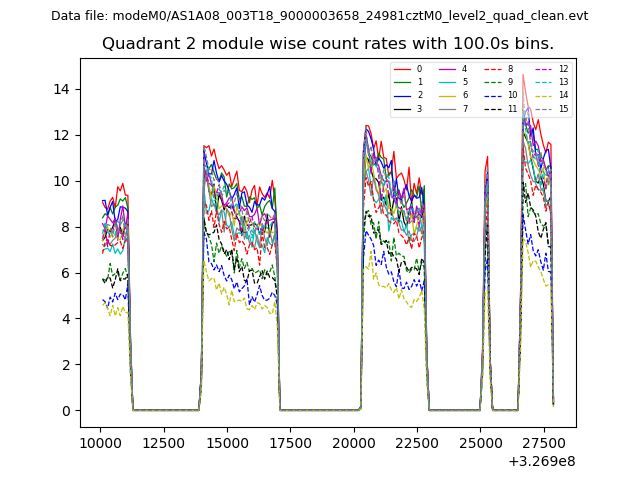
| Module-wise count rates for Quadrant B Data is divided into 100 sec bins |
 |
 |
| Module-wise count rates for Quadrant C Data is divided into 100 sec bins |
 |
 |
| Module-wise count rates for Quadrant D Data is divided into 100 sec bins |
 |
 |
| Parameter | Plot |
|---|---|
| CZT HV Monitor | 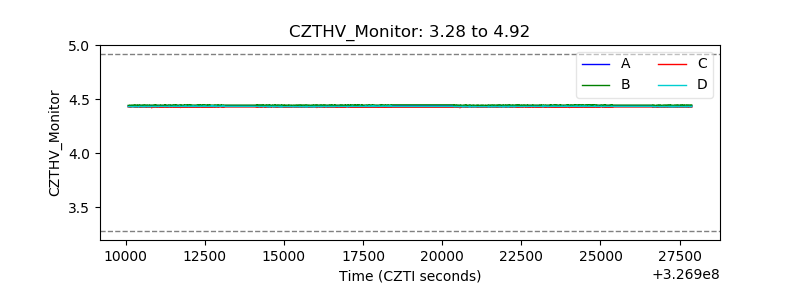 |
| D_VDD | 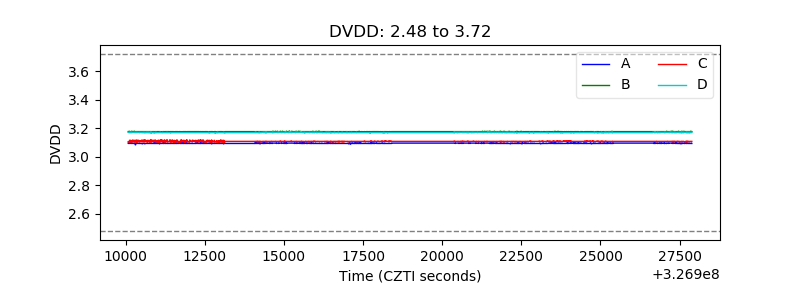 |
| Temperature 1 | 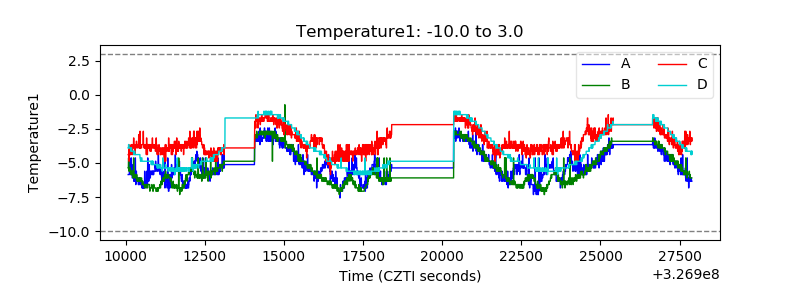 |
| Veto HV Monitor | 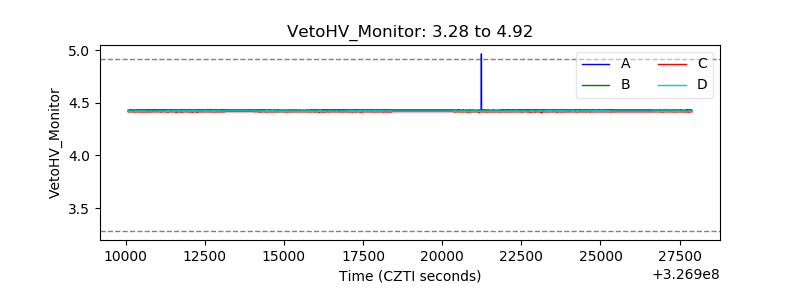 |
| Veto LLD | 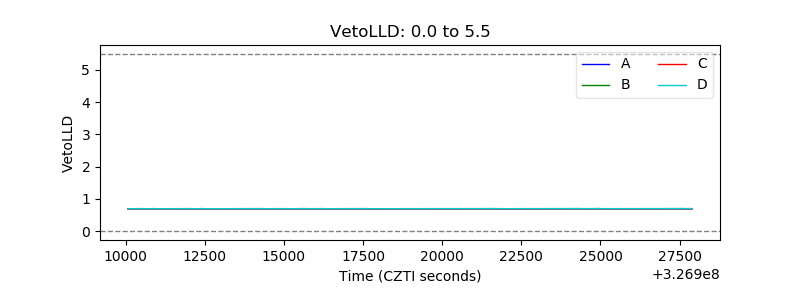 |
| Alpha Counter | 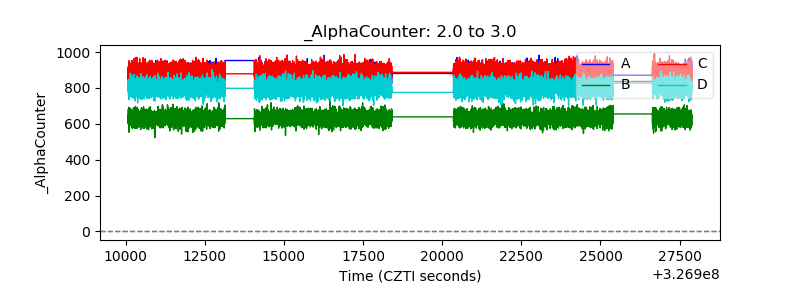 |
| _CPM_Rate | 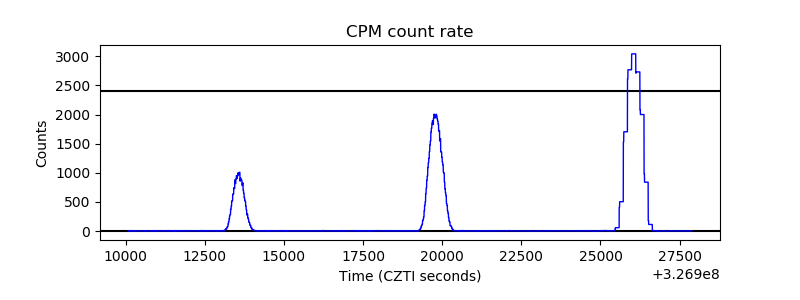 |
| CZT Counter |  |
| +2.5 Volts monitor |  |
| +5 Volts monitor |  |
| _ROLL_ROT | 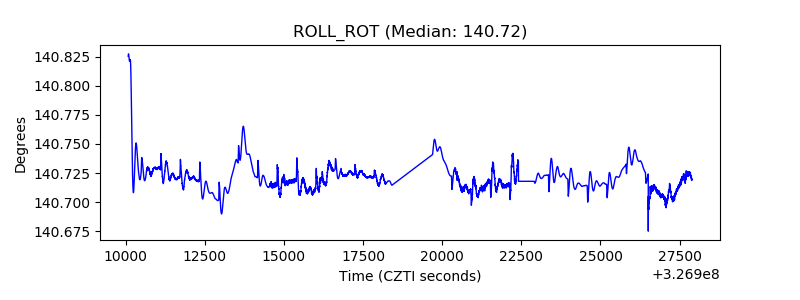 |
| _Roll_DEC | 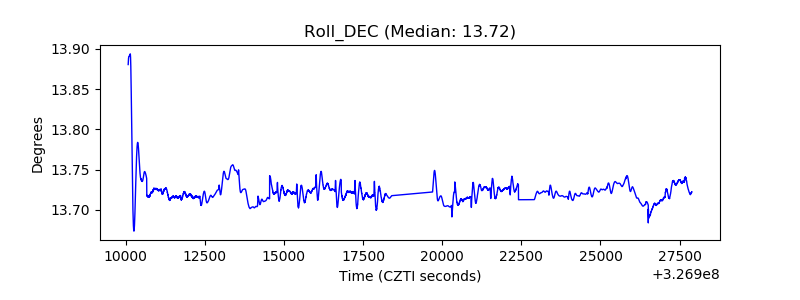 |
| _Roll_RA | 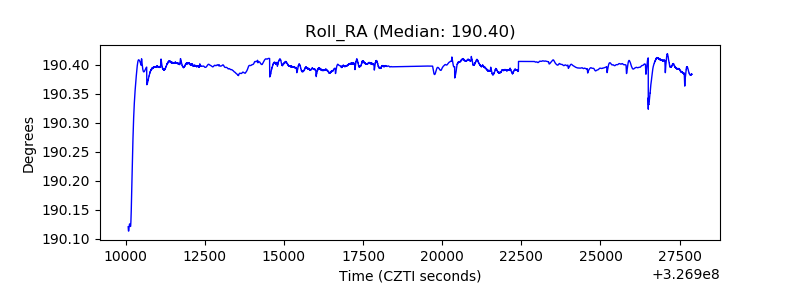 |
| Veto Counter | 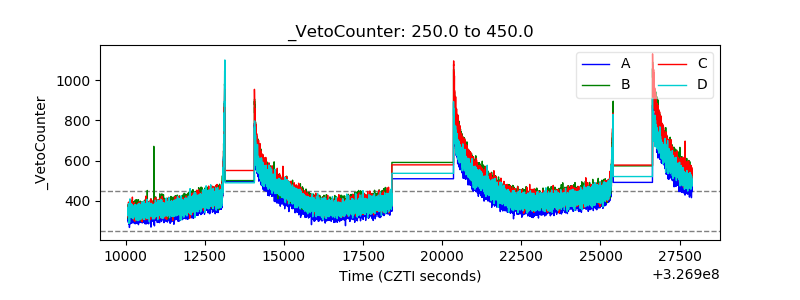 |