| Param | Original file | Final file |
|---|---|---|
| Filename | modeM0/AS1A08_003T18_9000003658_24982cztM0_level2.evt | modeM0/AS1A08_003T18_9000003658_24982cztM0_level2_quad_clean.evt |
| Size (bytes) | 468,639,360 | 97,617,600 |
| Size | 446.9 MB | 93.1 MB |
| Events in quadrant A | 3,198,989 | 643,856 |
| Events in quadrant B | 3,319,417 | 668,857 |
| Events in quadrant C | 3,291,362 | 617,751 |
| Events in quadrant D | 3,959,513 | 590,477 |
| Mode M9 | |||
|---|---|---|---|
| Quadrant | BADHDUFLAG | Total packets | Discarded packets |
| A | 0 | 16 | 0 |
| B | 0 | 17 | 0 |
| C | 0 | 17 | 0 |
| D | 0 | 17 | 0 |
| Mode SS | |||
|---|---|---|---|
| Quadrant | BADHDUFLAG | Total packets | Discarded packets |
| A | 0 | 126 | 0 |
| B | 0 | 126 | 0 |
| C | 0 | 126 | 0 |
| D | 0 | 126 | 0 |
| Mode M0 | |||
|---|---|---|---|
| Quadrant | BADHDUFLAG | Total packets | Discarded packets |
| A | 0 | 13362 | 2 |
| B | 0 | 13659 | 2 |
| C | 0 | 13608 | 2 |
| D | 0 | 15915 | 2 |
| Quadrant | Total seconds | Saturated seconds | Saturation percentage |
|---|---|---|---|
| A | 6243 | 50 | 0.800897% |
| B | 6243 | 58 | 0.929041% |
| C | 6243 | 88 | 1.409579% |
| D | 6243 | 102 | 1.633830% |
Noise dominated data is calculated using 1-second bins in cleaned event files. If a bin has >2000 counts, and if more than 50% of those come from <1% of pixels, then it is considered to be noise-dominated and hence unusable.
| Quadrant | # 1 sec bins | Bins with >0 counts | Bins with >2000 counts | High rate bins dominated by noise | Noise dominated (total time) | Noise dominated (detector-on time) | Marked lightcurve |
|---|---|---|---|---|---|---|---|
| A | 7563 | 6244 | 0 | 0 | 0.00% | 0.00% | 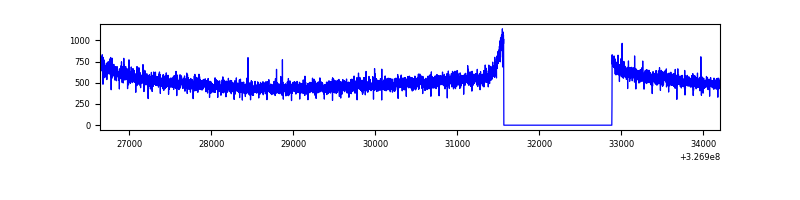 |
| B | 7563 | 6244 | 1 | 1 | 0.01% | 0.02% | 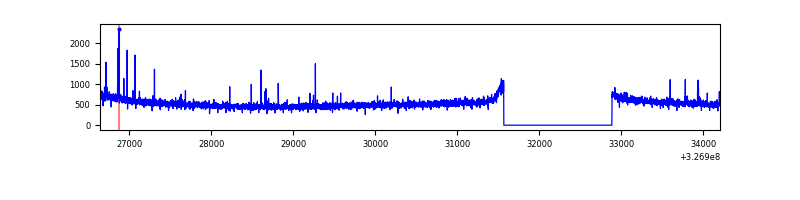 |
| C | 7563 | 6244 | 4 | 4 | 0.05% | 0.06% | 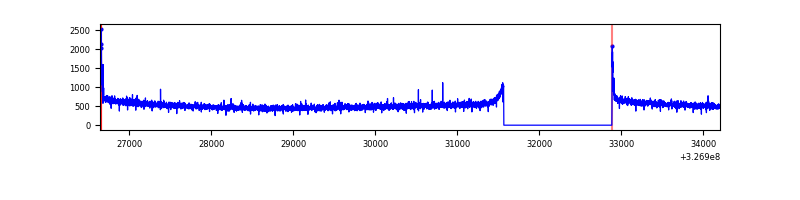 |
| D | 7563 | 6244 | 59 | 59 | 0.78% | 0.94% | 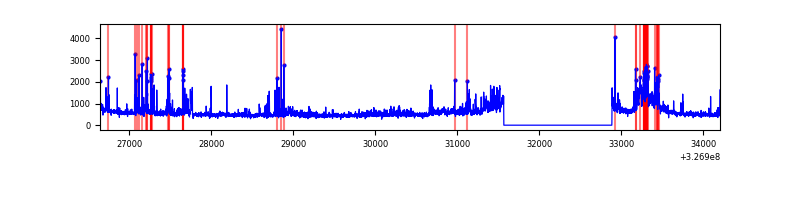 |
Top three noisy pixels from each quadrant. If the there are fewer than three noisy pixels in the level2.evt file, extra rows are filled as -1
| Pixel properties | Quadrant properties | ||||||
|---|---|---|---|---|---|---|---|
| Quadrant | DetID | PixID | Counts | Sigma | Mean | Median | Sigma |
| A | 13 | 254 | 8779 | 48.17 | 830 | 815 | 165.3 |
| A | 0 | 226 | 7230 | 38.8 | 830 | 815 | 165.3 |
| A | 3 | 137 | 7229 | 38.79 | 830 | 815 | 165.3 |
| B | 10 | 246 | 25561 | 160.2 | 831 | 812 | 154.5 |
| B | 12 | 111 | 18211 | 112.63 | 831 | 812 | 154.5 |
| B | 11 | 111 | 16431 | 101.1 | 831 | 812 | 154.5 |
| C | 14 | 238 | 128912 | 693.25 | 796 | 804 | 184.8 |
| C | 0 | 10 | 46226 | 245.8 | 796 | 804 | 184.8 |
| C | 3 | 233 | 7899 | 38.39 | 796 | 804 | 184.8 |
| D | 10 | 70 | 407680 | 2133.51 | 793 | 772 | 190.7 |
| D | 7 | 238 | 192177 | 1003.58 | 793 | 772 | 190.7 |
| D | 1 | 52 | 164927 | 860.7 | 793 | 772 | 190.7 |
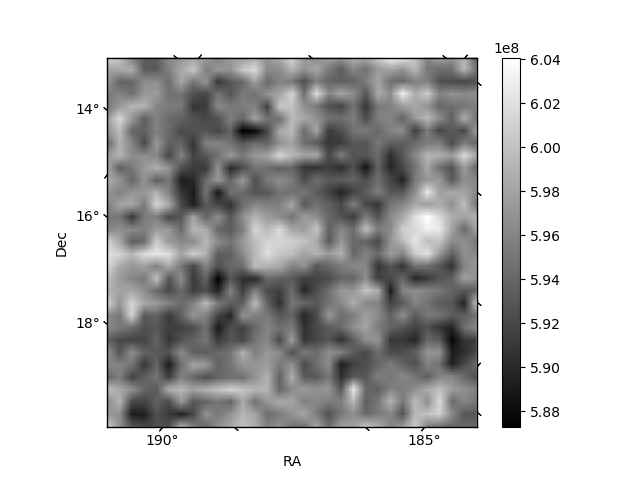
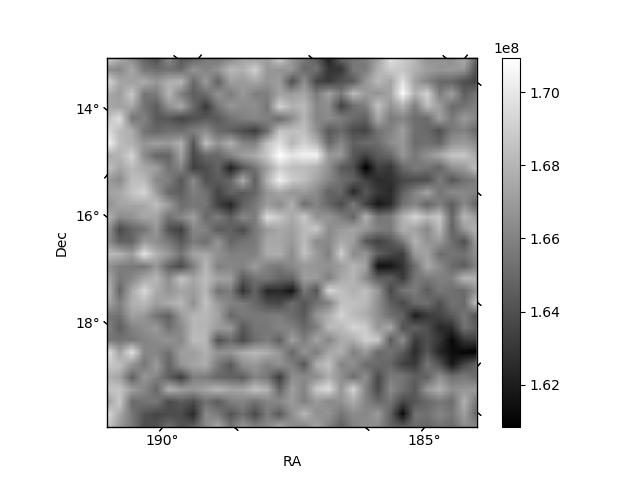
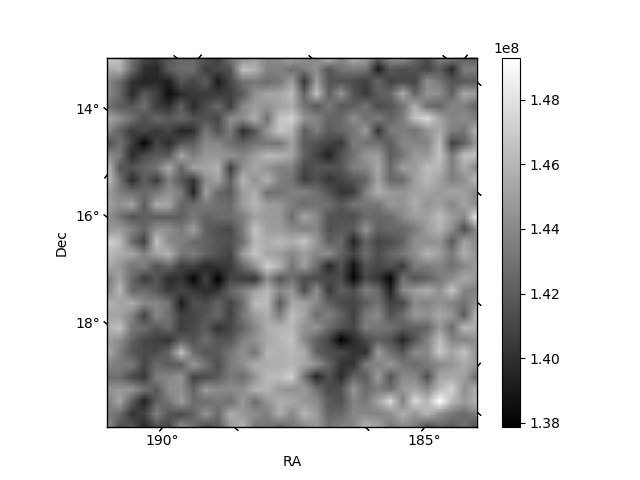
Histogram calculated using DETX and DETY for each event in the final _common_clean file
| Quadrant A |  |
 |
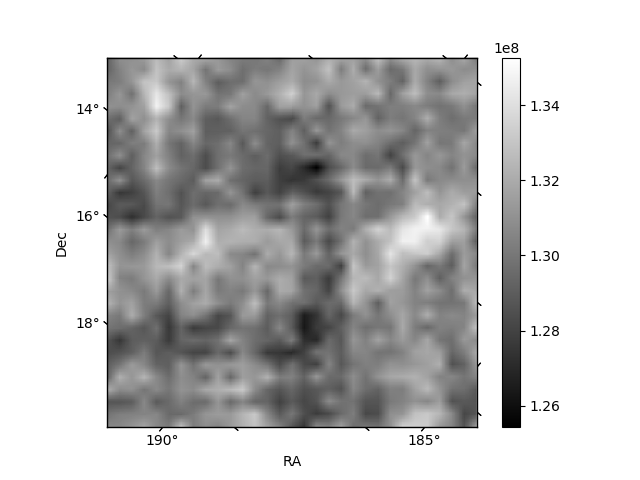
Quadrant B |
|---|---|---|---|
| Quadrant D |  |
 |
Quadrant C |
| Plot type | Count rate plots | Images |
|---|---|---|
| Comparison with Poisson distribution Blue bars denote a histogram of data divided into 1 sec bins. Red curve is a Poisson curve with rate = median count rate of data. |
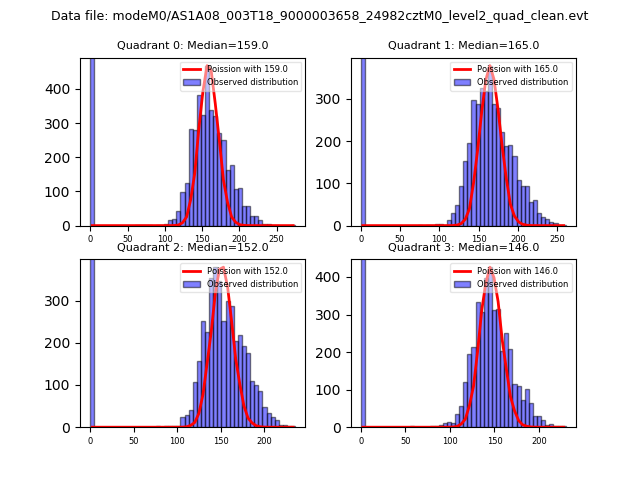 |
 |
| Quadrant-wise count rates Data is divided into 100 sec bins |
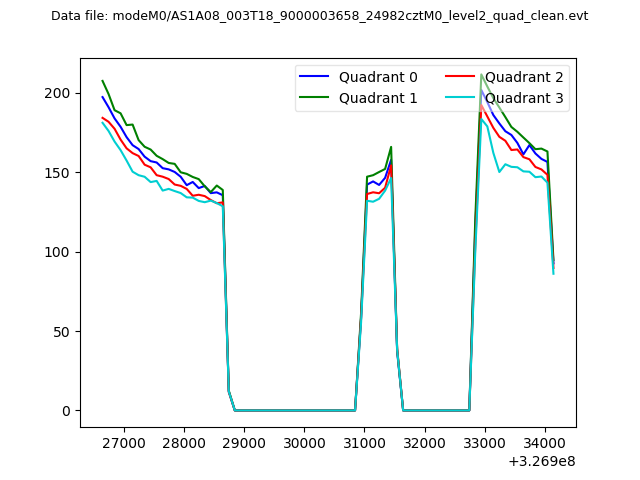 |
|
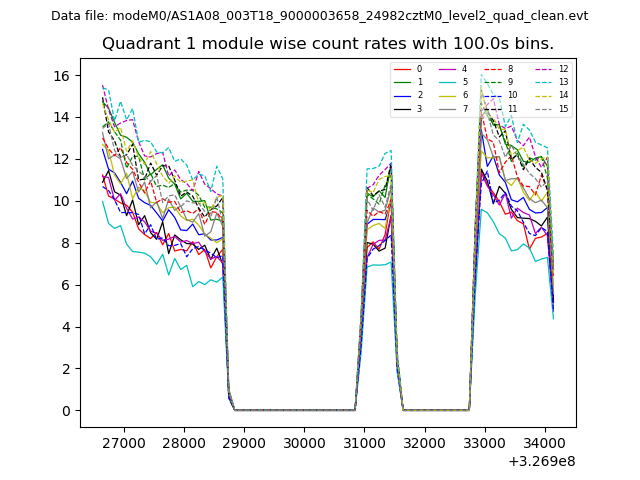
| Module-wise count rates for Quadrant A Data is divided into 100 sec bins |
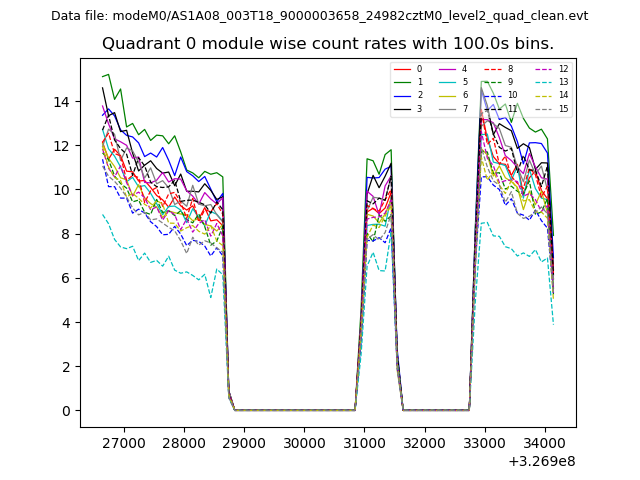 |
 |
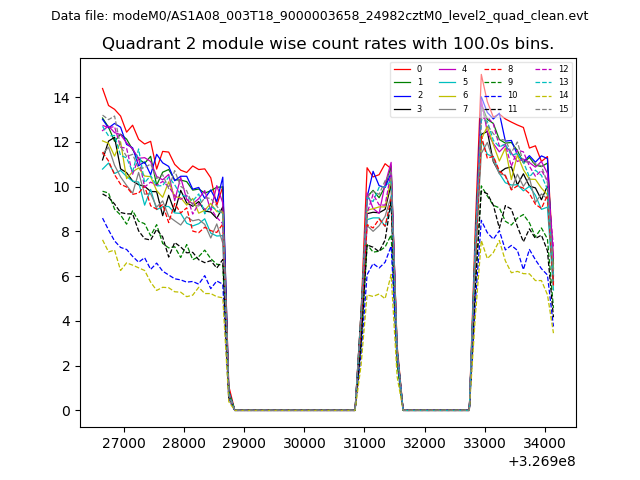
| Module-wise count rates for Quadrant B Data is divided into 100 sec bins |
 |
 |
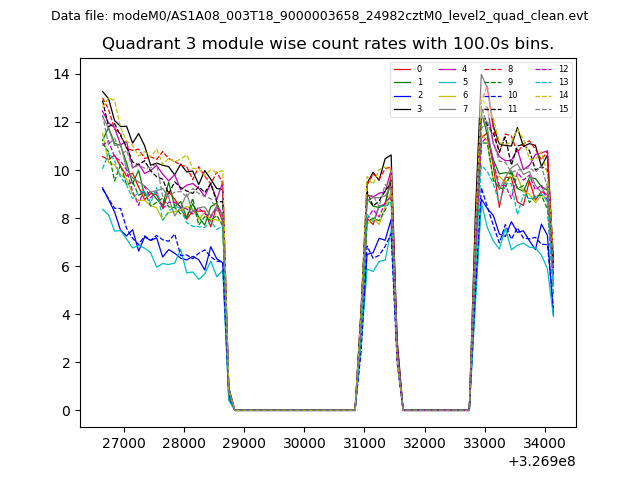
| Module-wise count rates for Quadrant C Data is divided into 100 sec bins |
 |
 |
| Module-wise count rates for Quadrant D Data is divided into 100 sec bins |
 |
 |
| Parameter | Plot |
|---|---|
| CZT HV Monitor | 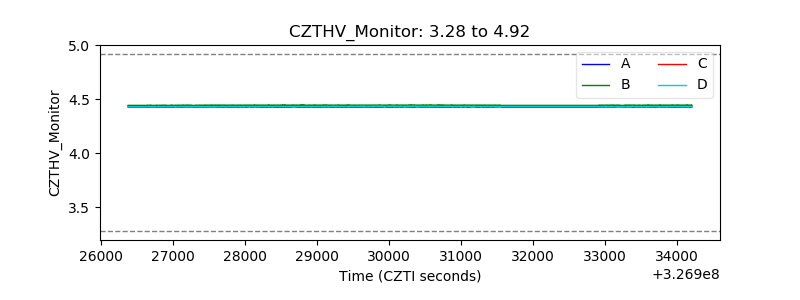 |
| D_VDD | 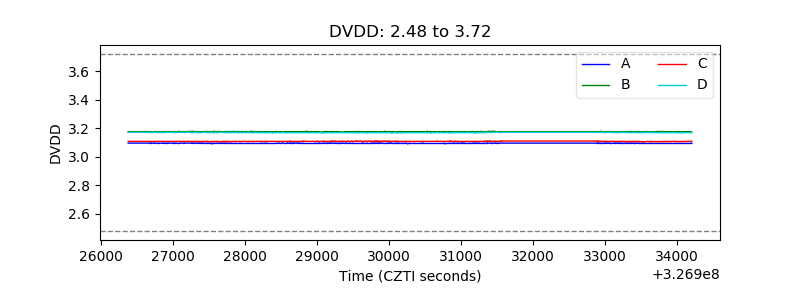 |
| Temperature 1 | 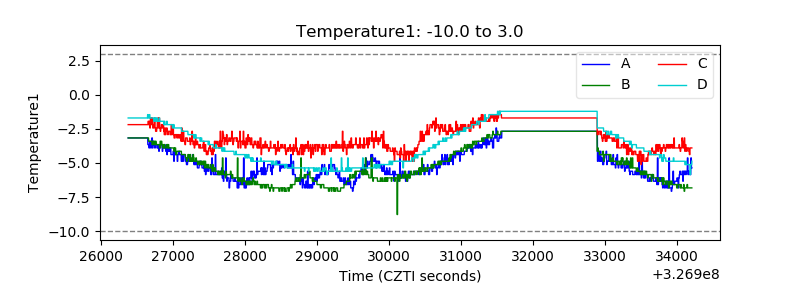 |
| Veto HV Monitor | 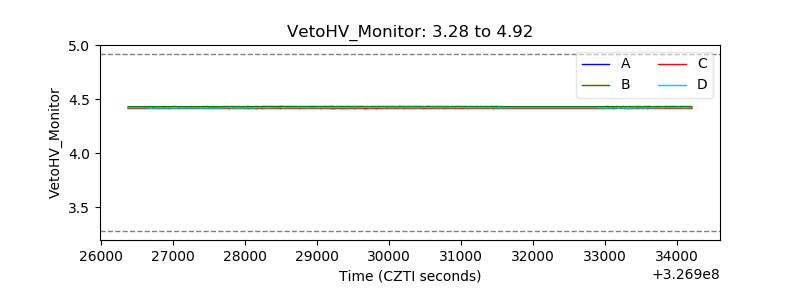 |
| Veto LLD | 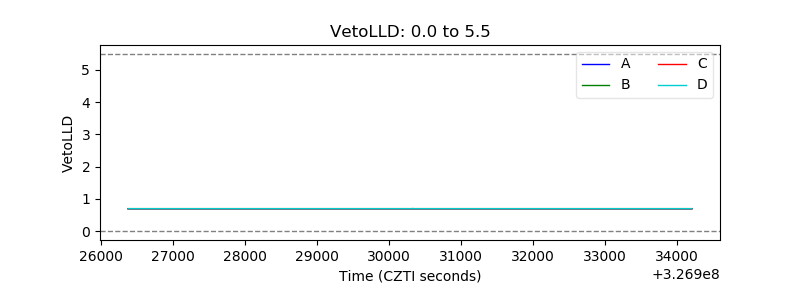 |
| Alpha Counter | 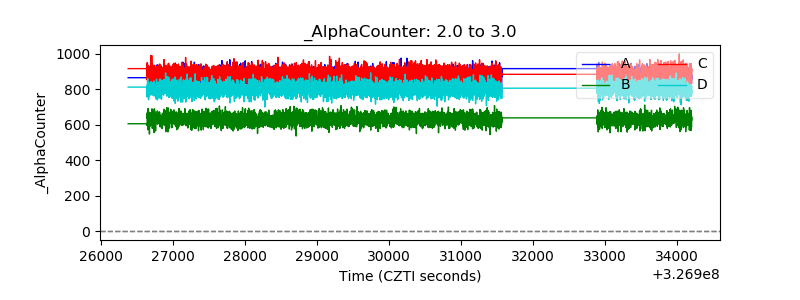 |
| _CPM_Rate | 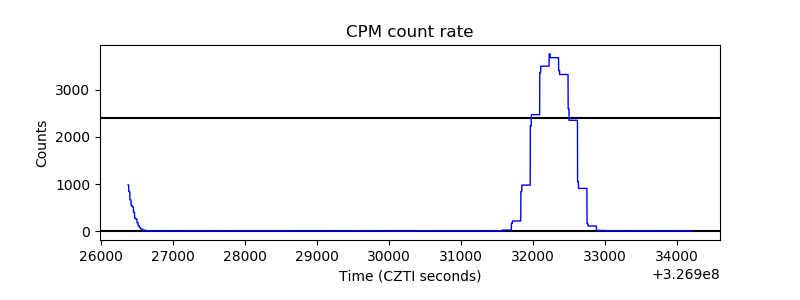 |
| CZT Counter |  |
| +2.5 Volts monitor |  |
| +5 Volts monitor |  |
| _ROLL_ROT | 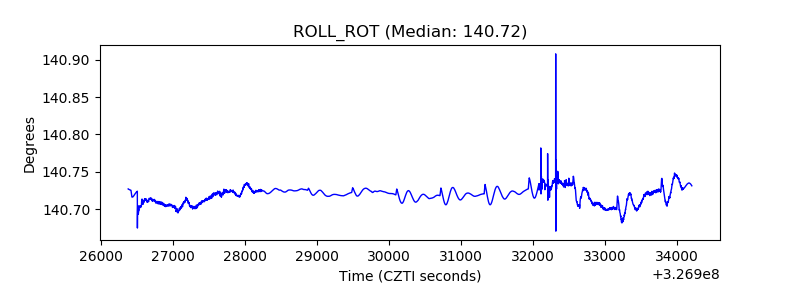 |
| _Roll_DEC | 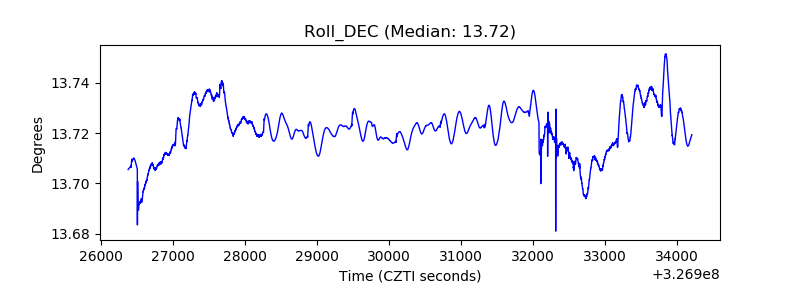 |
| _Roll_RA | 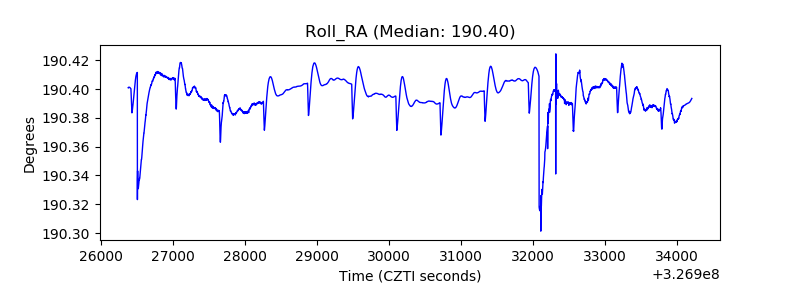 |
| Veto Counter | 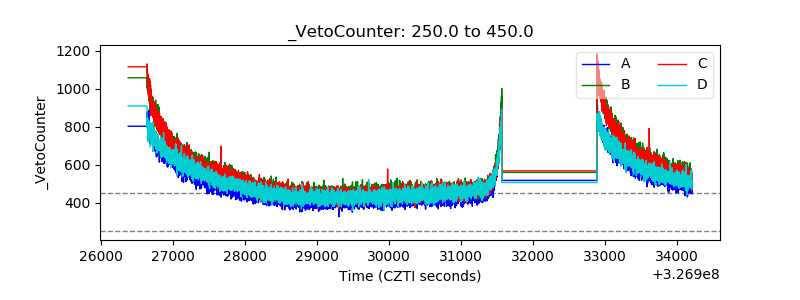 |