| Param | Original file | Final file |
|---|---|---|
| Filename | modeM0/AS1A08_003T18_9000003658_24983cztM0_level2.evt | modeM0/AS1A08_003T18_9000003658_24983cztM0_level2_quad_clean.evt |
| Size (bytes) | 471,093,120 | 95,549,760 |
| Size | 449.3 MB | 91.1 MB |
| Events in quadrant A | 3,171,168 | 634,731 |
| Events in quadrant B | 3,332,074 | 657,569 |
| Events in quadrant C | 3,671,100 | 597,883 |
| Events in quadrant D | 3,679,555 | 578,516 |
| Mode M9 | |||
|---|---|---|---|
| Quadrant | BADHDUFLAG | Total packets | Discarded packets |
| A | 0 | 16 | 0 |
| B | 0 | 17 | 0 |
| C | 0 | 17 | 0 |
| D | 0 | 17 | 0 |
| Mode SS | |||
|---|---|---|---|
| Quadrant | BADHDUFLAG | Total packets | Discarded packets |
| A | 0 | 124 | 0 |
| B | 0 | 124 | 0 |
| C | 0 | 124 | 0 |
| D | 0 | 124 | 0 |
| Mode M0 | |||
|---|---|---|---|
| Quadrant | BADHDUFLAG | Total packets | Discarded packets |
| A | 0 | 13038 | 2 |
| B | 0 | 13482 | 2 |
| C | 0 | 14666 | 2 |
| D | 0 | 14850 | 2 |
| Quadrant | Total seconds | Saturated seconds | Saturation percentage |
|---|---|---|---|
| A | 6086 | 30 | 0.492935% |
| B | 6086 | 45 | 0.739402% |
| C | 6086 | 210 | 3.450542% |
| D | 6086 | 55 | 0.903713% |
Noise dominated data is calculated using 1-second bins in cleaned event files. If a bin has >2000 counts, and if more than 50% of those come from <1% of pixels, then it is considered to be noise-dominated and hence unusable.
| Quadrant | # 1 sec bins | Bins with >0 counts | Bins with >2000 counts | High rate bins dominated by noise | Noise dominated (total time) | Noise dominated (detector-on time) | Marked lightcurve |
|---|---|---|---|---|---|---|---|
| A | 7496 | 6087 | 0 | 0 | 0.00% | 0.00% | 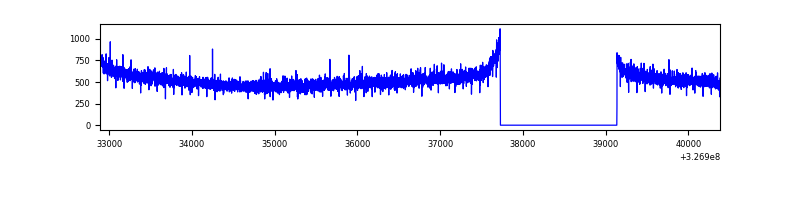 |
| B | 7496 | 6087 | 5 | 5 | 0.07% | 0.08% | 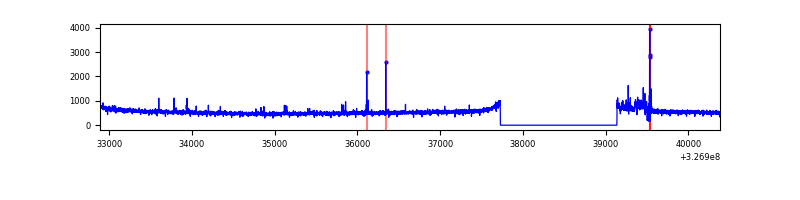 |
| C | 7496 | 6087 | 114 | 114 | 1.52% | 1.87% | 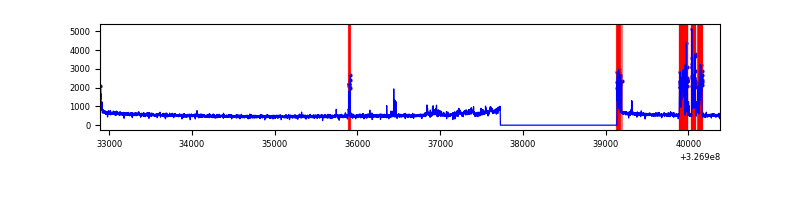 |
| D | 7496 | 6087 | 42 | 42 | 0.56% | 0.69% | 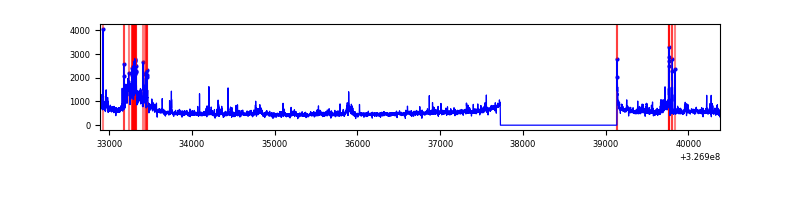 |
Top three noisy pixels from each quadrant. If the there are fewer than three noisy pixels in the level2.evt file, extra rows are filled as -1
| Pixel properties | Quadrant properties | ||||||
|---|---|---|---|---|---|---|---|
| Quadrant | DetID | PixID | Counts | Sigma | Mean | Median | Sigma |
| A | 13 | 254 | 8672 | 48.02 | 823 | 811 | 163.7 |
| A | 0 | 226 | 7025 | 37.96 | 823 | 811 | 163.7 |
| A | 3 | 137 | 6976 | 37.66 | 823 | 811 | 163.7 |
| B | 3 | 64 | 71856 | 458.36 | 823 | 806 | 155.0 |
| B | 12 | 111 | 18026 | 111.09 | 823 | 806 | 155.0 |
| B | 10 | 246 | 17989 | 110.85 | 823 | 806 | 155.0 |
| C | 2 | 16 | 351474 | 1938.01 | 778 | 787 | 181.0 |
| C | 14 | 238 | 125642 | 689.99 | 778 | 787 | 181.0 |
| C | 7 | 247 | 86529 | 473.84 | 778 | 787 | 181.0 |
| D | 10 | 70 | 253350 | 1334.77 | 780 | 760 | 189.2 |
| D | 7 | 238 | 189680 | 998.31 | 780 | 760 | 189.2 |
| D | 1 | 52 | 112397 | 589.93 | 780 | 760 | 189.2 |
Histogram calculated using DETX and DETY for each event in the final _common_clean file
| Quadrant A |  |
 |
Quadrant B |
|---|---|---|---|
| Quadrant D | 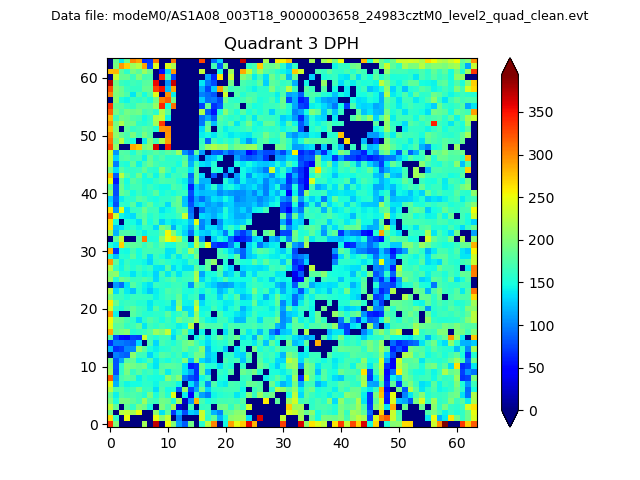 |
 |
Quadrant C |
| Plot type | Count rate plots | Images |
|---|---|---|
| Comparison with Poisson distribution Blue bars denote a histogram of data divided into 1 sec bins. Red curve is a Poisson curve with rate = median count rate of data. |
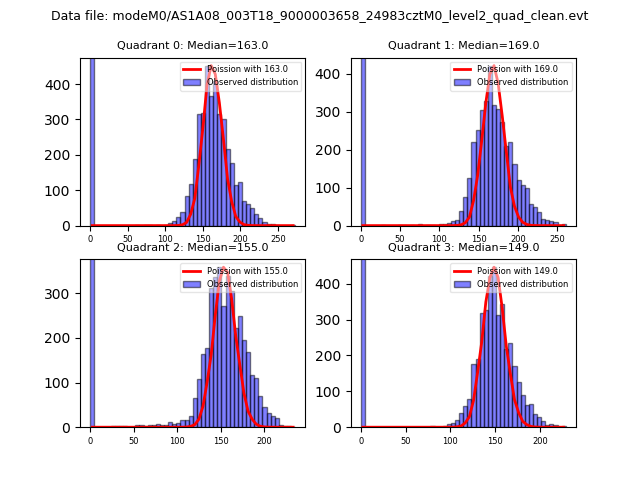 |
 |
| Quadrant-wise count rates Data is divided into 100 sec bins |
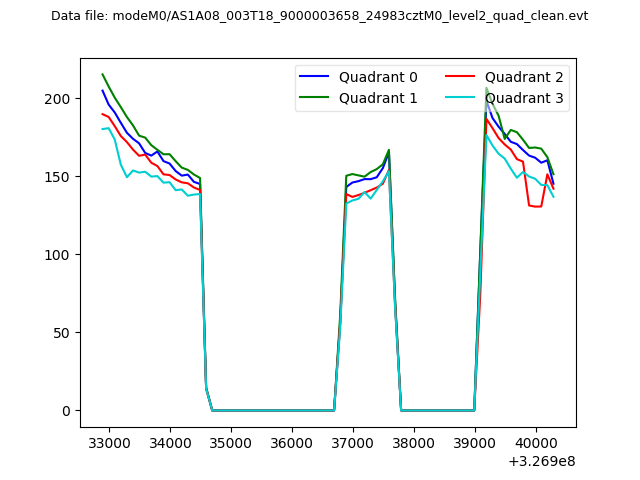 |
|
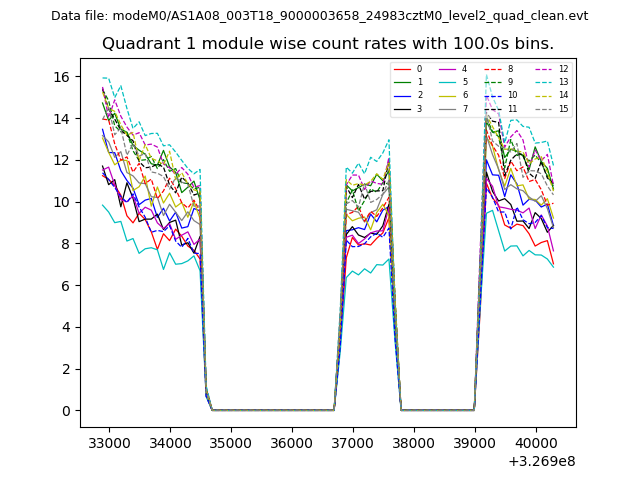
| Module-wise count rates for Quadrant A Data is divided into 100 sec bins |
 |
 |
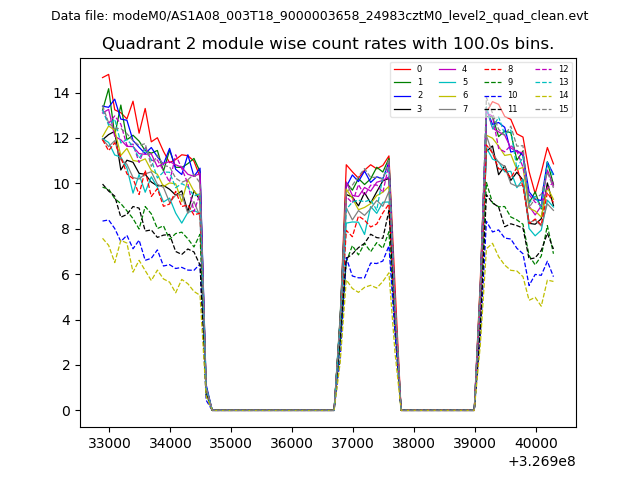
| Module-wise count rates for Quadrant B Data is divided into 100 sec bins |
 |
 |
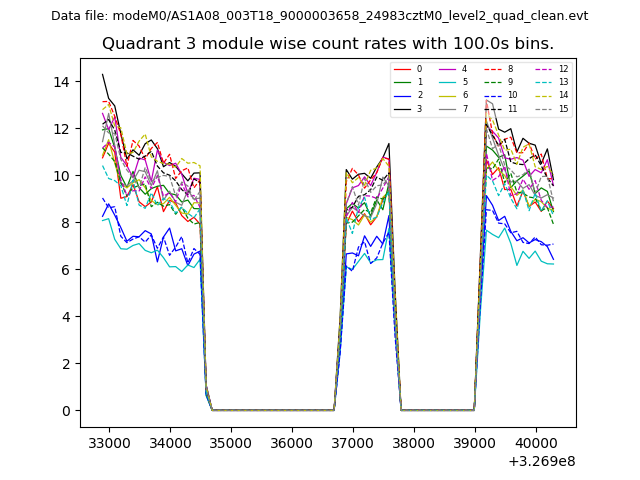
| Module-wise count rates for Quadrant C Data is divided into 100 sec bins |
 |
 |
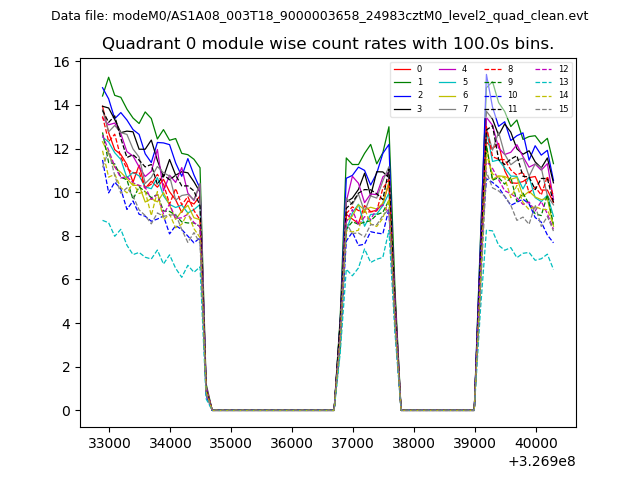
| Module-wise count rates for Quadrant D Data is divided into 100 sec bins |
 |
 |
| Parameter | Plot |
|---|---|
| CZT HV Monitor | 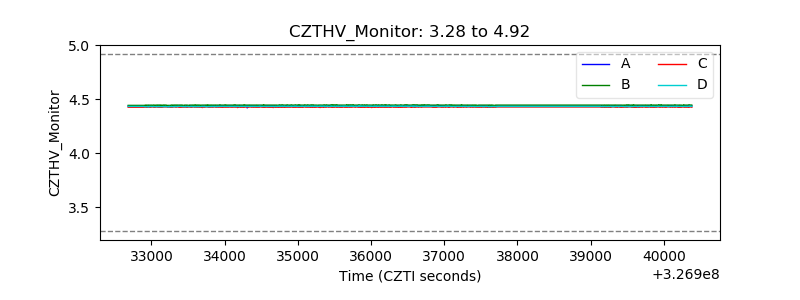 |
| D_VDD | 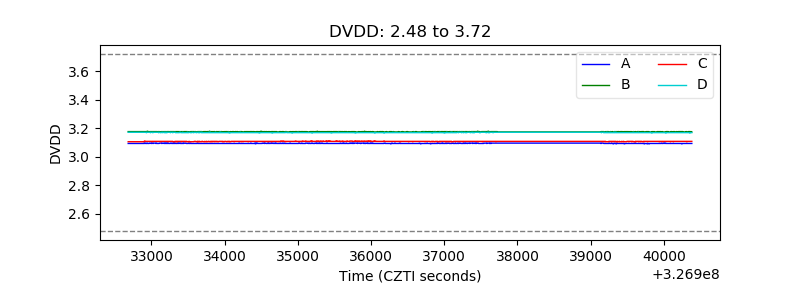 |
| Temperature 1 | 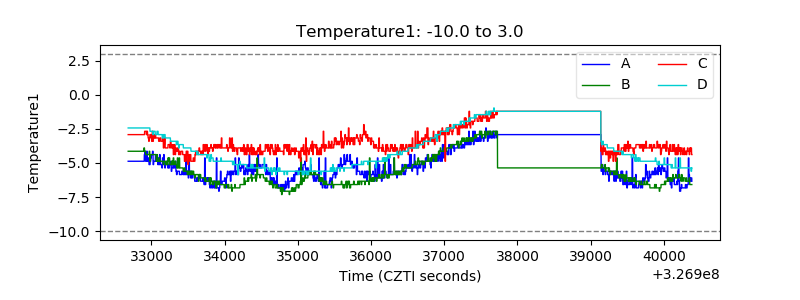 |
| Veto HV Monitor | 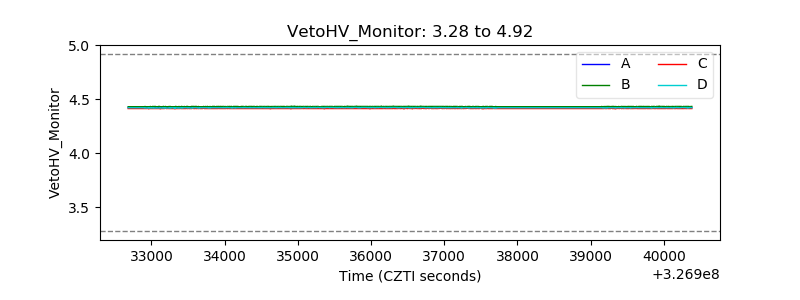 |
| Veto LLD | 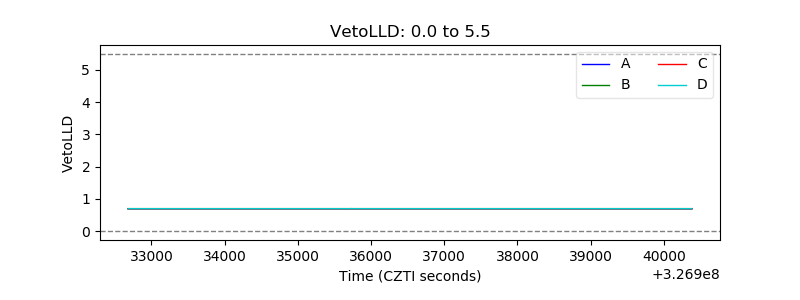 |
| Alpha Counter | 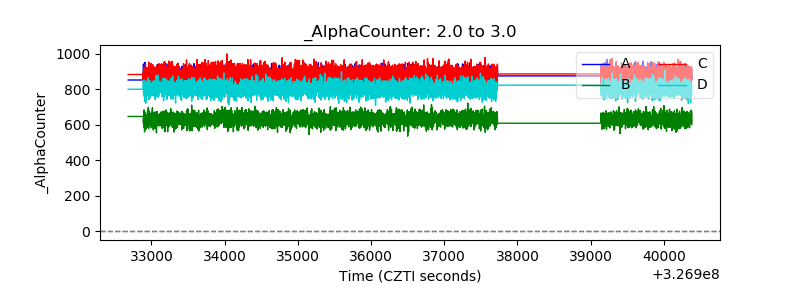 |
| _CPM_Rate | 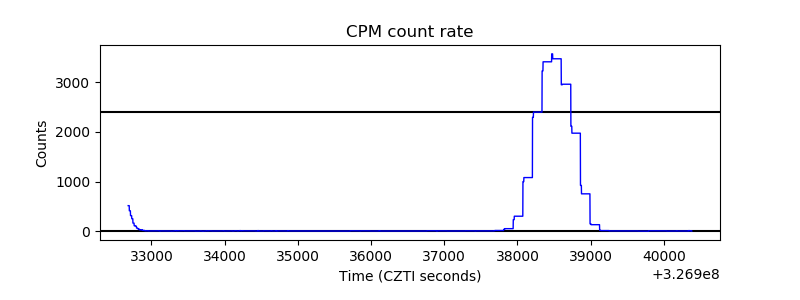 |
| CZT Counter |  |
| +2.5 Volts monitor |  |
| +5 Volts monitor |  |
| _ROLL_ROT | 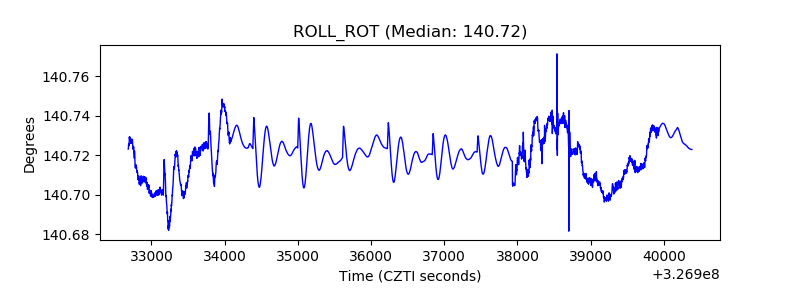 |
| _Roll_DEC | 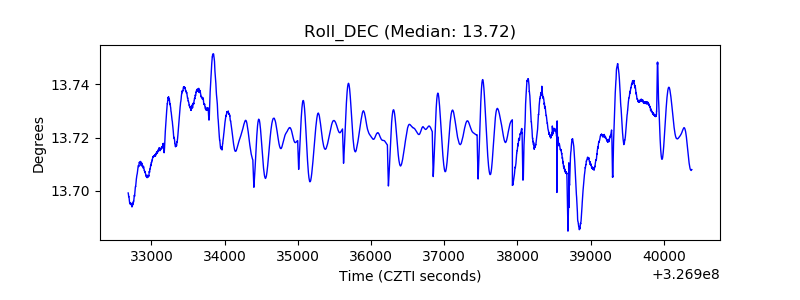 |
| _Roll_RA |  |
| Veto Counter | 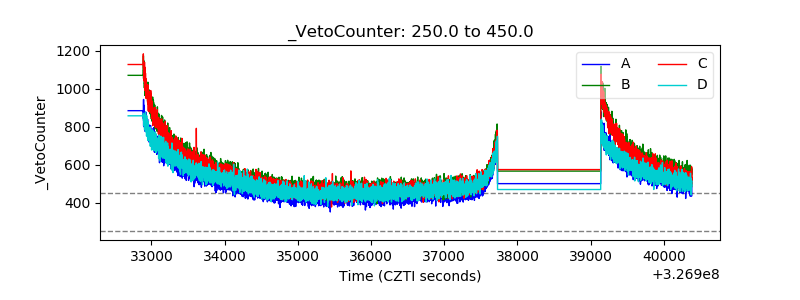 |