| Param | Original file | Final file |
|---|---|---|
| Filename | modeM0/AS1A08_003T18_9000003658_24984cztM0_level2.evt | modeM0/AS1A08_003T18_9000003658_24984cztM0_level2_quad_clean.evt |
| Size (bytes) | 469,486,080 | 86,379,840 |
| Size | 447.7 MB | 82.4 MB |
| Events in quadrant A | 3,167,730 | 563,182 |
| Events in quadrant B | 3,343,874 | 583,215 |
| Events in quadrant C | 3,615,899 | 527,940 |
| Events in quadrant D | 3,674,127 | 512,693 |
| Mode M9 | |||
|---|---|---|---|
| Quadrant | BADHDUFLAG | Total packets | Discarded packets |
| A | 0 | 17 | 0 |
| B | 0 | 18 | 0 |
| C | 0 | 18 | 0 |
| D | 0 | 18 | 0 |
| Mode SS | |||
|---|---|---|---|
| Quadrant | BADHDUFLAG | Total packets | Discarded packets |
| A | 0 | 126 | 0 |
| B | 0 | 126 | 0 |
| C | 0 | 126 | 0 |
| D | 0 | 126 | 0 |
| Mode M0 | |||
|---|---|---|---|
| Quadrant | BADHDUFLAG | Total packets | Discarded packets |
| A | 0 | 12972 | 3 |
| B | 0 | 13454 | 2 |
| C | 0 | 14294 | 2 |
| D | 0 | 15009 | 2 |
| Quadrant | Total seconds | Saturated seconds | Saturation percentage |
|---|---|---|---|
| A | 6137 | 14 | 0.228124% |
| B | 6137 | 43 | 0.700668% |
| C | 6137 | 194 | 3.161154% |
| D | 6137 | 67 | 1.091739% |
Noise dominated data is calculated using 1-second bins in cleaned event files. If a bin has >2000 counts, and if more than 50% of those come from <1% of pixels, then it is considered to be noise-dominated and hence unusable.
| Quadrant | # 1 sec bins | Bins with >0 counts | Bins with >2000 counts | High rate bins dominated by noise | Noise dominated (total time) | Noise dominated (detector-on time) | Marked lightcurve |
|---|---|---|---|---|---|---|---|
| A | 7562 | 6138 | 0 | 0 | 0.00% | 0.00% | 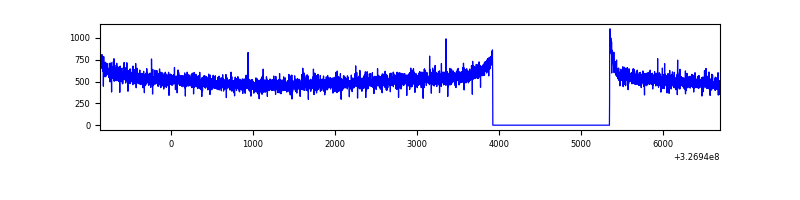 |
| B | 7562 | 6138 | 5 | 5 | 0.07% | 0.08% | 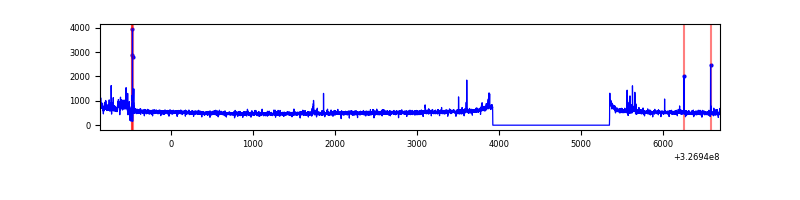 |
| C | 7562 | 6138 | 107 | 107 | 1.41% | 1.74% | 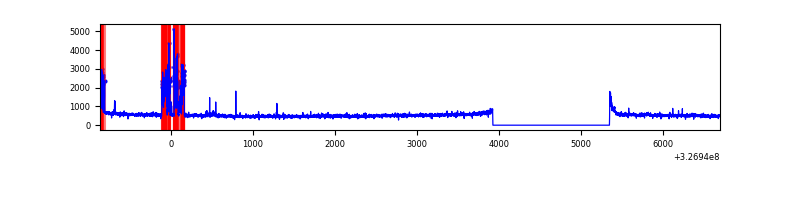 |
| D | 7562 | 6138 | 37 | 37 | 0.49% | 0.60% | 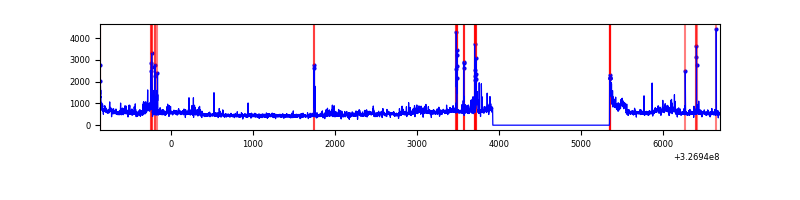 |
Top three noisy pixels from each quadrant. If the there are fewer than three noisy pixels in the level2.evt file, extra rows are filled as -1
| Pixel properties | Quadrant properties | ||||||
|---|---|---|---|---|---|---|---|
| Quadrant | DetID | PixID | Counts | Sigma | Mean | Median | Sigma |
| A | 13 | 254 | 8239 | 45.44 | 822 | 807 | 163.6 |
| A | 0 | 226 | 7117 | 38.58 | 822 | 807 | 163.6 |
| A | 3 | 137 | 6989 | 37.8 | 822 | 807 | 163.6 |
| B | 3 | 64 | 89151 | 572.01 | 823 | 804 | 154.4 |
| B | 12 | 111 | 18308 | 113.33 | 823 | 804 | 154.4 |
| B | 0 | 190 | 17323 | 106.95 | 823 | 804 | 154.4 |
| C | 2 | 16 | 354759 | 1953.17 | 776 | 783 | 181.2 |
| C | 14 | 238 | 125788 | 689.75 | 776 | 783 | 181.2 |
| C | 0 | 10 | 70137 | 382.68 | 776 | 783 | 181.2 |
| D | 7 | 238 | 349253 | 1866.01 | 774 | 754 | 186.8 |
| D | 2 | 244 | 147470 | 785.58 | 774 | 754 | 186.8 |
| D | 10 | 70 | 131161 | 698.25 | 774 | 754 | 186.8 |
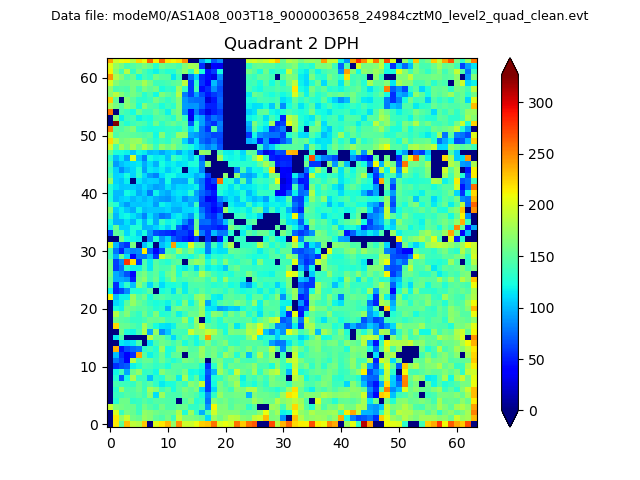
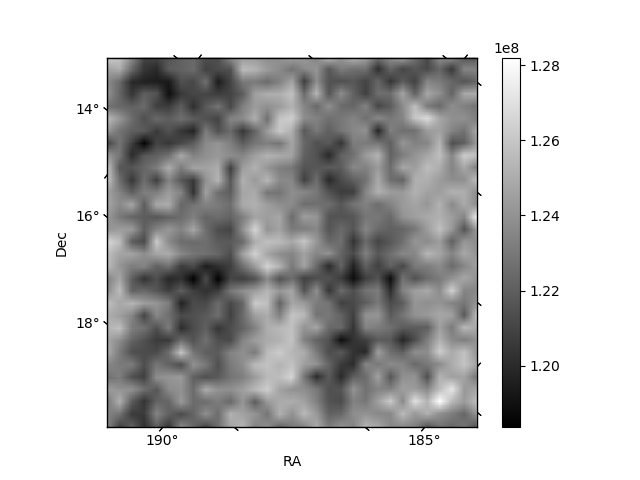
Histogram calculated using DETX and DETY for each event in the final _common_clean file
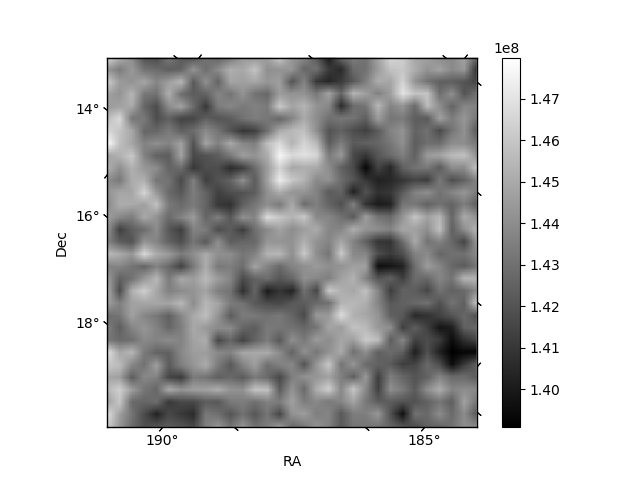
| Quadrant A | 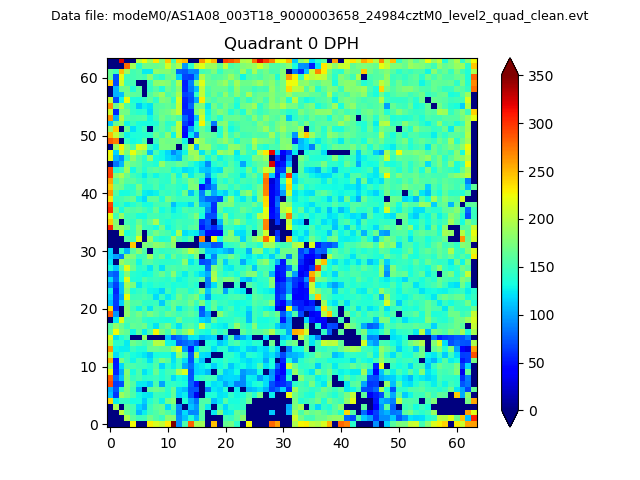 |
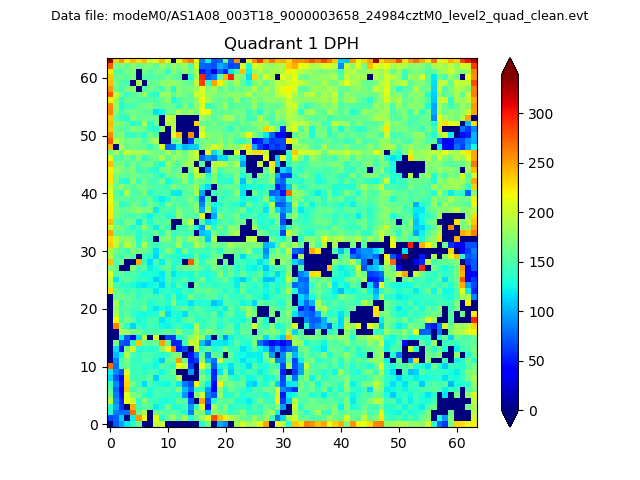 |
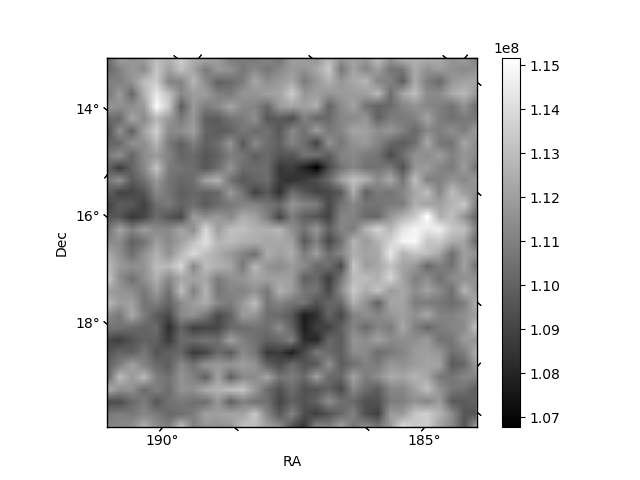
Quadrant B |
|---|---|---|---|
| Quadrant D | 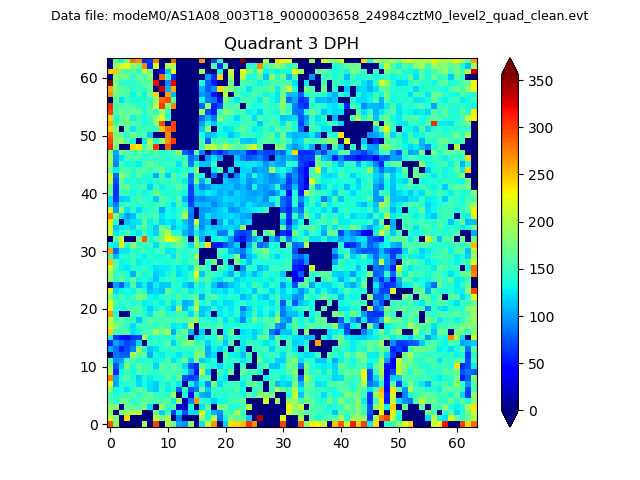 |
 |
Quadrant C |
| Plot type | Count rate plots | Images |
|---|---|---|
| Comparison with Poisson distribution Blue bars denote a histogram of data divided into 1 sec bins. Red curve is a Poisson curve with rate = median count rate of data. |
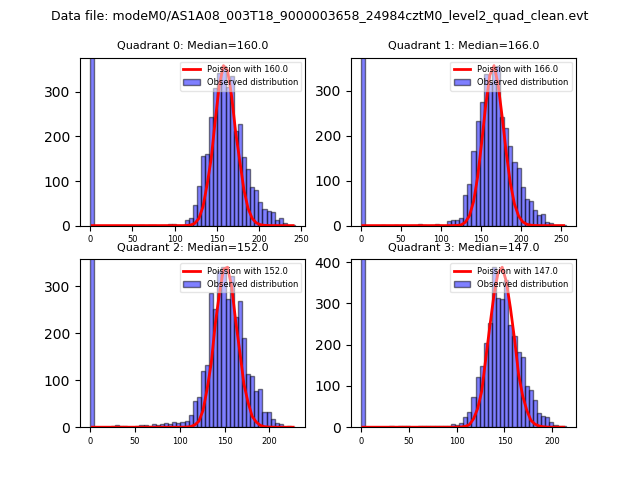 |
 |
| Quadrant-wise count rates Data is divided into 100 sec bins |
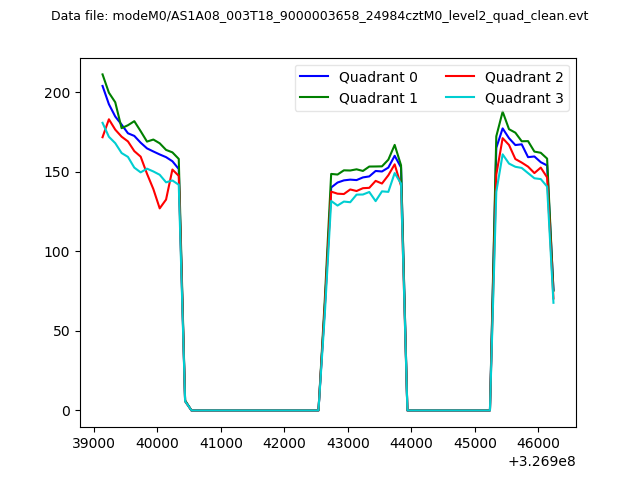 |
|
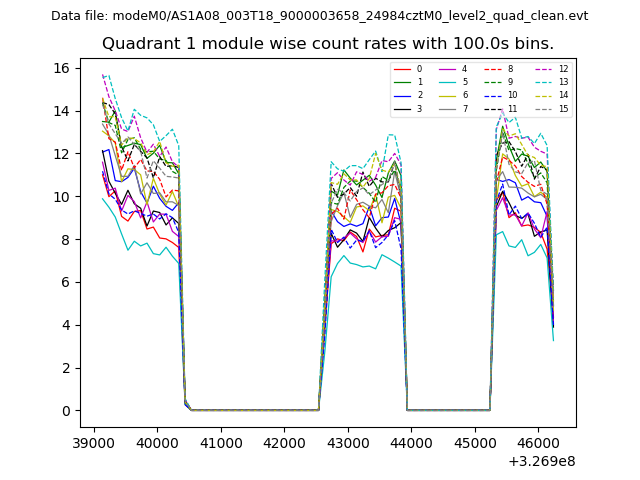
| Module-wise count rates for Quadrant A Data is divided into 100 sec bins |
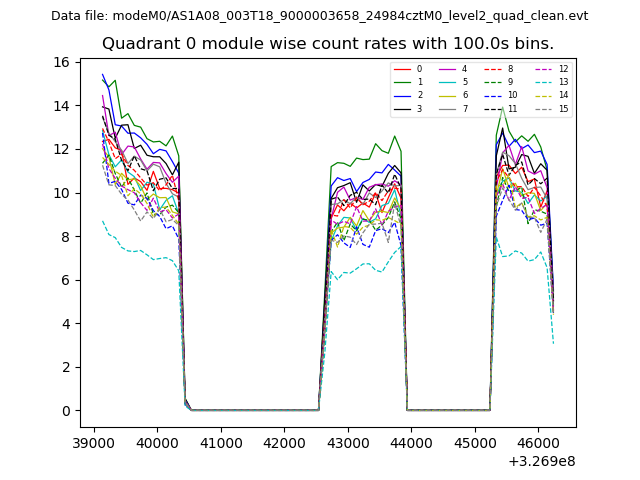 |
 |
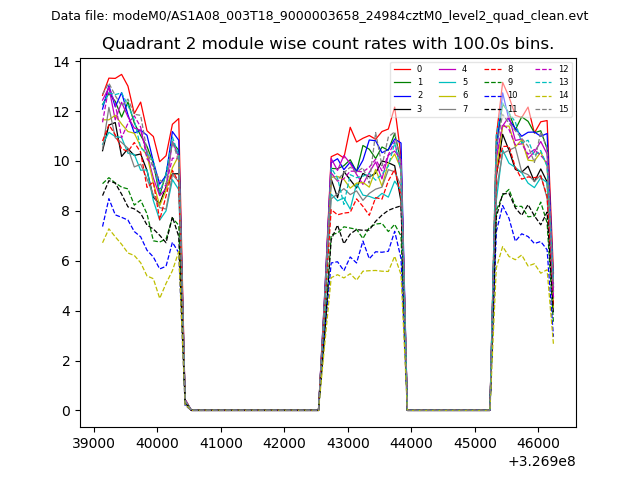
| Module-wise count rates for Quadrant B Data is divided into 100 sec bins |
 |
 |
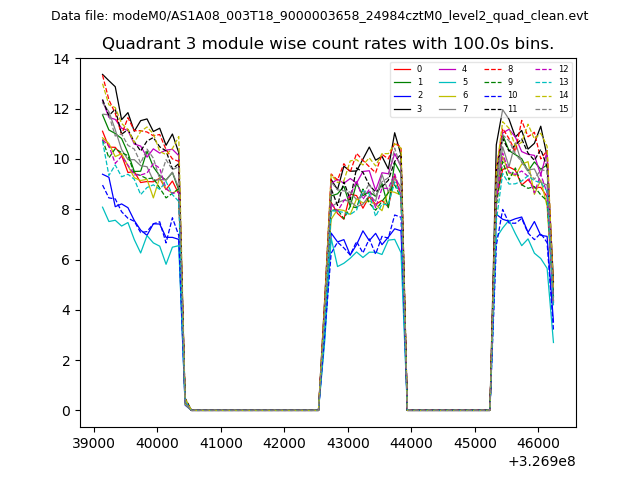
| Module-wise count rates for Quadrant C Data is divided into 100 sec bins |
 |
 |
| Module-wise count rates for Quadrant D Data is divided into 100 sec bins |
 |
 |
| Parameter | Plot |
|---|---|
| CZT HV Monitor | 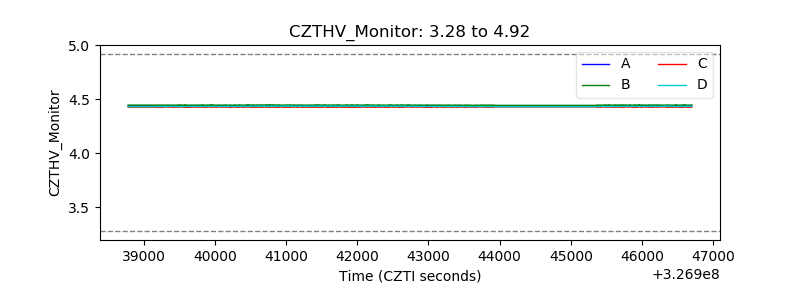 |
| D_VDD |  |
| Temperature 1 | 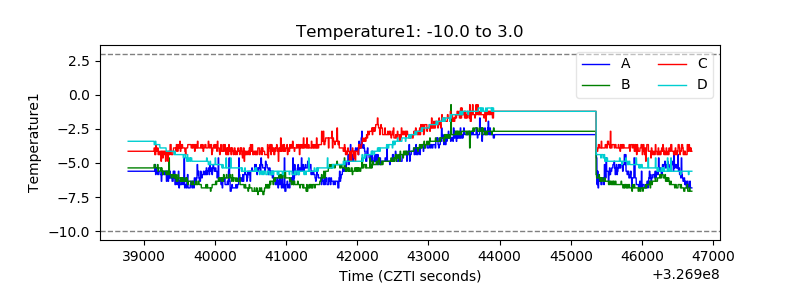 |
| Veto HV Monitor |  |
| Veto LLD | 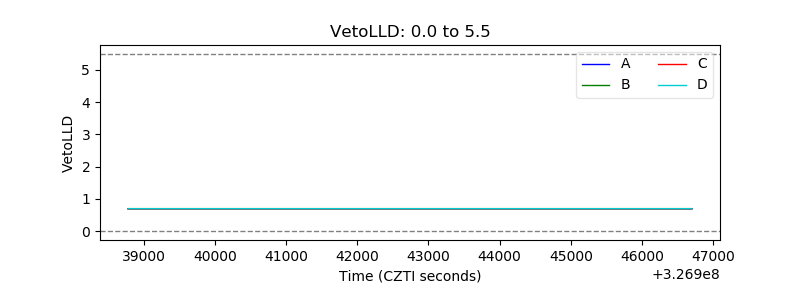 |
| Alpha Counter | 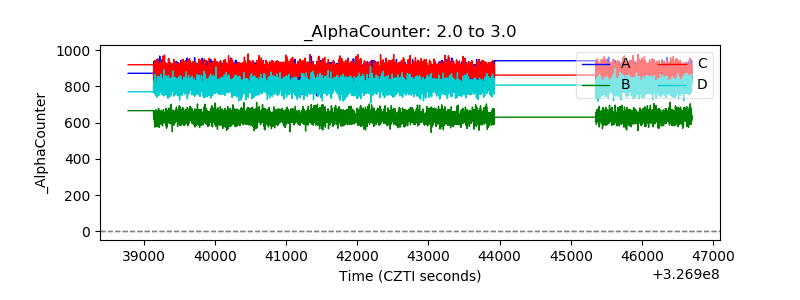 |
| _CPM_Rate |  |
| CZT Counter | 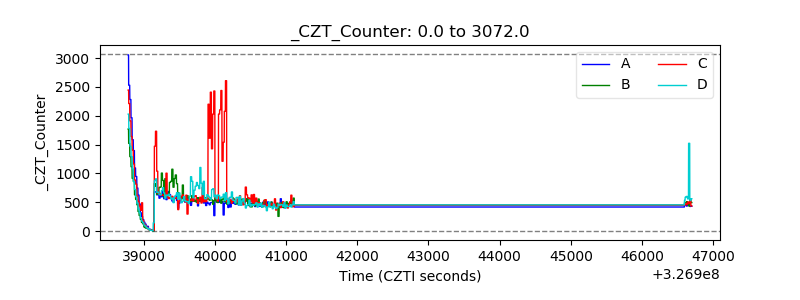 |
| +2.5 Volts monitor |  |
| +5 Volts monitor |  |
| _ROLL_ROT | 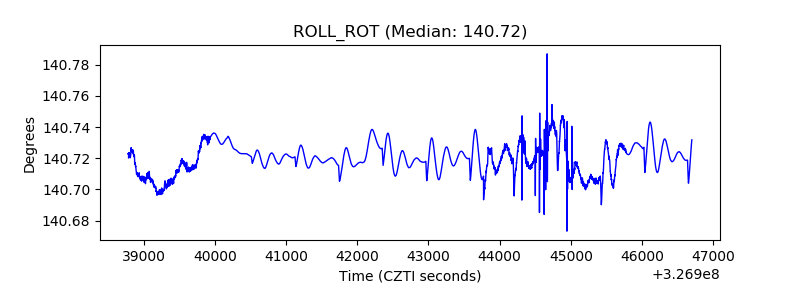 |
| _Roll_DEC | 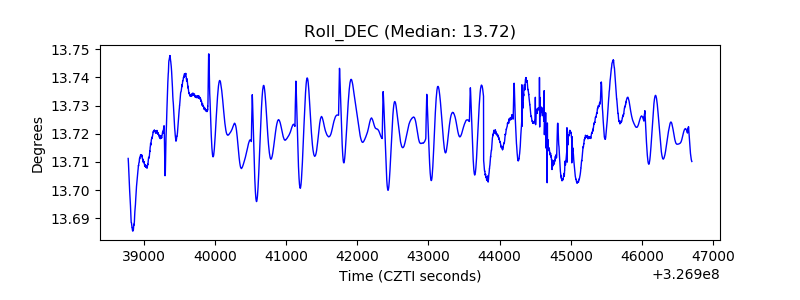 |
| _Roll_RA |  |
| Veto Counter | 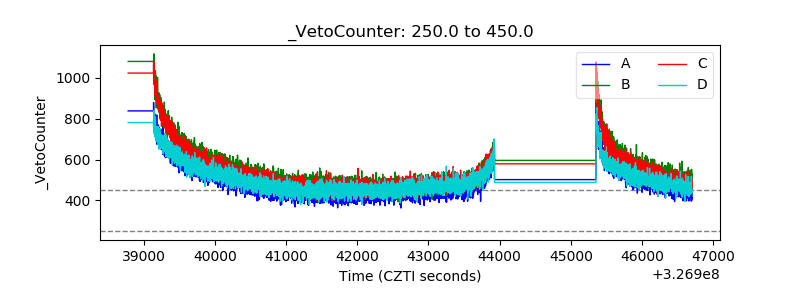 |