| Param | Original file | Final file |
|---|---|---|
| Filename | modeM0/AS1A08_003T18_9000003658_24985cztM0_level2.evt | modeM0/AS1A08_003T18_9000003658_24985cztM0_level2_quad_clean.evt |
| Size (bytes) | 508,207,680 | 78,840,000 |
| Size | 484.7 MB | 75.2 MB |
| Events in quadrant A | 3,221,490 | 500,607 |
| Events in quadrant B | 3,357,747 | 515,069 |
| Events in quadrant C | 4,062,742 | 474,451 |
| Events in quadrant D | 4,316,337 | 451,979 |
| Mode M9 | |||
|---|---|---|---|
| Quadrant | BADHDUFLAG | Total packets | Discarded packets |
| A | 0 | 16 | 0 |
| B | 0 | 17 | 0 |
| C | 0 | 17 | 0 |
| D | 0 | 17 | 0 |
| Mode SS | |||
|---|---|---|---|
| Quadrant | BADHDUFLAG | Total packets | Discarded packets |
| A | 0 | 130 | 0 |
| B | 0 | 130 | 0 |
| C | 0 | 130 | 0 |
| D | 0 | 130 | 0 |
| Mode M0 | |||
|---|---|---|---|
| Quadrant | BADHDUFLAG | Total packets | Discarded packets |
| A | 0 | 13310 | 2 |
| B | 0 | 13696 | 3 |
| C | 0 | 16038 | 2 |
| D | 0 | 17065 | 2 |
| Quadrant | Total seconds | Saturated seconds | Saturation percentage |
|---|---|---|---|
| A | 6380 | 34 | 0.532915% |
| B | 6379 | 63 | 0.987616% |
| C | 6379 | 165 | 2.586612% |
| D | 6379 | 171 | 2.680671% |
Noise dominated data is calculated using 1-second bins in cleaned event files. If a bin has >2000 counts, and if more than 50% of those come from <1% of pixels, then it is considered to be noise-dominated and hence unusable.
| Quadrant | # 1 sec bins | Bins with >0 counts | Bins with >2000 counts | High rate bins dominated by noise | Noise dominated (total time) | Noise dominated (detector-on time) | Marked lightcurve |
|---|---|---|---|---|---|---|---|
| A | 7635 | 6381 | 0 | 0 | 0.00% | 0.00% | 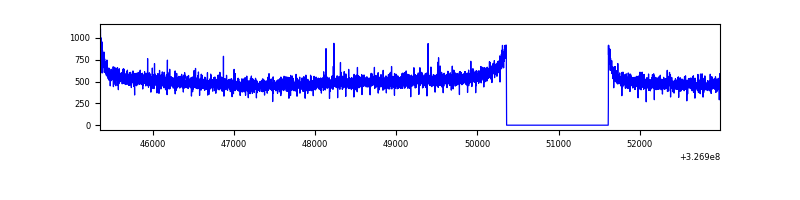 |
| B | 7634 | 6380 | 3 | 3 | 0.04% | 0.05% | 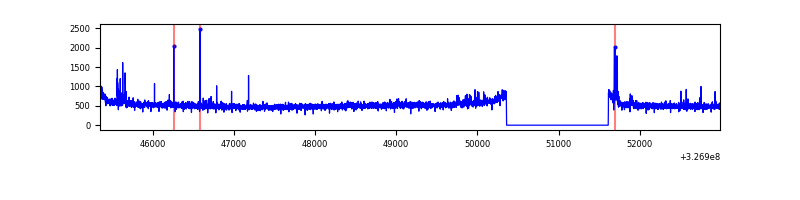 |
| C | 7634 | 6380 | 59 | 59 | 0.77% | 0.92% |  |
| D | 7634 | 6380 | 113 | 113 | 1.48% | 1.77% | 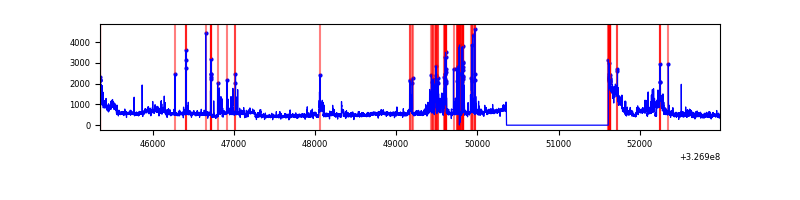 |
Top three noisy pixels from each quadrant. If the there are fewer than three noisy pixels in the level2.evt file, extra rows are filled as -1
| Pixel properties | Quadrant properties | ||||||
|---|---|---|---|---|---|---|---|
| Quadrant | DetID | PixID | Counts | Sigma | Mean | Median | Sigma |
| A | 13 | 254 | 8536 | 46.21 | 836 | 820 | 167.0 |
| A | 3 | 137 | 7429 | 39.58 | 836 | 820 | 167.0 |
| A | 0 | 226 | 7326 | 38.96 | 836 | 820 | 167.0 |
| B | 3 | 64 | 43171 | 267.72 | 835 | 814 | 158.2 |
| B | 12 | 111 | 19159 | 115.95 | 835 | 814 | 158.2 |
| B | 11 | 111 | 17590 | 106.03 | 835 | 814 | 158.2 |
| C | 7 | 247 | 793520 | 4277.35 | 792 | 798 | 185.3 |
| C | 14 | 238 | 127374 | 682.98 | 792 | 798 | 185.3 |
| C | 0 | 10 | 38336 | 202.55 | 792 | 798 | 185.3 |
| D | 7 | 238 | 652739 | 3432.55 | 785 | 764 | 189.9 |
| D | 10 | 70 | 485970 | 2554.54 | 785 | 764 | 189.9 |
| D | 8 | 195 | 101554 | 530.64 | 785 | 764 | 189.9 |
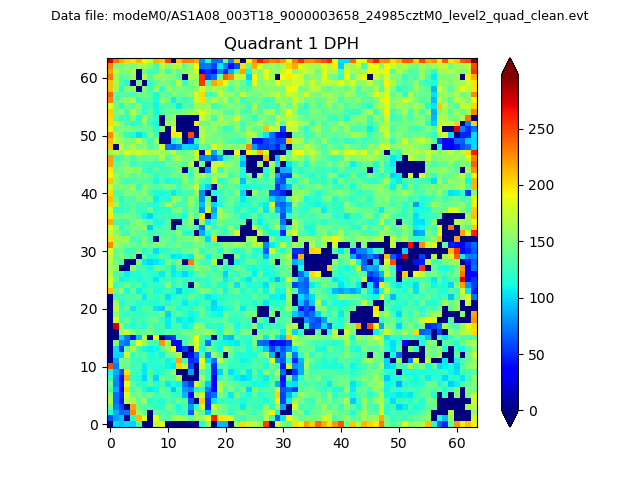
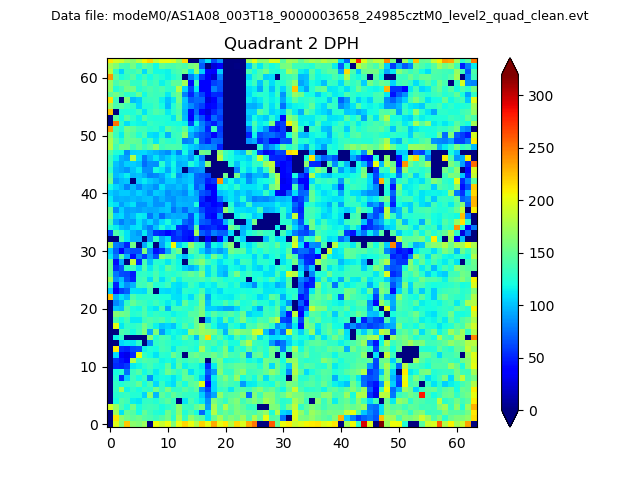
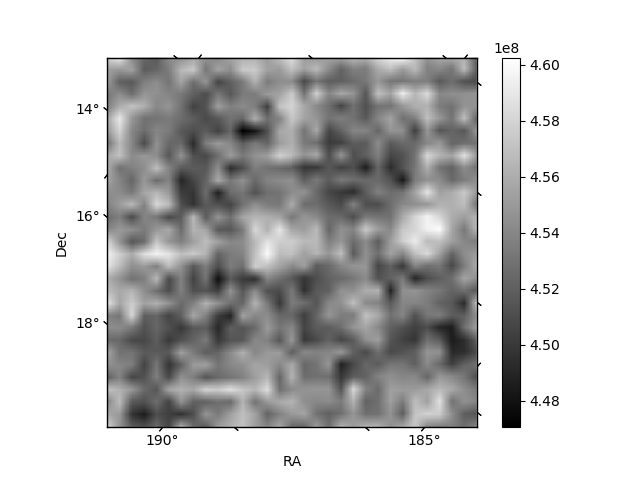
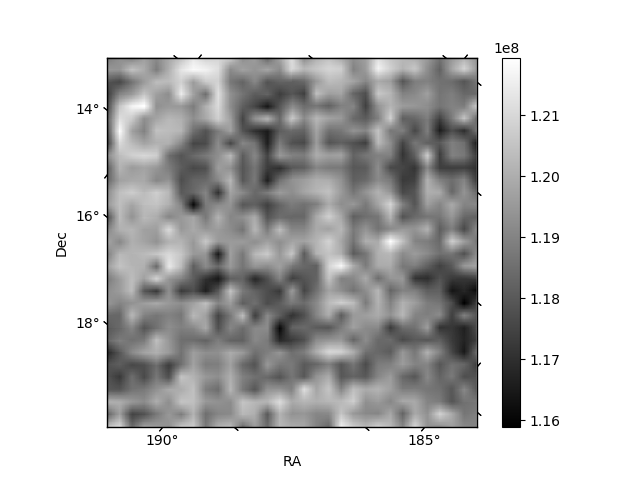
Histogram calculated using DETX and DETY for each event in the final _common_clean file
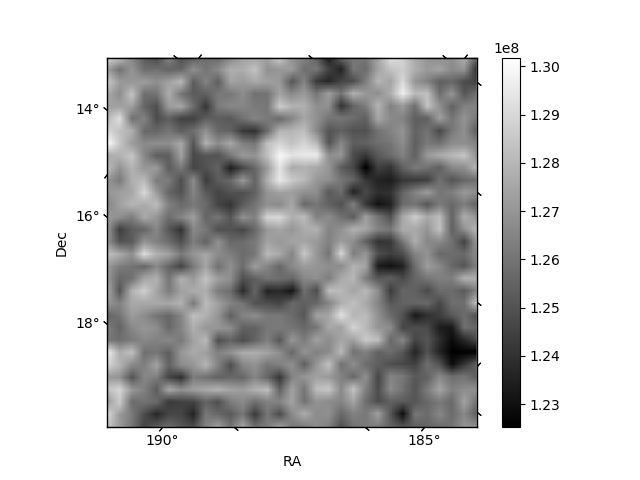
| Quadrant A | 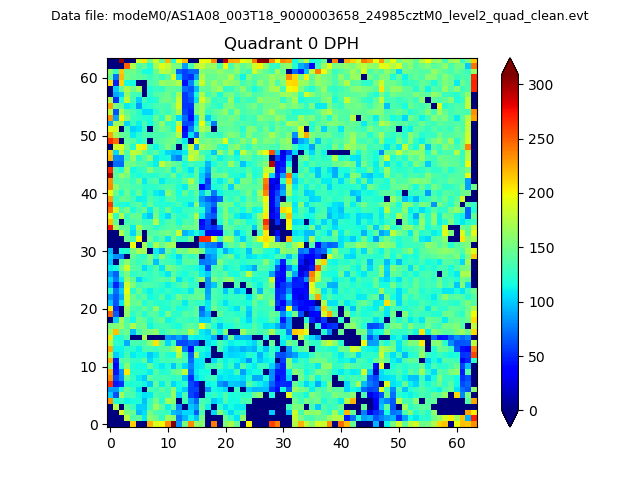 |
 |
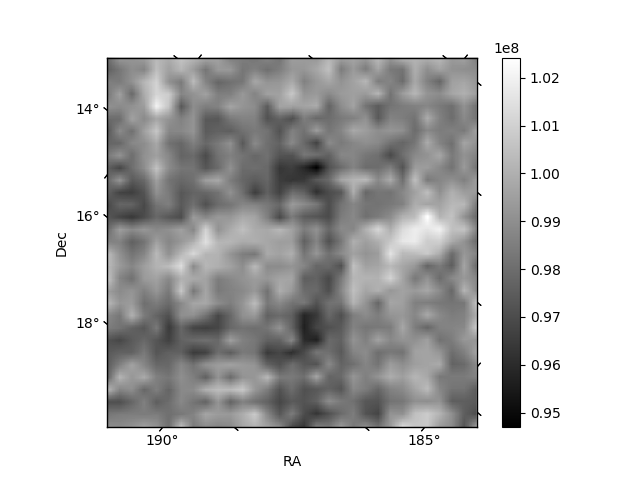
Quadrant B |
|---|---|---|---|
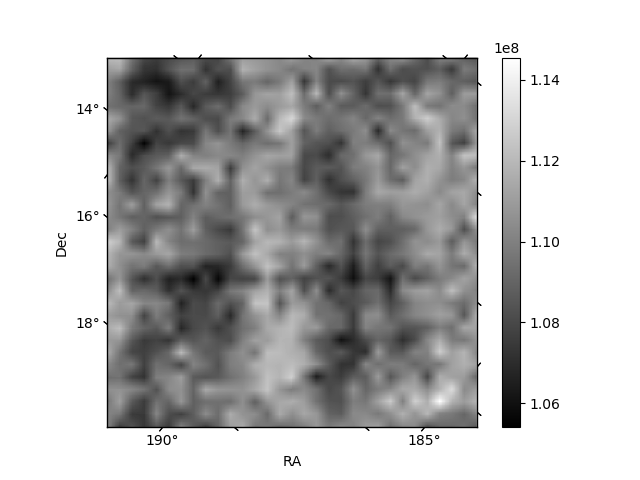
| Quadrant D | 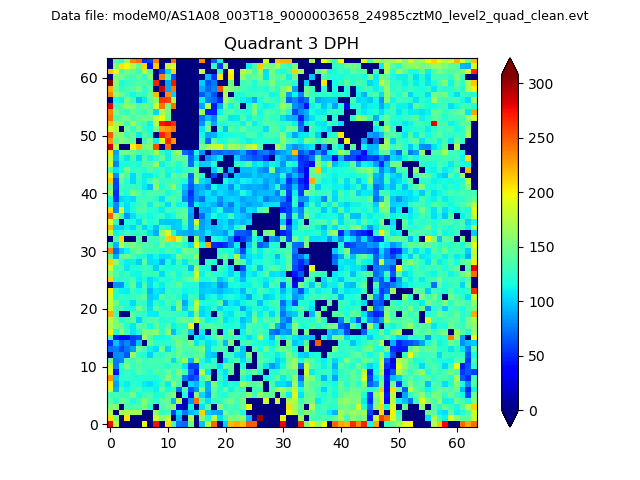 |
 |
Quadrant C |
| Plot type | Count rate plots | Images |
|---|---|---|
| Comparison with Poisson distribution Blue bars denote a histogram of data divided into 1 sec bins. Red curve is a Poisson curve with rate = median count rate of data. |
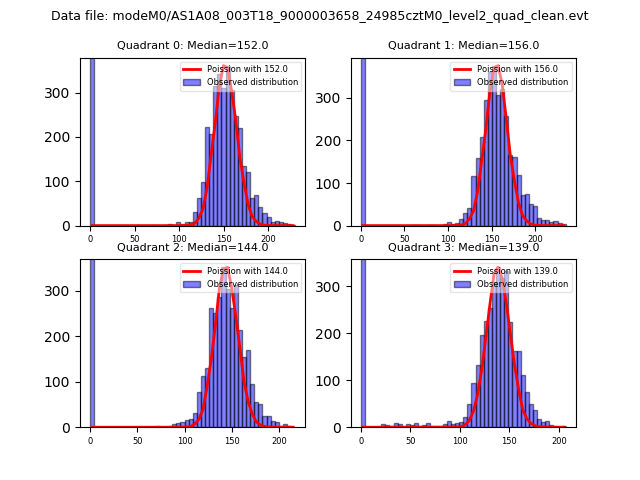 |
 |
| Quadrant-wise count rates Data is divided into 100 sec bins |
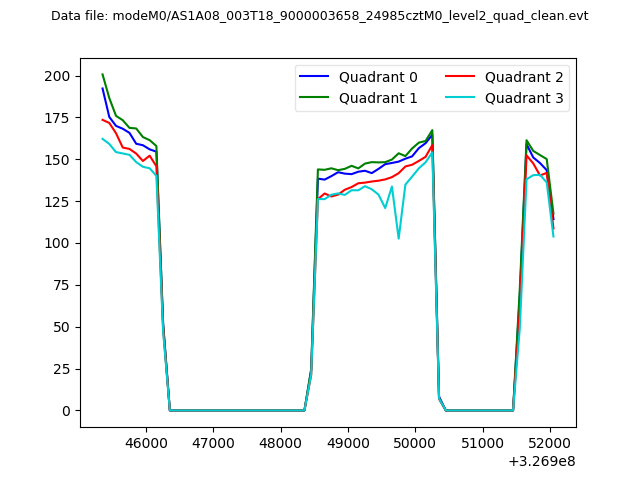 |
|
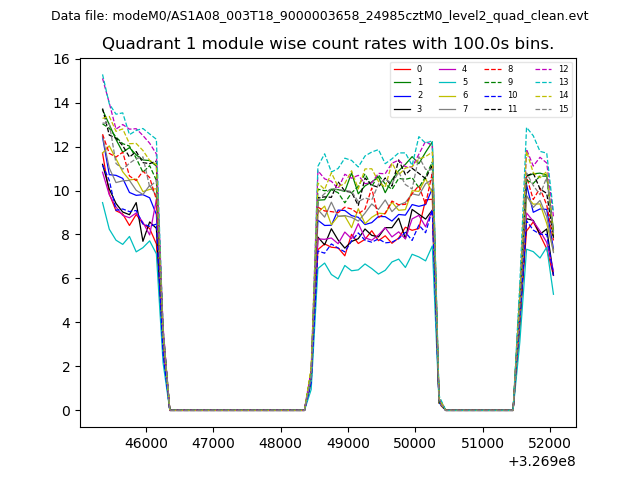
| Module-wise count rates for Quadrant A Data is divided into 100 sec bins |
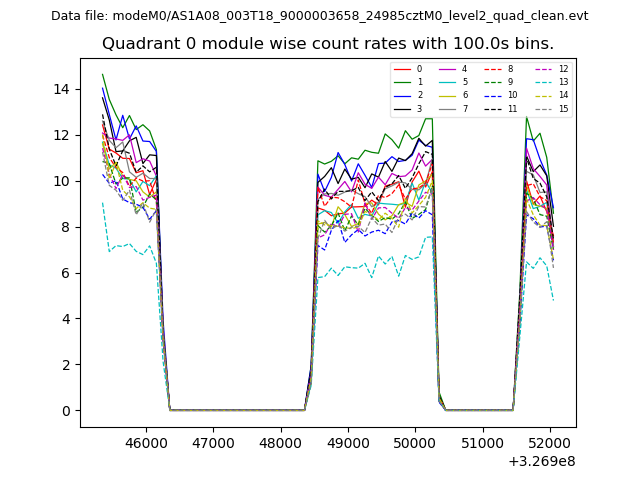 |
 |
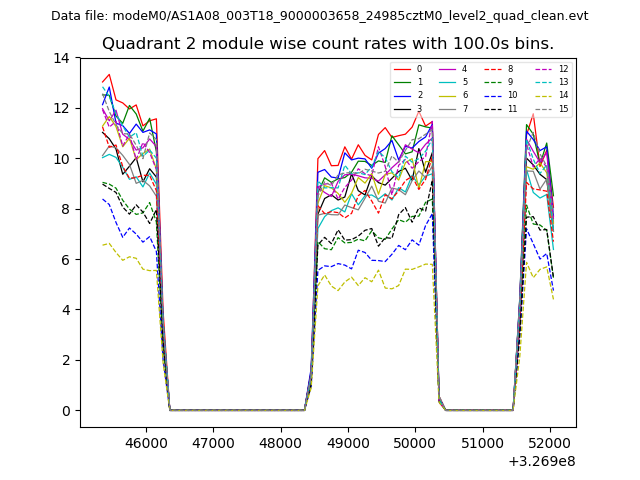
| Module-wise count rates for Quadrant B Data is divided into 100 sec bins |
 |
 |
| Module-wise count rates for Quadrant C Data is divided into 100 sec bins |
 |
 |
| Module-wise count rates for Quadrant D Data is divided into 100 sec bins |
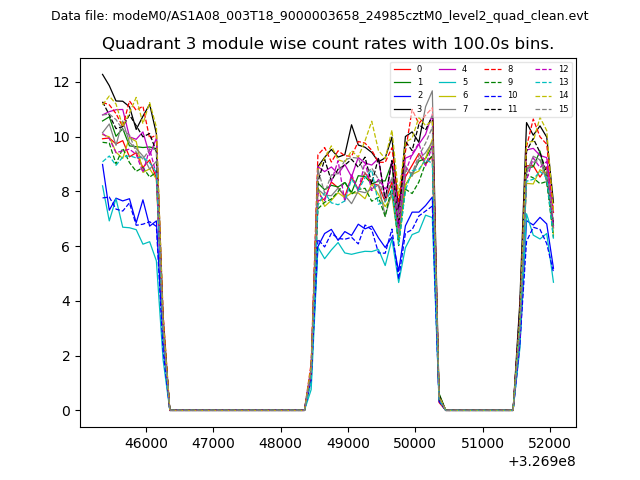 |
 |
| Parameter | Plot |
|---|---|
| CZT HV Monitor | 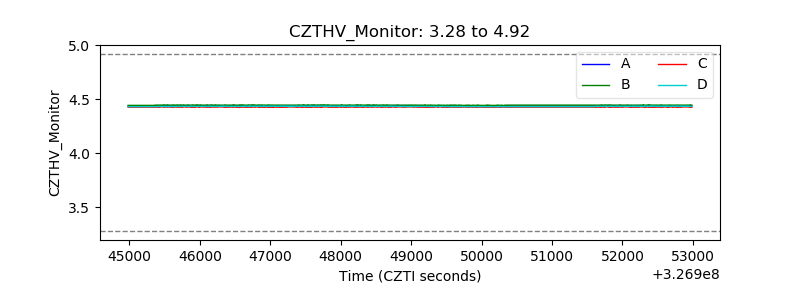 |
| D_VDD | 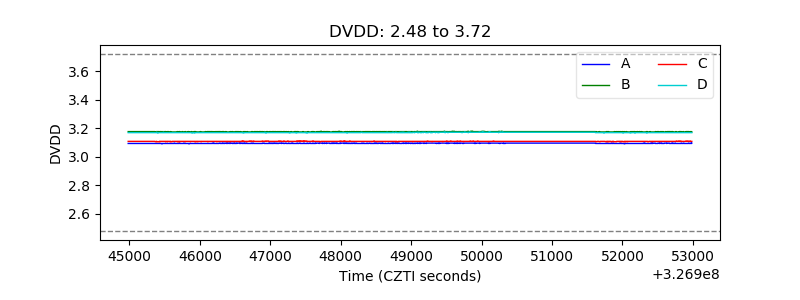 |
| Temperature 1 | 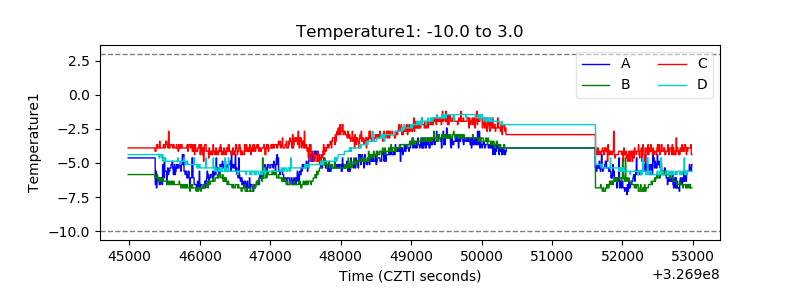 |
| Veto HV Monitor |  |
| Veto LLD | 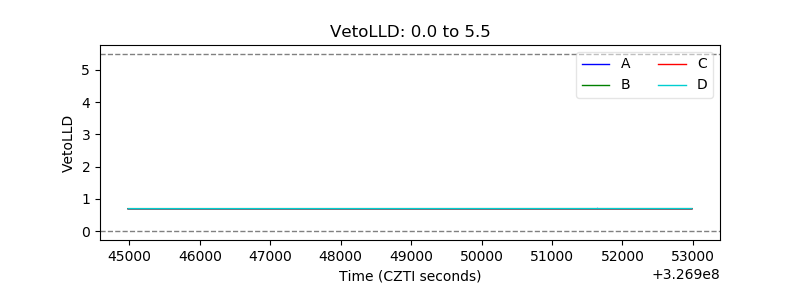 |
| Alpha Counter | 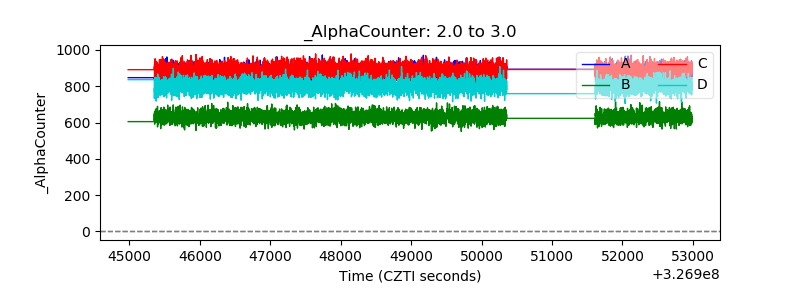 |
| _CPM_Rate | 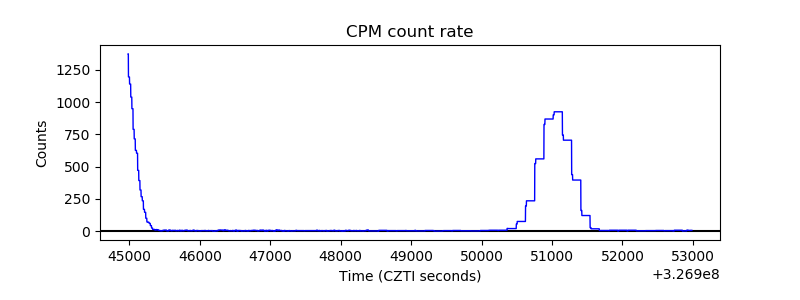 |
| CZT Counter | 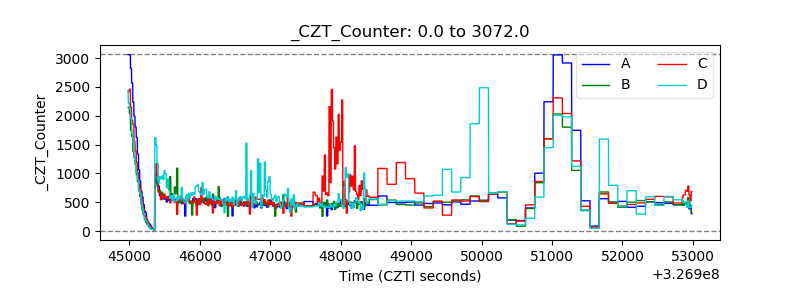 |
| +2.5 Volts monitor |  |
| +5 Volts monitor |  |
| _ROLL_ROT | 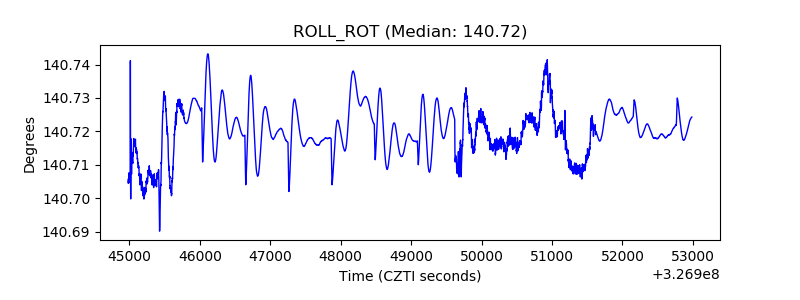 |
| _Roll_DEC | 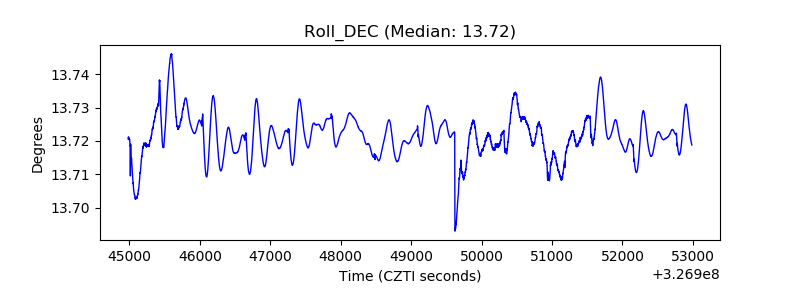 |
| _Roll_RA | 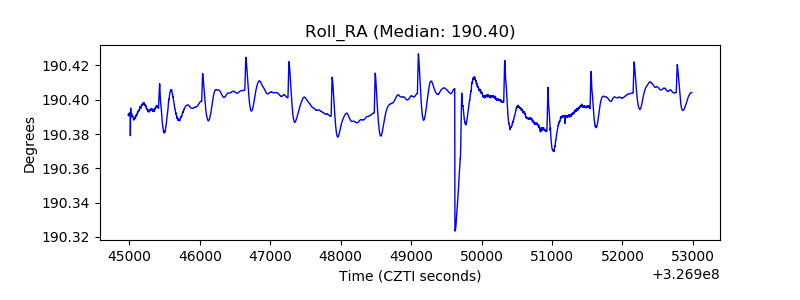 |
| Veto Counter | 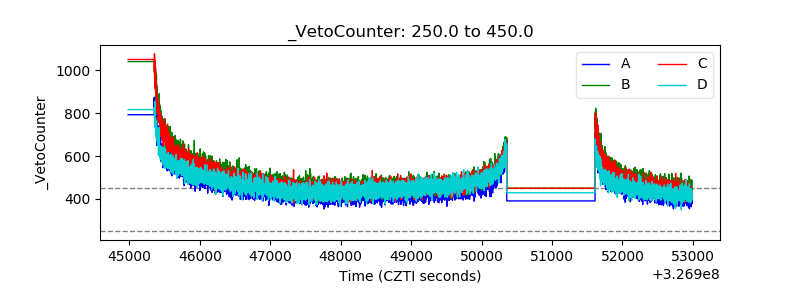 |