| Param | Original file | Final file |
|---|---|---|
| Filename | modeM0/AS1A07_127T03_9000003662_24989cztM0_level2.evt | modeM0/AS1A07_127T03_9000003662_24989cztM0_level2_quad_clean.evt |
| Size (bytes) | 600,860,160 | 73,088,640 |
| Size | 573.0 MB | 69.7 MB |
| Events in quadrant A | 2,977,901 | 466,743 |
| Events in quadrant B | 3,215,236 | 475,727 |
| Events in quadrant C | 3,314,503 | 452,966 |
| Events in quadrant D | 8,267,812 | 382,434 |
| Mode M0 | |||
|---|---|---|---|
| Quadrant | BADHDUFLAG | Total packets | Discarded packets |
| A | 0 | 12823 | 1 |
| B | 0 | 13459 | 1 |
| C | 0 | 13691 | 1 |
| D | 0 | 28758 | 4 |
| Mode SS | |||
|---|---|---|---|
| Quadrant | BADHDUFLAG | Total packets | Discarded packets |
| A | 0 | 126 | 0 |
| B | 0 | 126 | 0 |
| C | 0 | 126 | 0 |
| D | 0 | 126 | 0 |
| Mode M9 | |||
|---|---|---|---|
| Quadrant | BADHDUFLAG | Total packets | Discarded packets |
| A | 0 | 2 | 0 |
| B | 0 | 2 | 0 |
| C | 0 | 2 | 0 |
| D | 0 | 2 | 0 |
| Quadrant | Total seconds | Saturated seconds | Saturation percentage |
|---|---|---|---|
| A | 6223 | 211 | 3.390648% |
| B | 6223 | 244 | 3.920938% |
| C | 6223 | 261 | 4.194119% |
| D | 6222 | 1702 | 27.354548% |
Noise dominated data is calculated using 1-second bins in cleaned event files. If a bin has >2000 counts, and if more than 50% of those come from <1% of pixels, then it is considered to be noise-dominated and hence unusable.
| Quadrant | # 1 sec bins | Bins with >0 counts | Bins with >2000 counts | High rate bins dominated by noise | Noise dominated (total time) | Noise dominated (detector-on time) | Marked lightcurve |
|---|---|---|---|---|---|---|---|
| A | 6393 | 6224 | 0 | 0 | 0.00% | 0.00% | 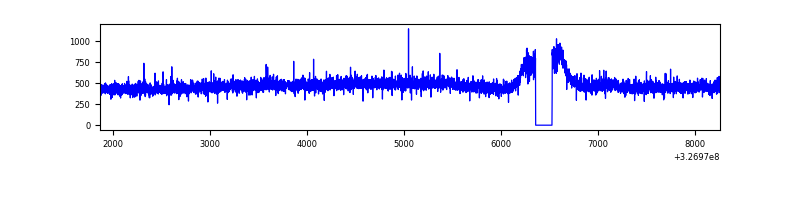 |
| B | 6393 | 6224 | 16 | 16 | 0.25% | 0.26% | 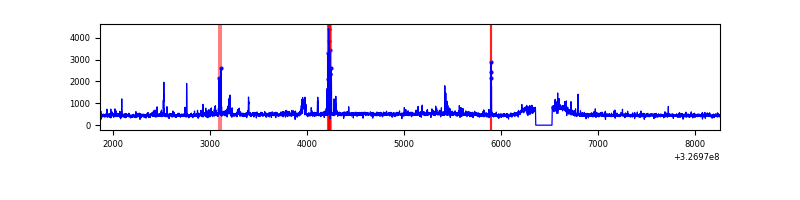 |
| C | 6393 | 6224 | 14 | 14 | 0.22% | 0.22% | 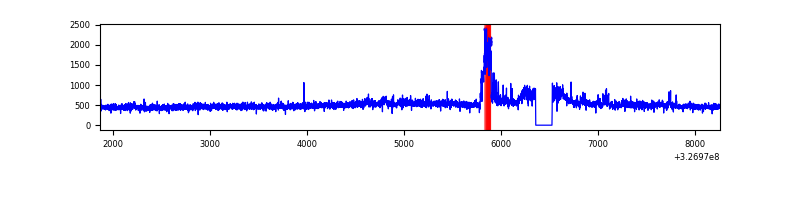 |
| D | 6392 | 6223 | 1446 | 1446 | 22.62% | 23.24% | 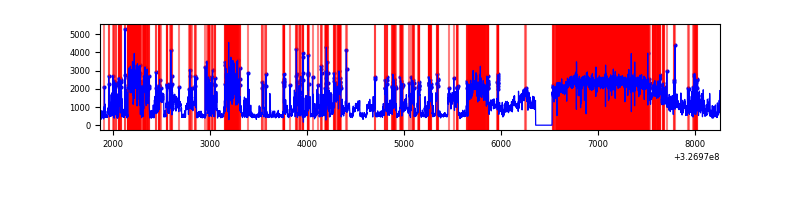 |
Top three noisy pixels from each quadrant. If the there are fewer than three noisy pixels in the level2.evt file, extra rows are filled as -1
| Pixel properties | Quadrant properties | ||||||
|---|---|---|---|---|---|---|---|
| Quadrant | DetID | PixID | Counts | Sigma | Mean | Median | Sigma |
| A | 9 | 130 | 10254 | 60.8 | 768 | 749 | 156.3 |
| A | 13 | 254 | 10121 | 59.95 | 768 | 749 | 156.3 |
| A | 14 | 250 | 7599 | 43.82 | 768 | 749 | 156.3 |
| B | 5 | 172 | 59384 | 397.51 | 761 | 741 | 147.5 |
| B | 0 | 190 | 48444 | 323.35 | 761 | 741 | 147.5 |
| B | 3 | 64 | 47039 | 313.83 | 761 | 741 | 147.5 |
| C | 7 | 247 | 332028 | 1915.86 | 733 | 737 | 172.9 |
| C | 14 | 238 | 116313 | 668.38 | 733 | 737 | 172.9 |
| C | 3 | 233 | 7863 | 41.21 | 733 | 737 | 172.9 |
| D | 1 | 52 | 2646614 | 15940.55 | 683 | 663 | 166.0 |
| D | 7 | 238 | 2604647 | 15687.72 | 683 | 663 | 166.0 |
| D | 8 | 195 | 118358 | 709.05 | 683 | 663 | 166.0 |
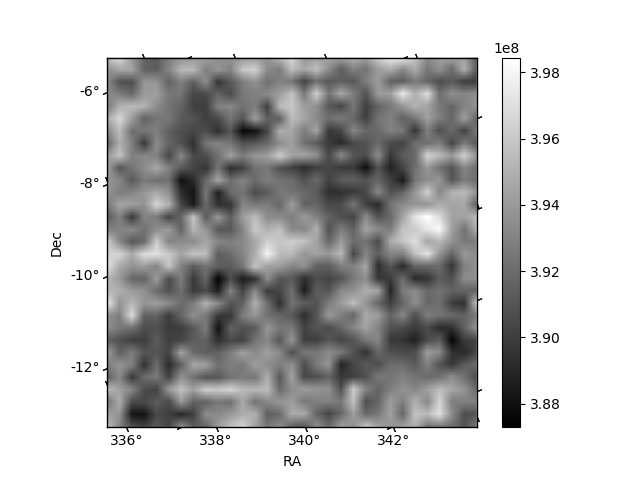
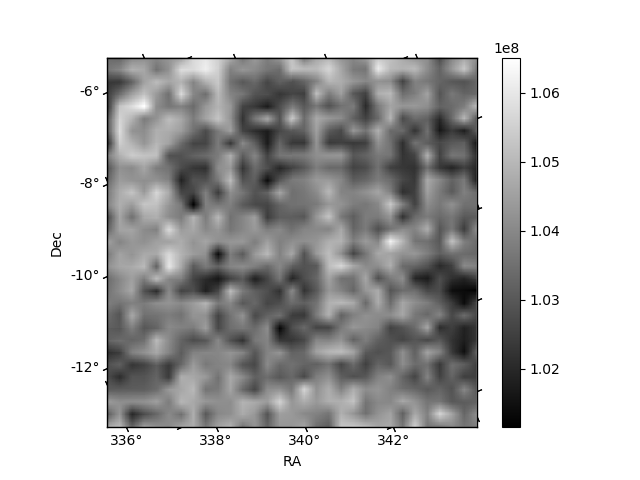
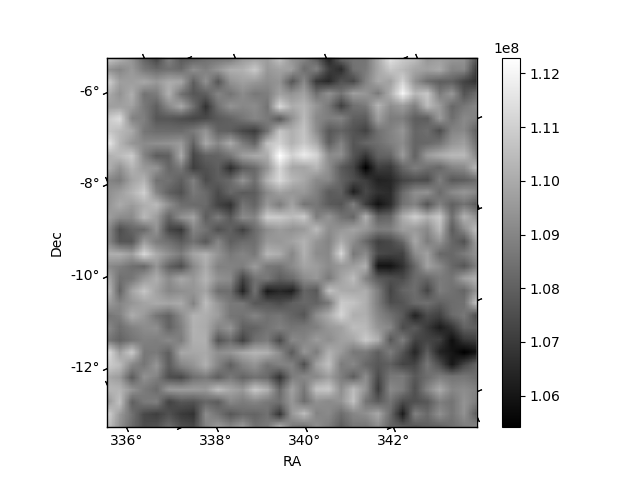
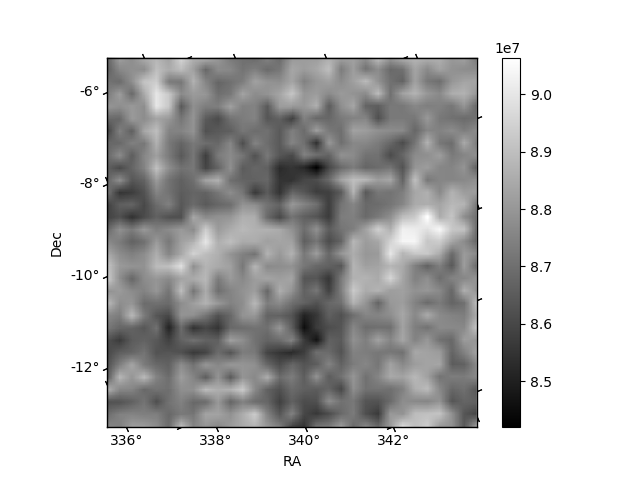
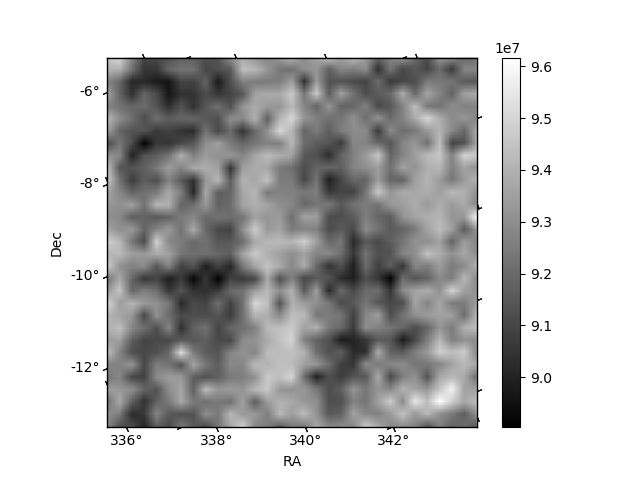
Histogram calculated using DETX and DETY for each event in the final _common_clean file
| Quadrant A | 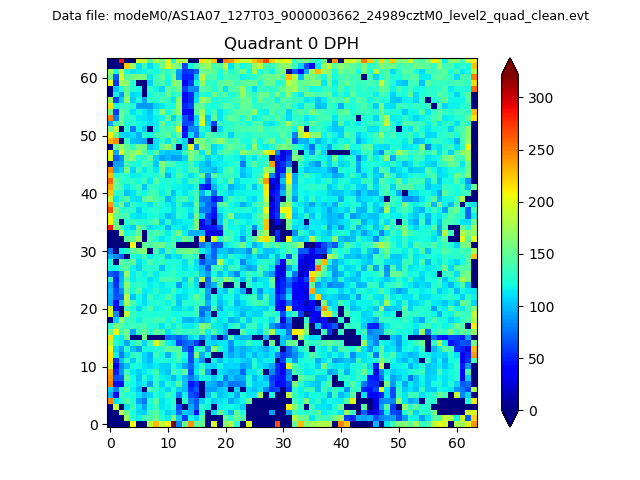 |
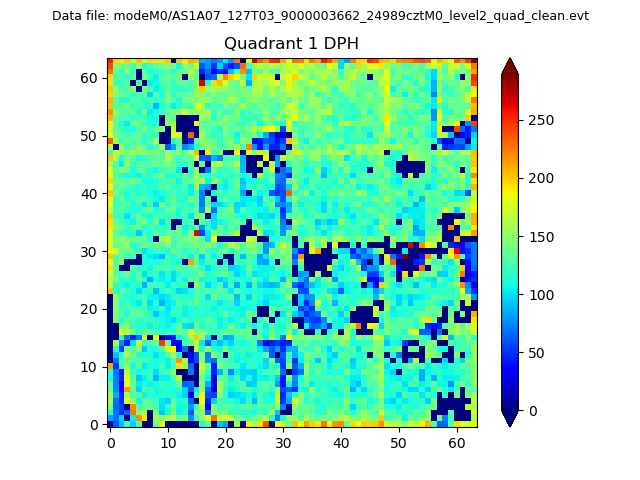 |
Quadrant B |
|---|---|---|---|
| Quadrant D | 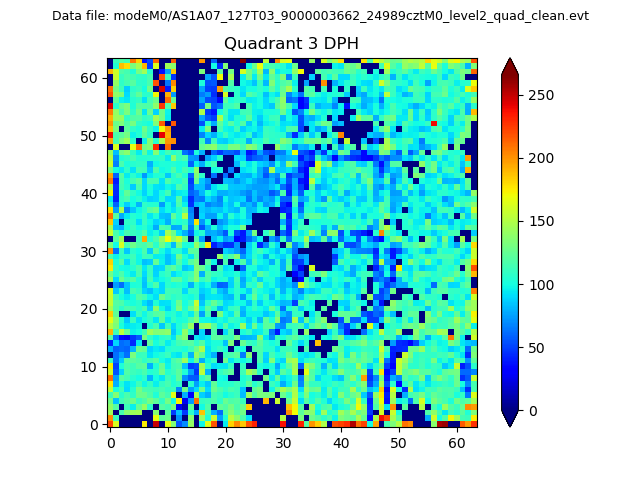 |
 |
Quadrant C |
| Plot type | Count rate plots | Images |
|---|---|---|
| Comparison with Poisson distribution Blue bars denote a histogram of data divided into 1 sec bins. Red curve is a Poisson curve with rate = median count rate of data. |
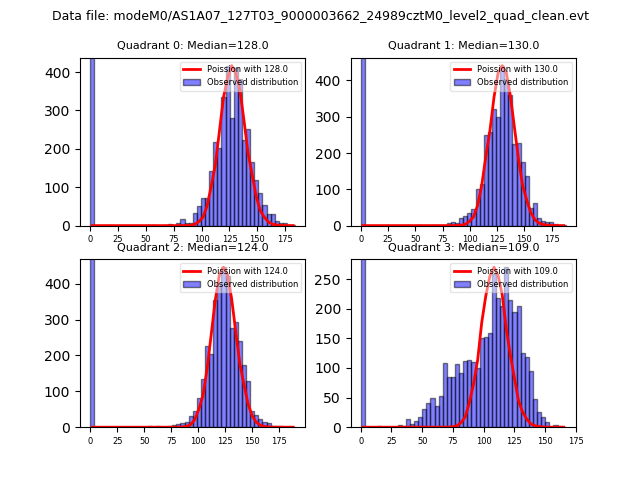 |
 |
| Quadrant-wise count rates Data is divided into 100 sec bins |
 |
|
| Module-wise count rates for Quadrant A Data is divided into 100 sec bins |
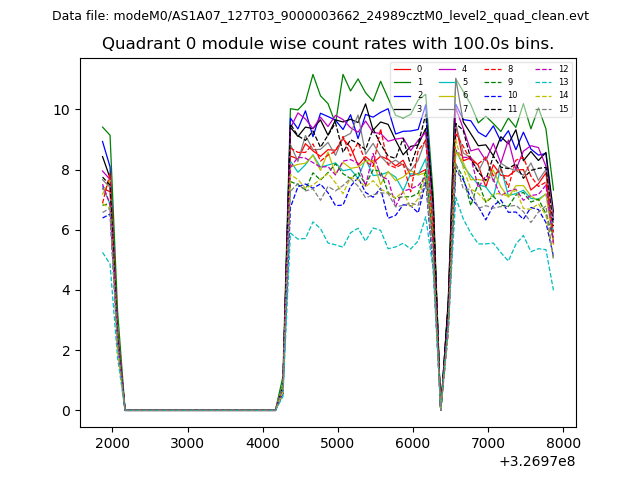 |
 |
| Module-wise count rates for Quadrant B Data is divided into 100 sec bins |
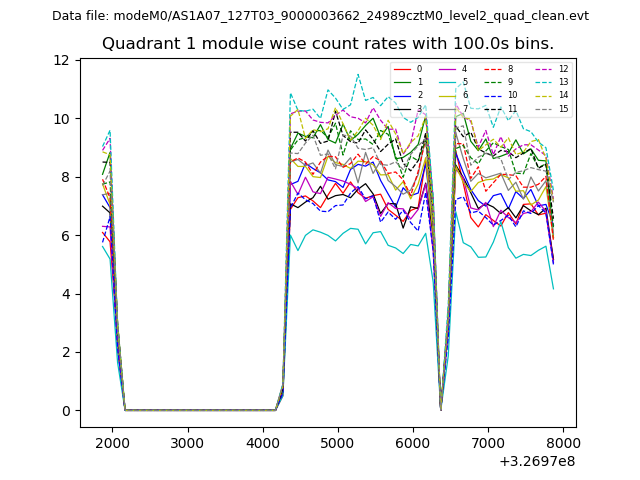 |
 |
| Module-wise count rates for Quadrant C Data is divided into 100 sec bins |
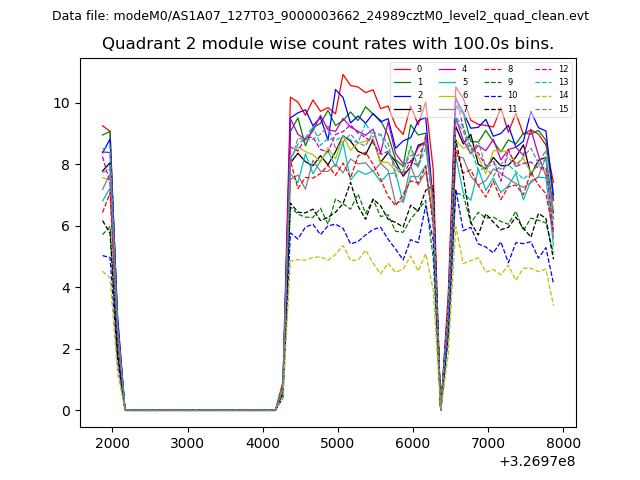 |
 |
| Module-wise count rates for Quadrant D Data is divided into 100 sec bins |
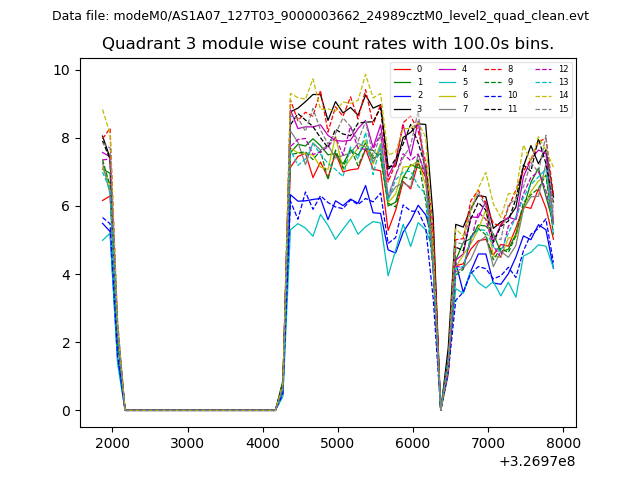 |
 |
| Parameter | Plot |
|---|---|
| CZT HV Monitor | 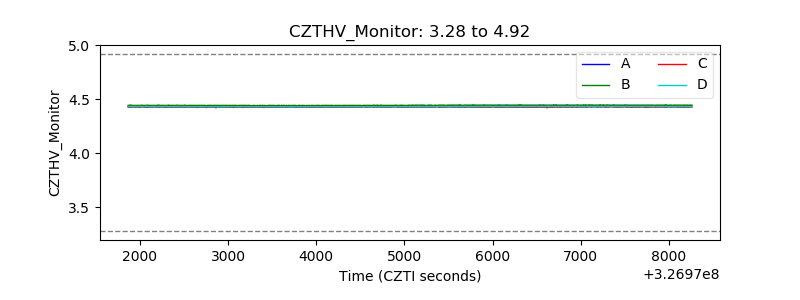 |
| D_VDD | 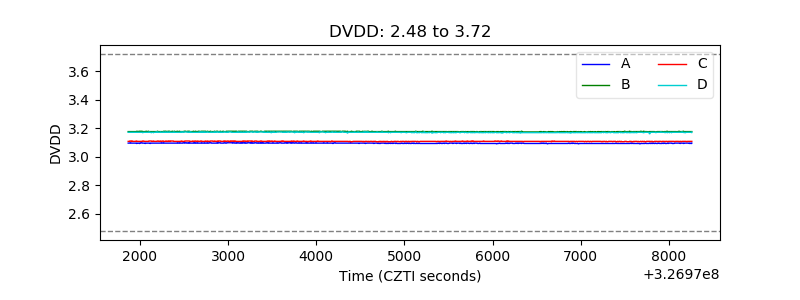 |
| Temperature 1 | 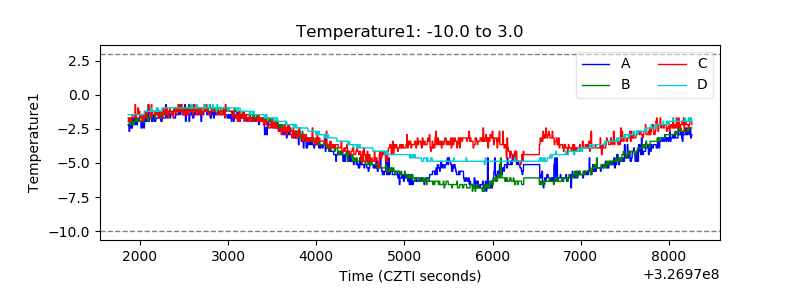 |
| Veto HV Monitor | 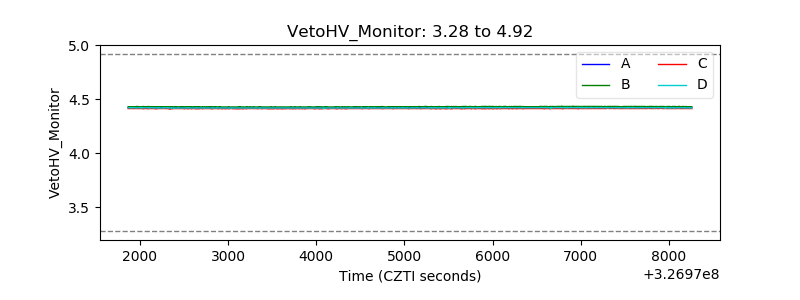 |
| Veto LLD | 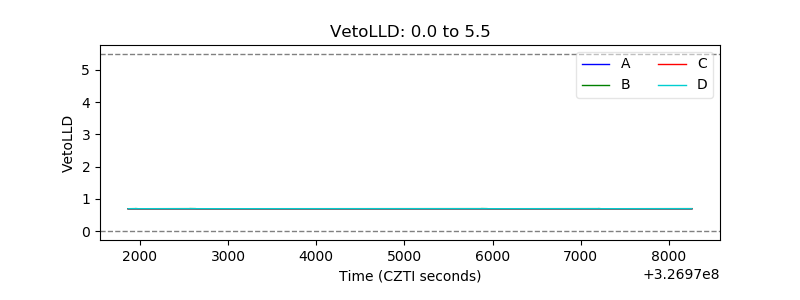 |
| Alpha Counter | 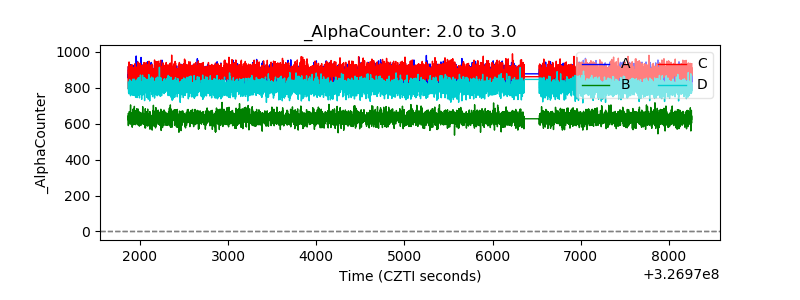 |
| _CPM_Rate | 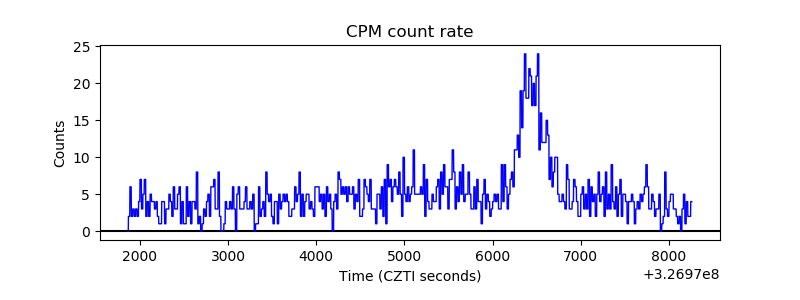 |
| CZT Counter |  |
| +2.5 Volts monitor |  |
| +5 Volts monitor |  |
| _ROLL_ROT | 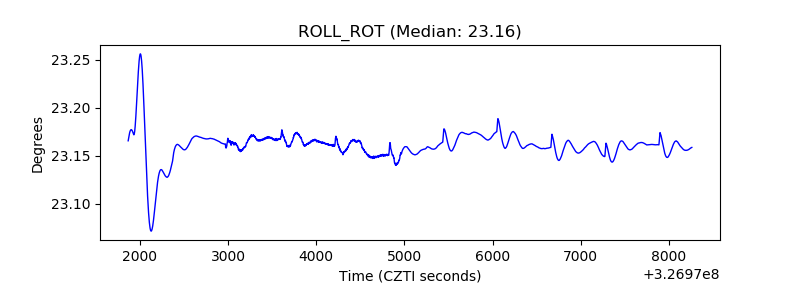 |
| _Roll_DEC | 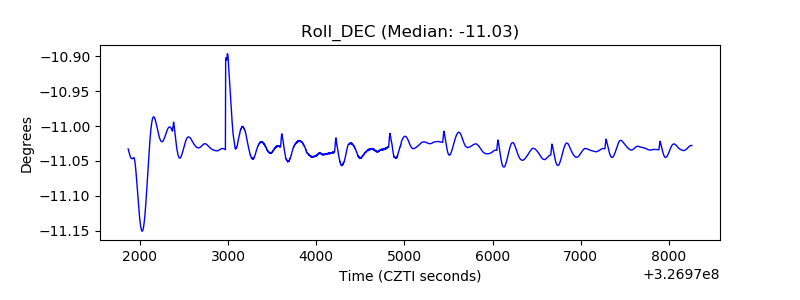 |
| _Roll_RA | 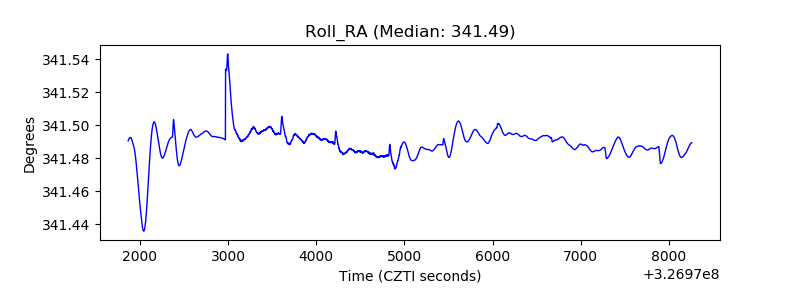 |
| Veto Counter | 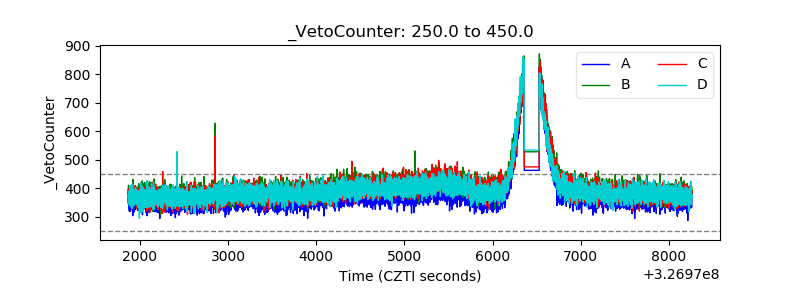 |