| Param | Original file | Final file |
|---|---|---|
| Filename | modeM0/AS1A07_127T03_9000003662_24991cztM0_level2.evt | modeM0/AS1A07_127T03_9000003662_24991cztM0_level2_quad_clean.evt |
| Size (bytes) | 1,026,835,200 | 138,288,960 |
| Size | 979.3 MB | 131.9 MB |
| Events in quadrant A | 5,909,083 | 850,169 |
| Events in quadrant B | 6,045,799 | 867,307 |
| Events in quadrant C | 6,446,318 | 823,977 |
| Events in quadrant D | 11,858,064 | 787,743 |
| Mode M0 | |||
|---|---|---|---|
| Quadrant | BADHDUFLAG | Total packets | Discarded packets |
| A | 0 | 25406 | 2 |
| B | 0 | 25681 | 2 |
| C | 0 | 26759 | 2 |
| D | 0 | 43654 | 2 |
| Mode SS | |||
|---|---|---|---|
| Quadrant | BADHDUFLAG | Total packets | Discarded packets |
| A | 0 | 252 | 0 |
| B | 0 | 254 | 0 |
| C | 0 | 254 | 0 |
| D | 0 | 254 | 0 |
| Mode M9 | |||
|---|---|---|---|
| Quadrant | BADHDUFLAG | Total packets | Discarded packets |
| A | 0 | 11 | 0 |
| B | 0 | 11 | 0 |
| C | 0 | 11 | 0 |
| D | 0 | 11 | 0 |
| Quadrant | Total seconds | Saturated seconds | Saturation percentage |
|---|---|---|---|
| A | 12412 | 173 | 1.393812% |
| B | 12412 | 195 | 1.571060% |
| C | 12412 | 232 | 1.869159% |
| D | 12412 | 1151 | 9.273284% |
Noise dominated data is calculated using 1-second bins in cleaned event files. If a bin has >2000 counts, and if more than 50% of those come from <1% of pixels, then it is considered to be noise-dominated and hence unusable.
| Quadrant | # 1 sec bins | Bins with >0 counts | Bins with >2000 counts | High rate bins dominated by noise | Noise dominated (total time) | Noise dominated (detector-on time) | Marked lightcurve |
|---|---|---|---|---|---|---|---|
| A | 13507 | 12414 | 0 | 0 | 0.00% | 0.00% | 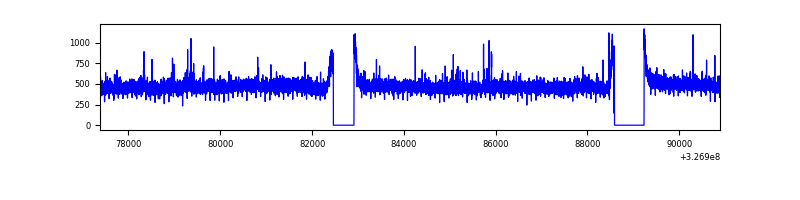 |
| B | 13507 | 12414 | 2 | 2 | 0.01% | 0.02% | 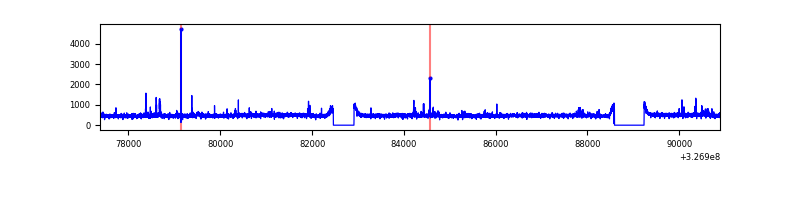 |
| C | 13506 | 12413 | 0 | 0 | 0.00% | 0.00% | 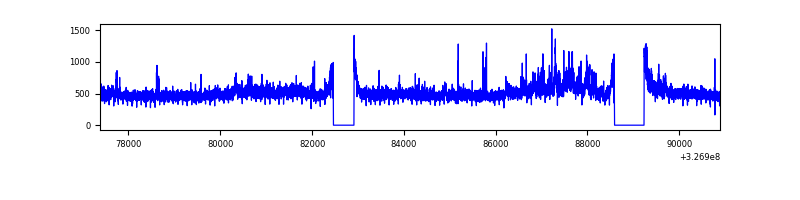 |
| D | 13507 | 12414 | 973 | 973 | 7.20% | 7.84% | 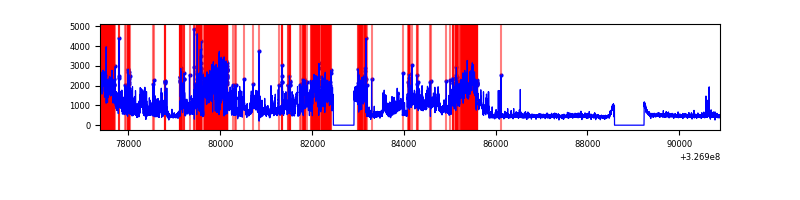 |
Top three noisy pixels from each quadrant. If the there are fewer than three noisy pixels in the level2.evt file, extra rows are filled as -1
| Pixel properties | Quadrant properties | ||||||
|---|---|---|---|---|---|---|---|
| Quadrant | DetID | PixID | Counts | Sigma | Mean | Median | Sigma |
| A | 6 | 16 | 30581 | 95.07 | 1518 | 1484 | 306.1 |
| A | 9 | 130 | 23989 | 73.53 | 1518 | 1484 | 306.1 |
| A | 13 | 254 | 19810 | 59.88 | 1518 | 1484 | 306.1 |
| B | 0 | 190 | 88031 | 299.42 | 1504 | 1464 | 289.1 |
| B | 12 | 111 | 36358 | 120.69 | 1504 | 1464 | 289.1 |
| B | 11 | 111 | 32711 | 108.08 | 1504 | 1464 | 289.1 |
| C | 7 | 247 | 540463 | 1579.56 | 1447 | 1456 | 341.2 |
| C | 14 | 238 | 229633 | 668.67 | 1447 | 1456 | 341.2 |
| C | 2 | 16 | 16392 | 43.77 | 1447 | 1456 | 341.2 |
| D | 1 | 52 | 5270458 | 15068.18 | 1438 | 1397 | 349.7 |
| D | 7 | 238 | 621884 | 1774.44 | 1438 | 1397 | 349.7 |
| D | 8 | 195 | 301052 | 856.94 | 1438 | 1397 | 349.7 |
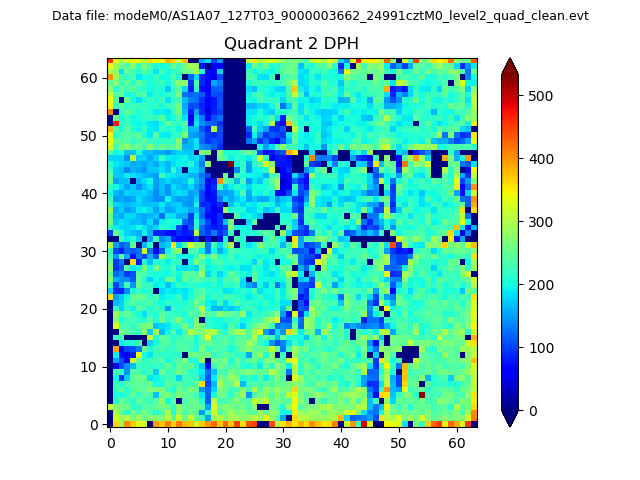
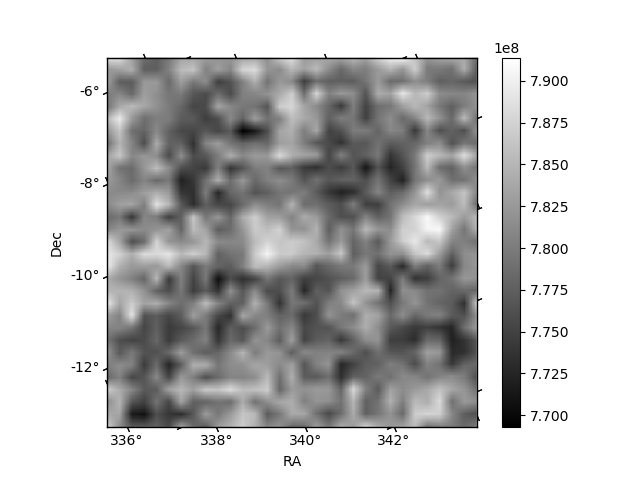
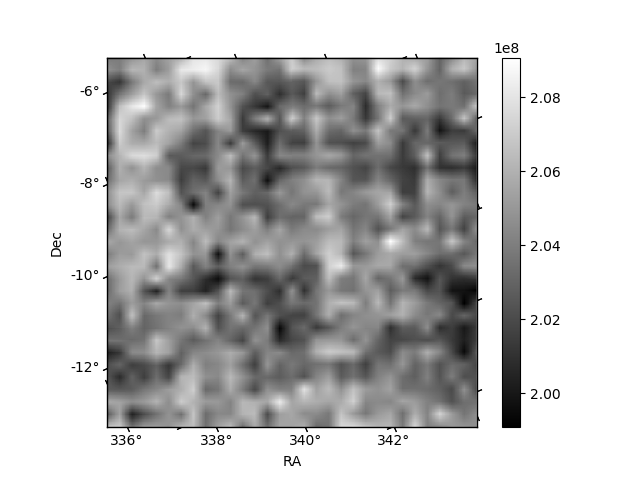
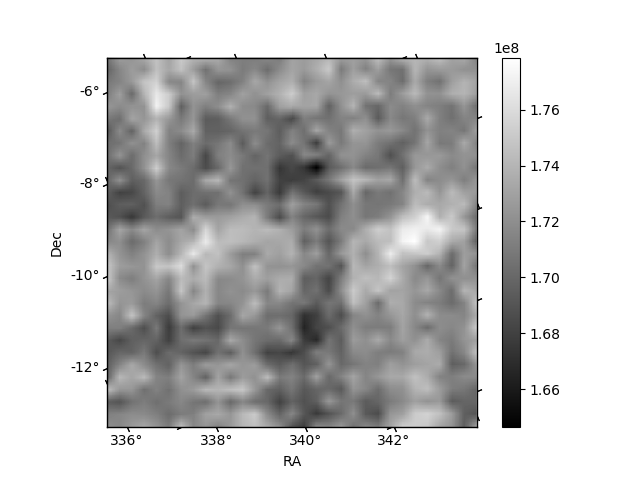
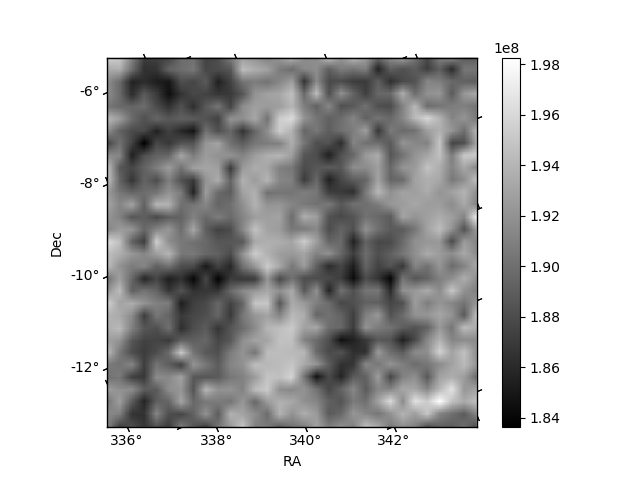
Histogram calculated using DETX and DETY for each event in the final _common_clean file
| Quadrant A | 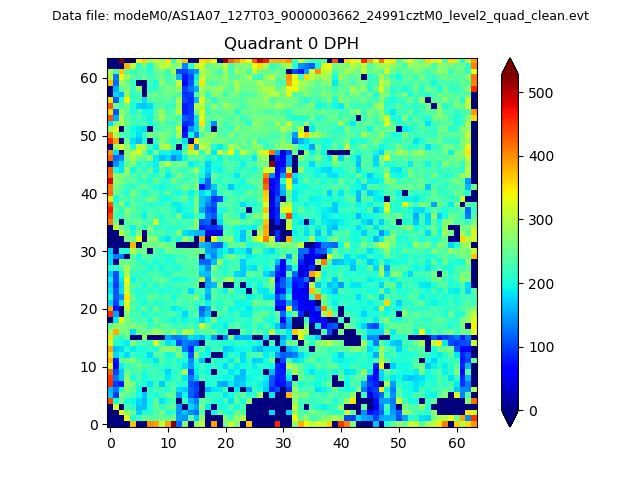 |
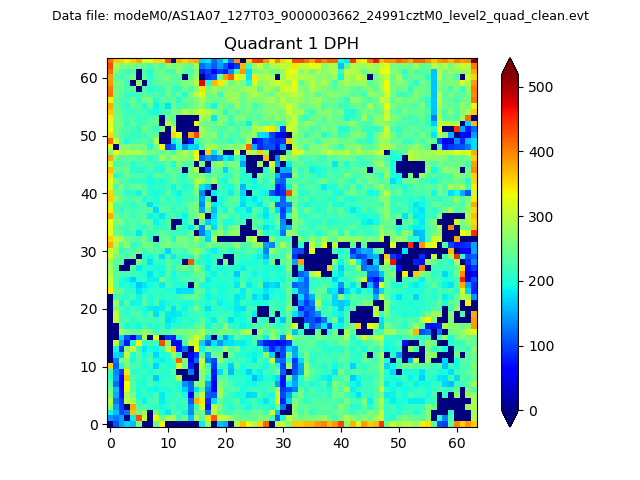 |
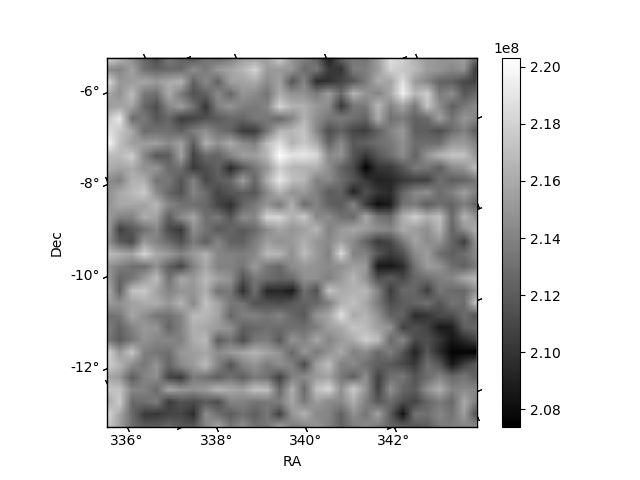
Quadrant B |
|---|---|---|---|
| Quadrant D | 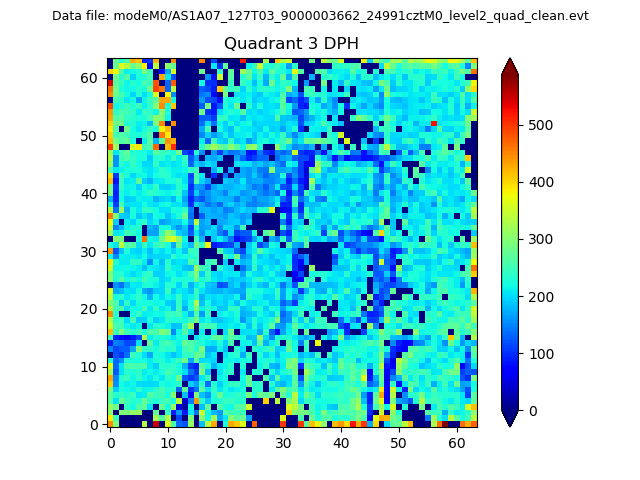 |
 |
Quadrant C |
| Plot type | Count rate plots | Images |
|---|---|---|
| Comparison with Poisson distribution Blue bars denote a histogram of data divided into 1 sec bins. Red curve is a Poisson curve with rate = median count rate of data. |
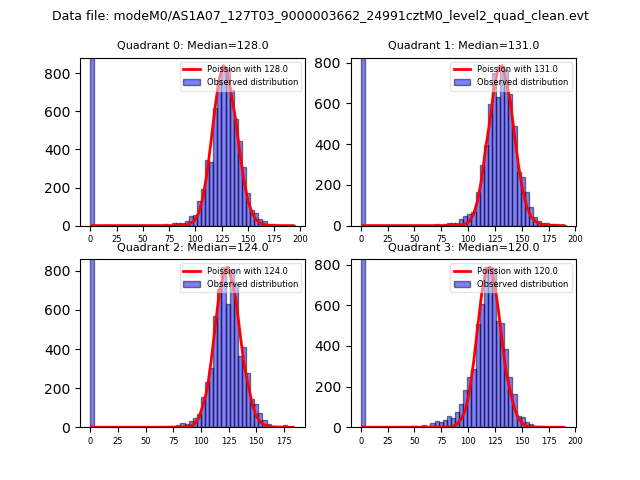 |
 |
| Quadrant-wise count rates Data is divided into 100 sec bins |
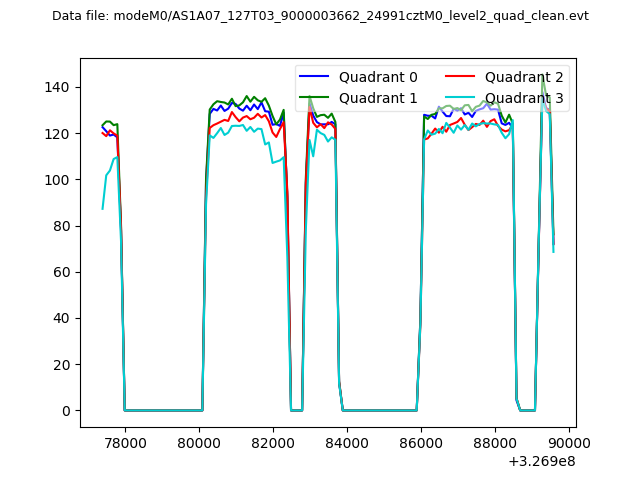 |
|
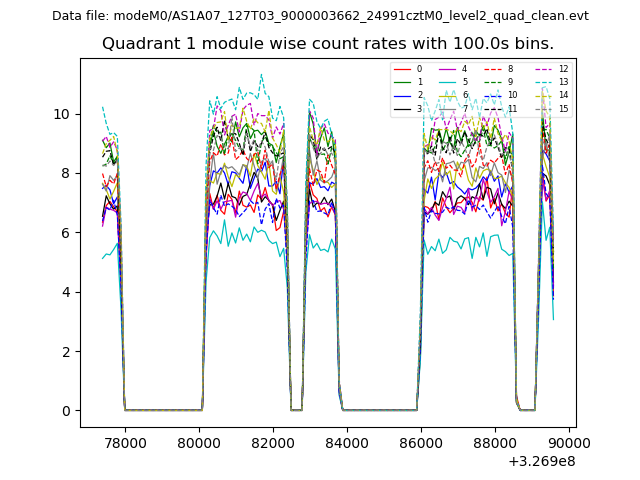
| Module-wise count rates for Quadrant A Data is divided into 100 sec bins |
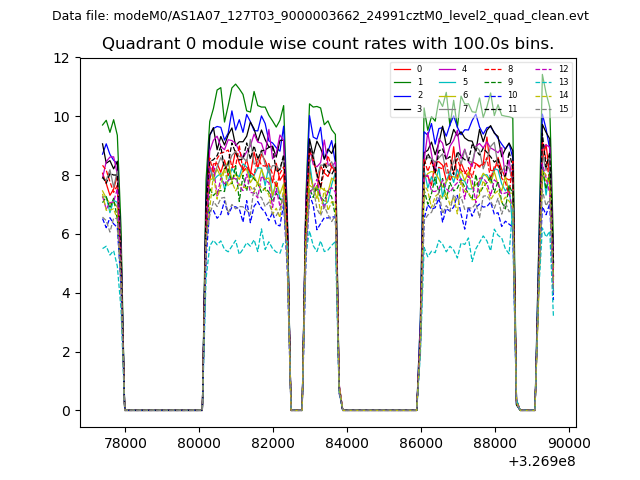 |
 |
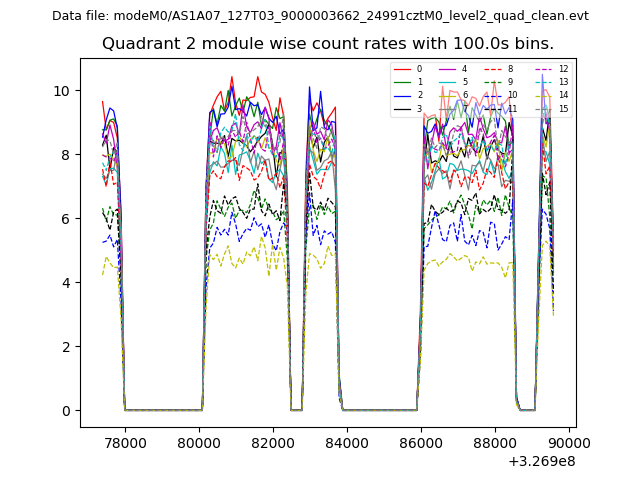
| Module-wise count rates for Quadrant B Data is divided into 100 sec bins |
 |
 |
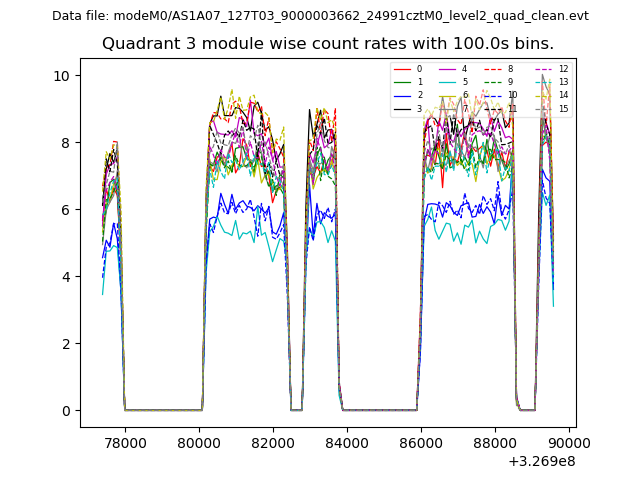
| Module-wise count rates for Quadrant C Data is divided into 100 sec bins |
 |
 |
| Module-wise count rates for Quadrant D Data is divided into 100 sec bins |
 |
 |
| Parameter | Plot |
|---|---|
| CZT HV Monitor | 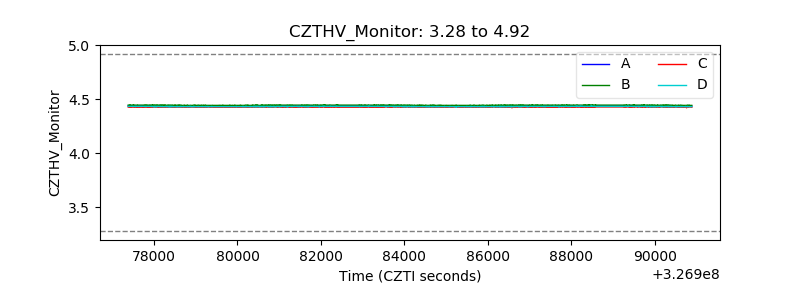 |
| D_VDD | 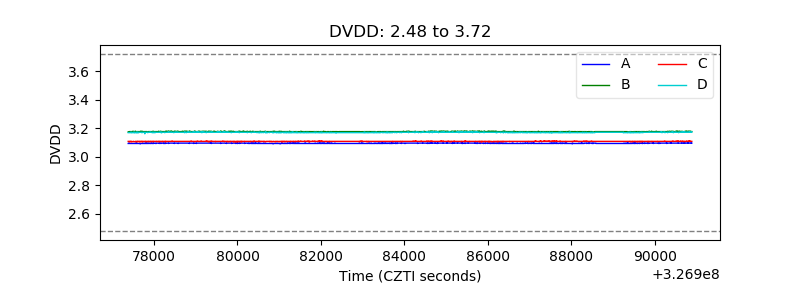 |
| Temperature 1 | 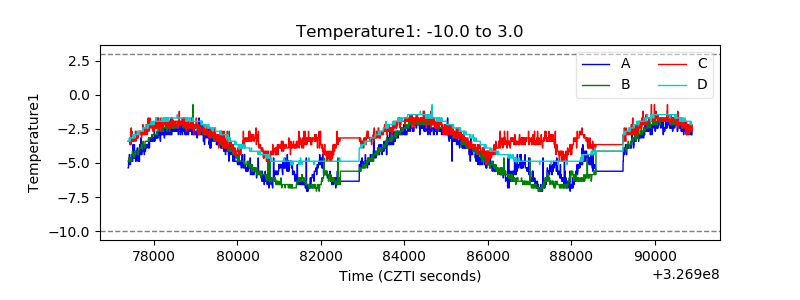 |
| Veto HV Monitor |  |
| Veto LLD | 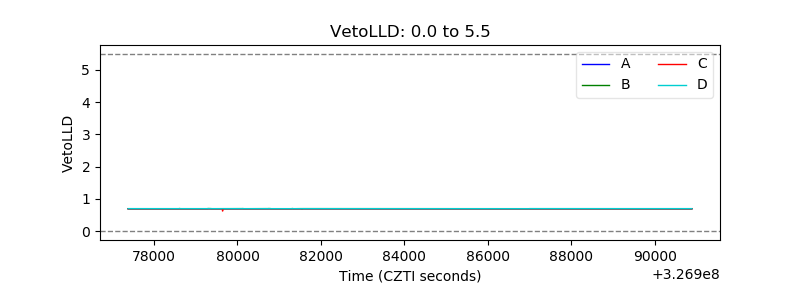 |
| Alpha Counter | 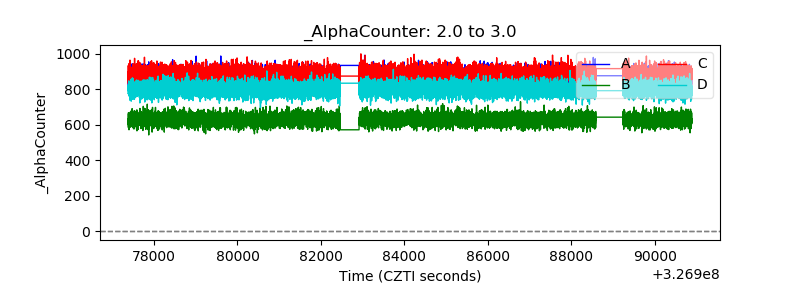 |
| _CPM_Rate | 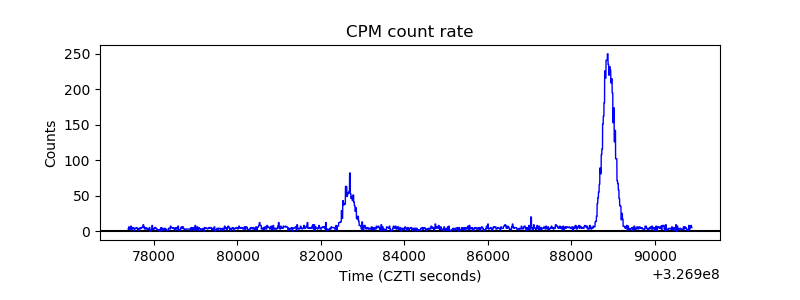 |
| CZT Counter | 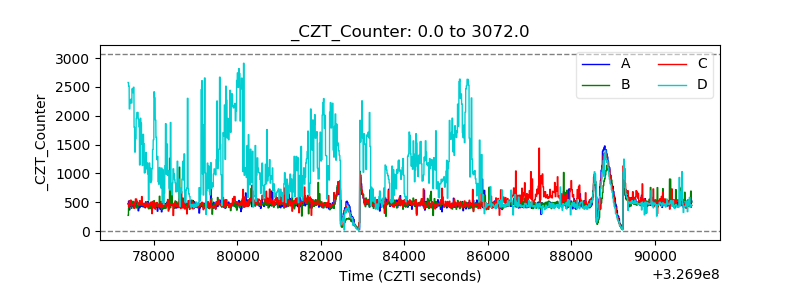 |
| +2.5 Volts monitor |  |
| +5 Volts monitor |  |
| _ROLL_ROT | 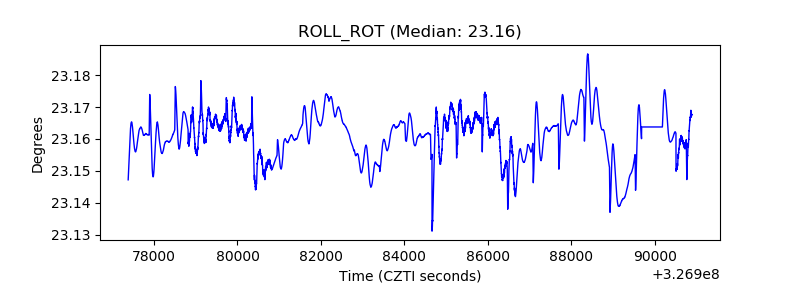 |
| _Roll_DEC | 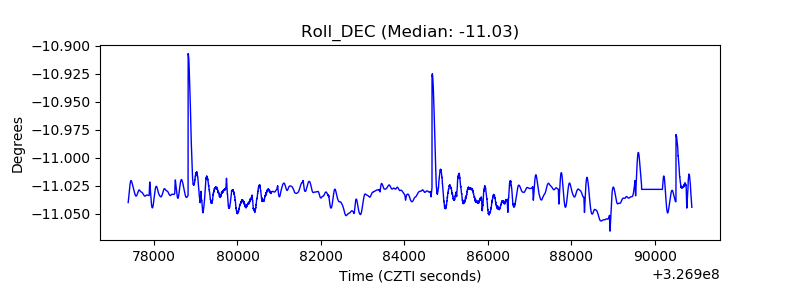 |
| _Roll_RA | 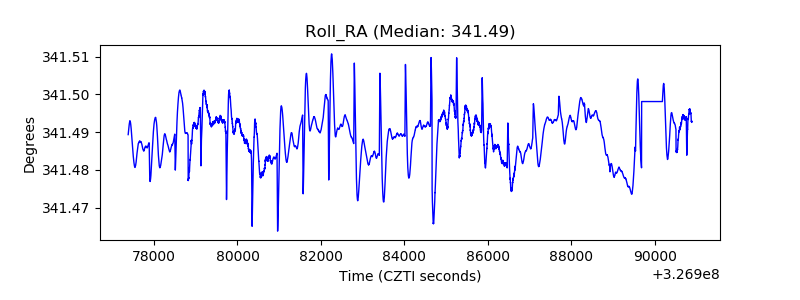 |
| Veto Counter | 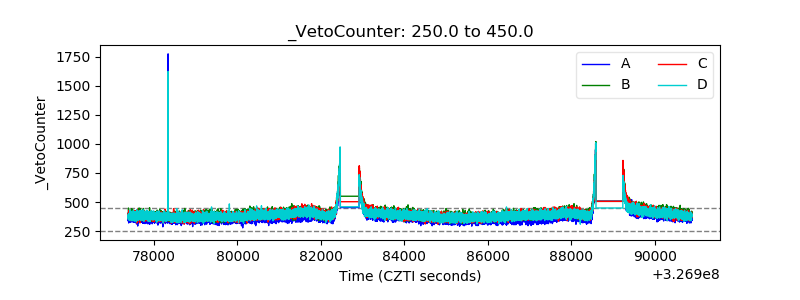 |