| Param | Original file | Final file |
|---|---|---|
| Filename | modeM0/AS1A07_127T03_9000003662_24992cztM0_level2.evt | modeM0/AS1A07_127T03_9000003662_24992cztM0_level2_quad_clean.evt |
| Size (bytes) | 474,831,360 | 69,822,720 |
| Size | 452.8 MB | 66.6 MB |
| Events in quadrant A | 3,399,960 | 413,068 |
| Events in quadrant B | 3,506,597 | 420,388 |
| Events in quadrant C | 3,485,280 | 399,810 |
| Events in quadrant D | 3,515,676 | 395,858 |
| Mode M0 | |||
|---|---|---|---|
| Quadrant | BADHDUFLAG | Total packets | Discarded packets |
| A | 0 | 14419 | 2 |
| B | 0 | 14660 | 2 |
| C | 0 | 14612 | 2 |
| D | 0 | 14894 | 2 |
| Mode SS | |||
|---|---|---|---|
| Quadrant | BADHDUFLAG | Total packets | Discarded packets |
| A | 0 | 142 | 0 |
| B | 0 | 142 | 0 |
| C | 0 | 142 | 0 |
| D | 0 | 142 | 0 |
| Mode M9 | |||
|---|---|---|---|
| Quadrant | BADHDUFLAG | Total packets | Discarded packets |
| A | 0 | 9 | 0 |
| B | 0 | 10 | 0 |
| C | 0 | 10 | 0 |
| D | 0 | 10 | 0 |
| Quadrant | Total seconds | Saturated seconds | Saturation percentage |
|---|---|---|---|
| A | 6959 | 70 | 1.005892% |
| B | 6959 | 84 | 1.207070% |
| C | 6959 | 109 | 1.566317% |
| D | 6959 | 60 | 0.862193% |
Noise dominated data is calculated using 1-second bins in cleaned event files. If a bin has >2000 counts, and if more than 50% of those come from <1% of pixels, then it is considered to be noise-dominated and hence unusable.
| Quadrant | # 1 sec bins | Bins with >0 counts | Bins with >2000 counts | High rate bins dominated by noise | Noise dominated (total time) | Noise dominated (detector-on time) | Marked lightcurve |
|---|---|---|---|---|---|---|---|
| A | 7814 | 6960 | 0 | 0 | 0.00% | 0.00% | 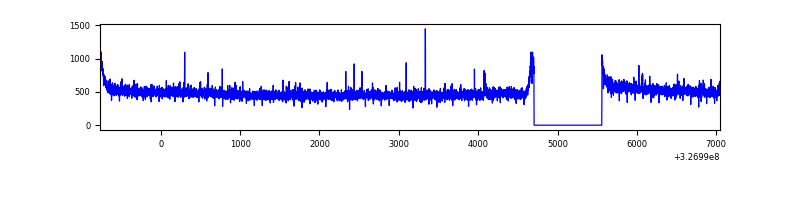 |
| B | 7814 | 6960 | 4 | 4 | 0.05% | 0.06% | 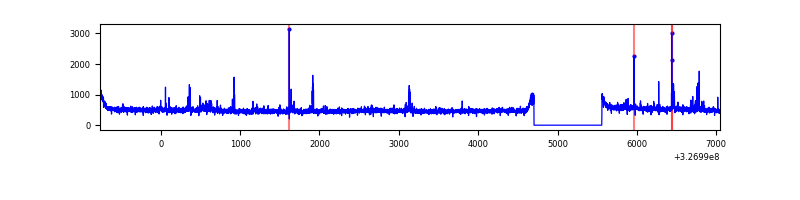 |
| C | 7814 | 6960 | 1 | 1 | 0.01% | 0.01% | 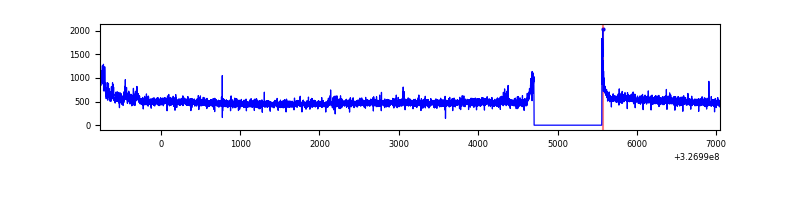 |
| D | 7814 | 6960 | 6 | 6 | 0.08% | 0.09% | 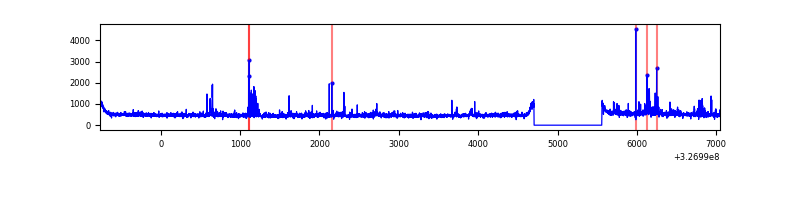 |
Top three noisy pixels from each quadrant. If the there are fewer than three noisy pixels in the level2.evt file, extra rows are filled as -1
| Pixel properties | Quadrant properties | ||||||
|---|---|---|---|---|---|---|---|
| Quadrant | DetID | PixID | Counts | Sigma | Mean | Median | Sigma |
| A | 6 | 16 | 21892 | 118.15 | 873 | 856 | 178.0 |
| A | 4 | 2 | 11958 | 62.35 | 873 | 856 | 178.0 |
| A | 13 | 254 | 10591 | 54.68 | 873 | 856 | 178.0 |
| B | 0 | 190 | 38634 | 227.52 | 865 | 842 | 166.1 |
| B | 10 | 246 | 24673 | 143.47 | 865 | 842 | 166.1 |
| B | 12 | 111 | 20524 | 118.49 | 865 | 842 | 166.1 |
| C | 14 | 238 | 132095 | 670.39 | 829 | 833 | 195.8 |
| C | 7 | 247 | 96648 | 489.36 | 829 | 833 | 195.8 |
| C | 0 | 10 | 17421 | 84.72 | 829 | 833 | 195.8 |
| D | 1 | 52 | 133499 | 644.09 | 848 | 825 | 206.0 |
| D | 8 | 195 | 74603 | 358.17 | 848 | 825 | 206.0 |
| D | 10 | 70 | 51763 | 247.29 | 848 | 825 | 206.0 |
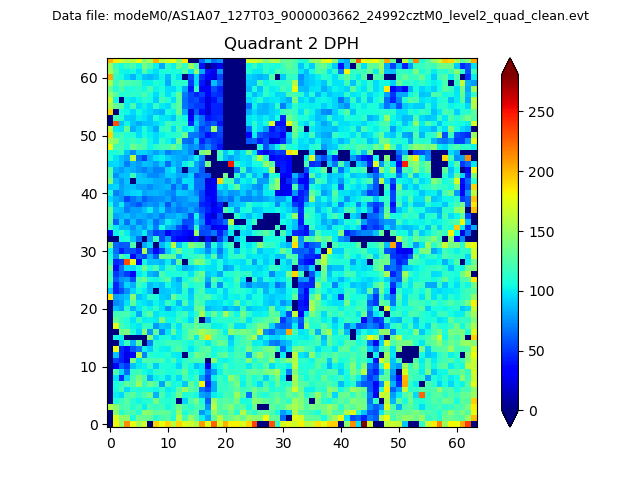
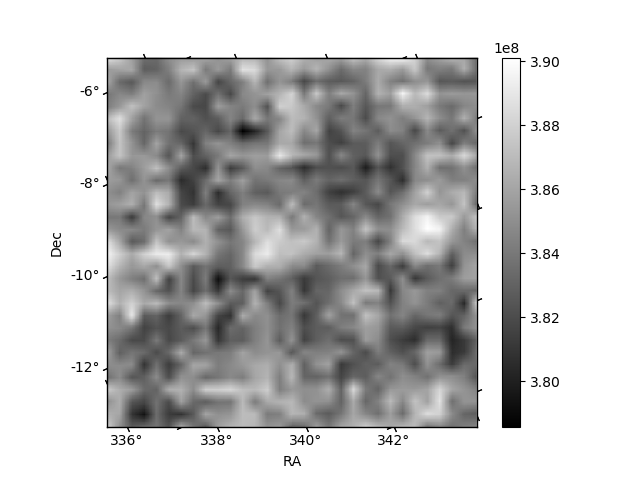
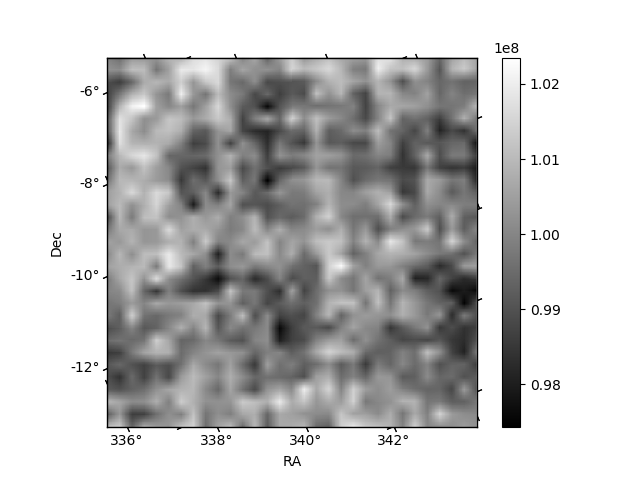
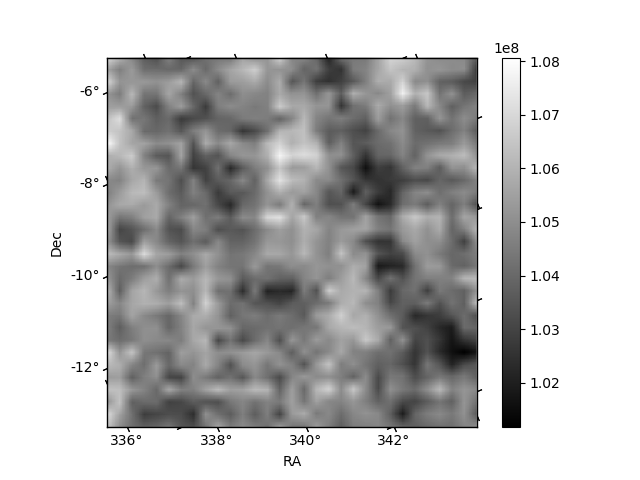
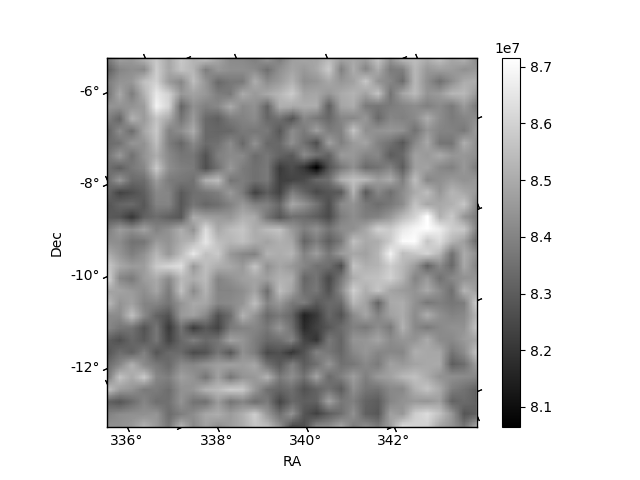
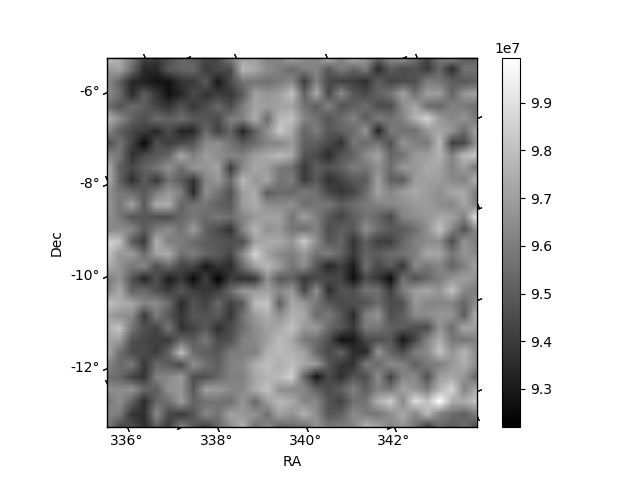
Histogram calculated using DETX and DETY for each event in the final _common_clean file
| Quadrant A | 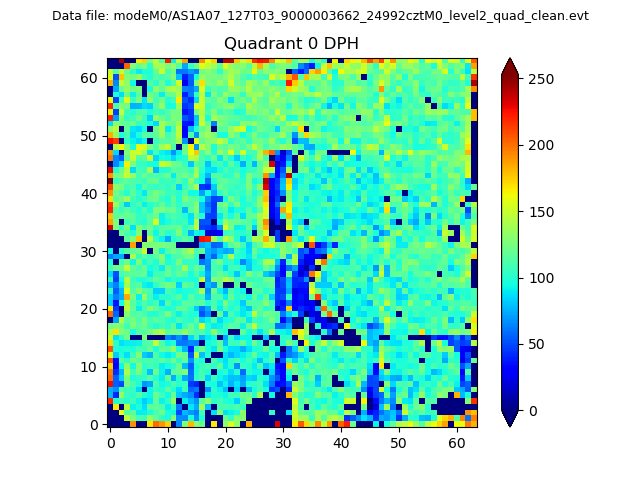 |
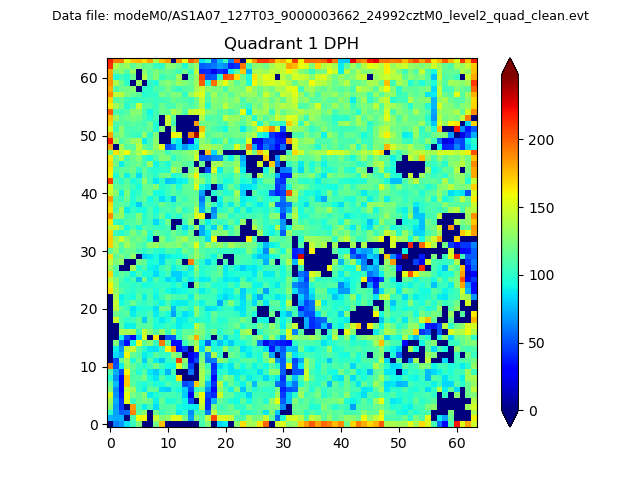 |
Quadrant B |
|---|---|---|---|
| Quadrant D | 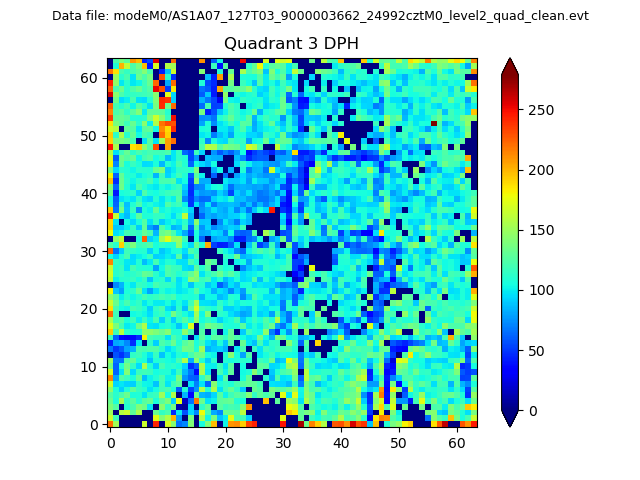 |
 |
Quadrant C |
| Plot type | Count rate plots | Images |
|---|---|---|
| Comparison with Poisson distribution Blue bars denote a histogram of data divided into 1 sec bins. Red curve is a Poisson curve with rate = median count rate of data. |
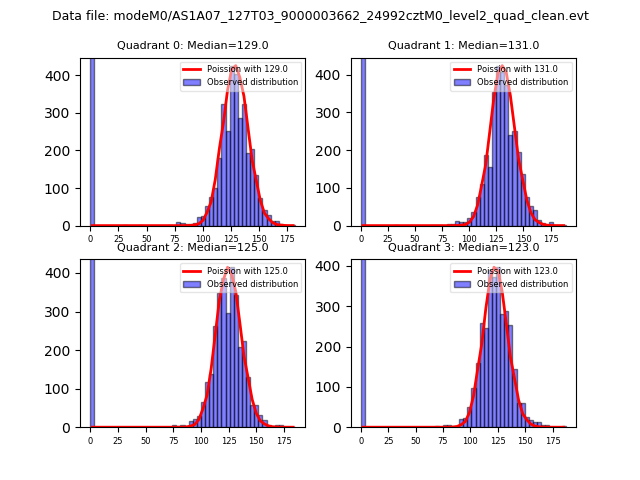 |
 |
| Quadrant-wise count rates Data is divided into 100 sec bins |
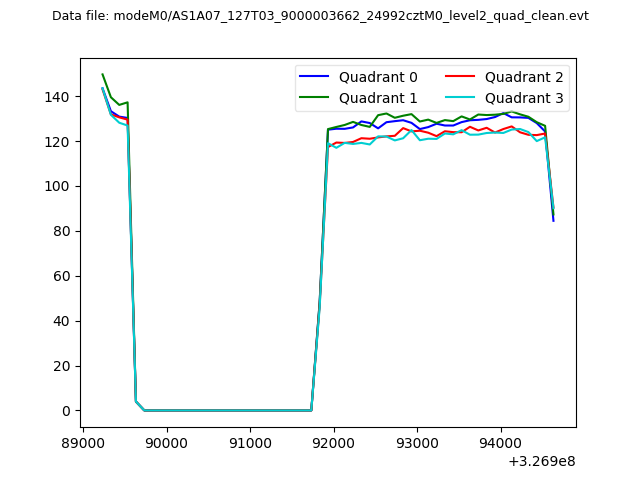 |
|
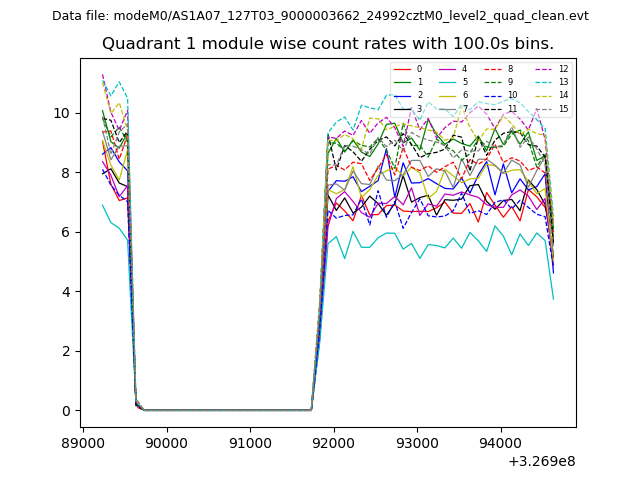
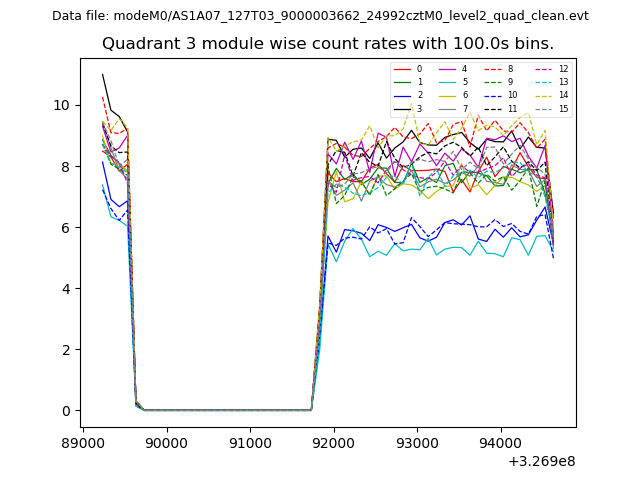
| Module-wise count rates for Quadrant A Data is divided into 100 sec bins |
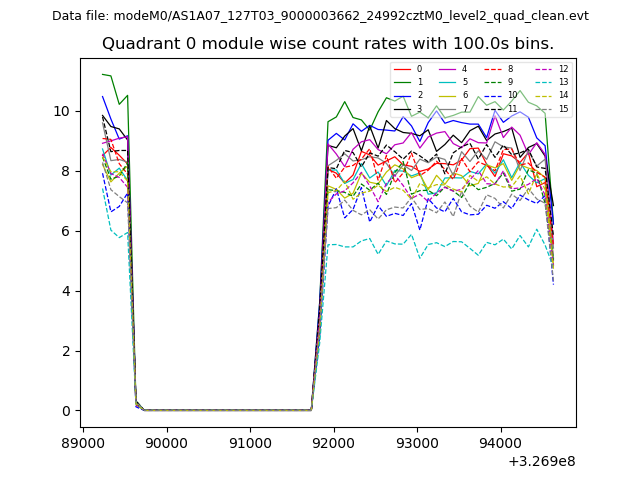 |
 |
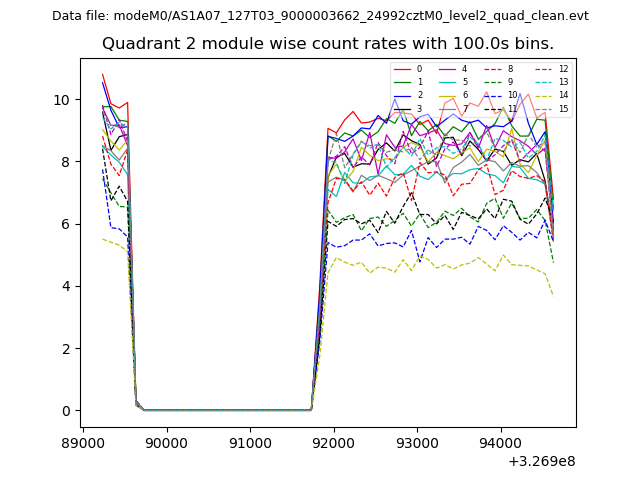
| Module-wise count rates for Quadrant B Data is divided into 100 sec bins |
 |
 |
| Module-wise count rates for Quadrant C Data is divided into 100 sec bins |
 |
 |
| Module-wise count rates for Quadrant D Data is divided into 100 sec bins |
 |
 |
| Parameter | Plot |
|---|---|
| CZT HV Monitor |  |
| D_VDD | 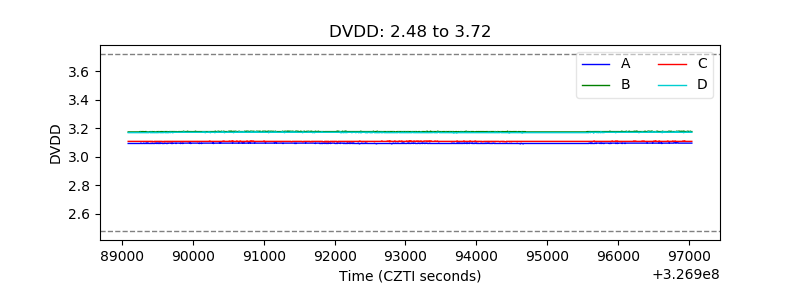 |
| Temperature 1 | 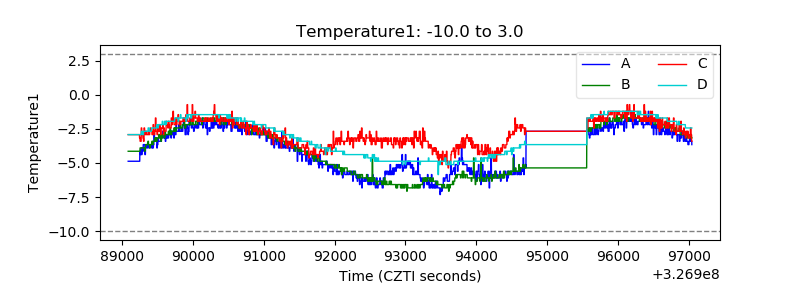 |
| Veto HV Monitor | 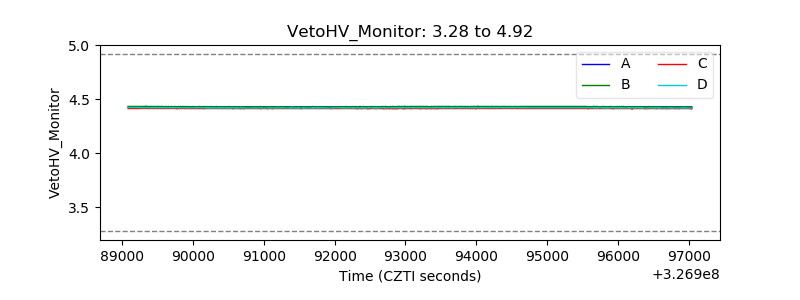 |
| Veto LLD | 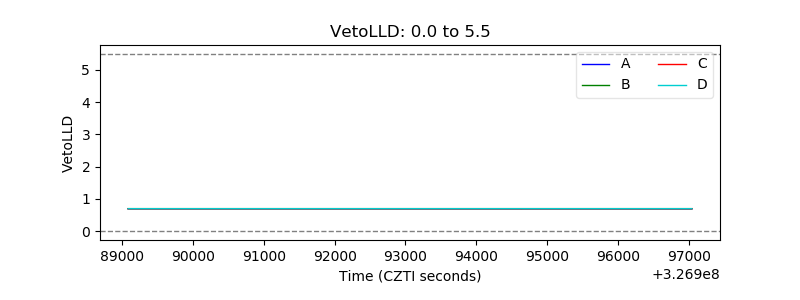 |
| Alpha Counter | 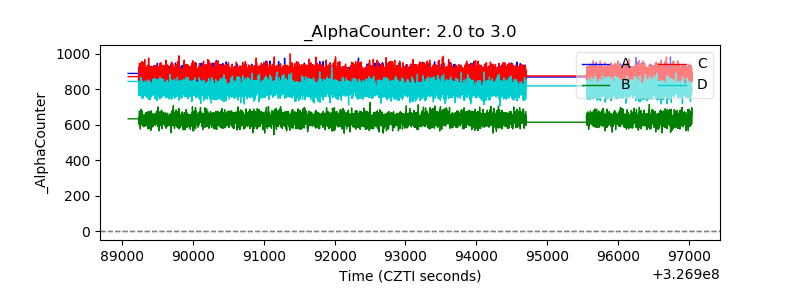 |
| _CPM_Rate | 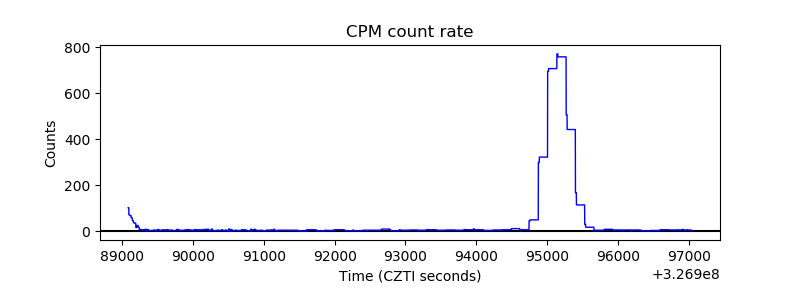 |
| CZT Counter | 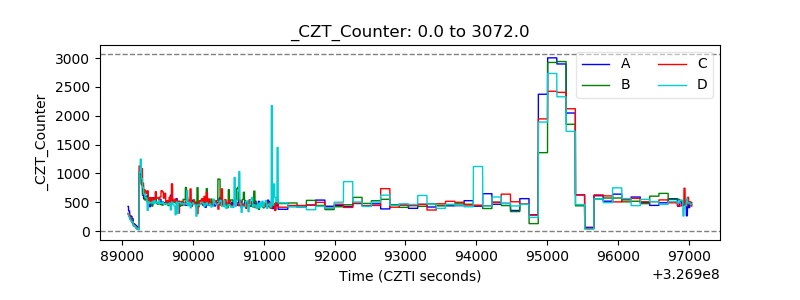 |
| +2.5 Volts monitor | 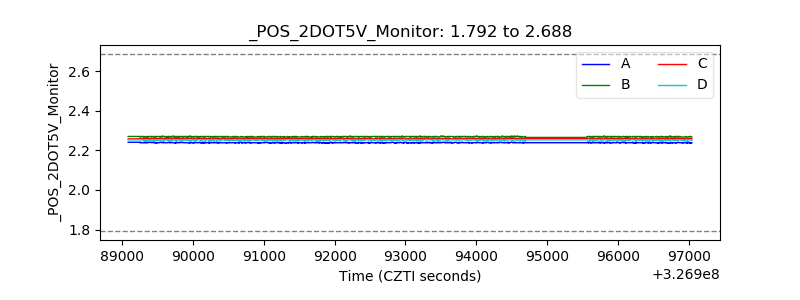 |
| +5 Volts monitor |  |
| _ROLL_ROT | 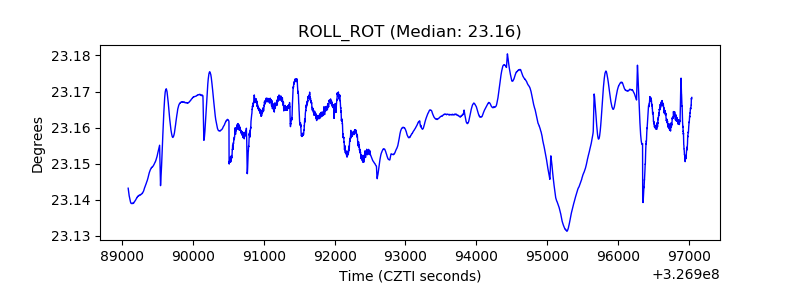 |
| _Roll_DEC | 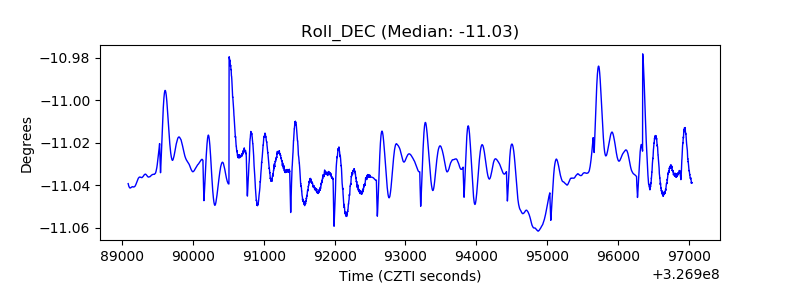 |
| _Roll_RA | 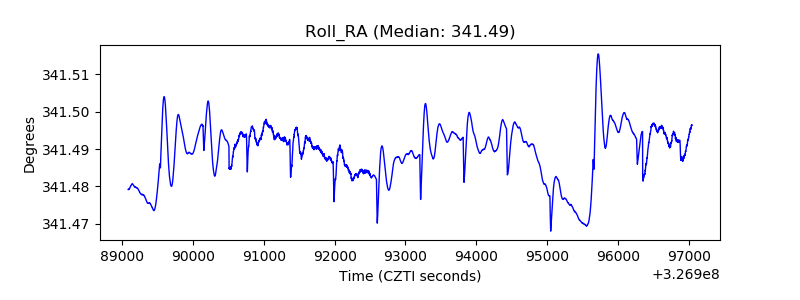 |
| Veto Counter | 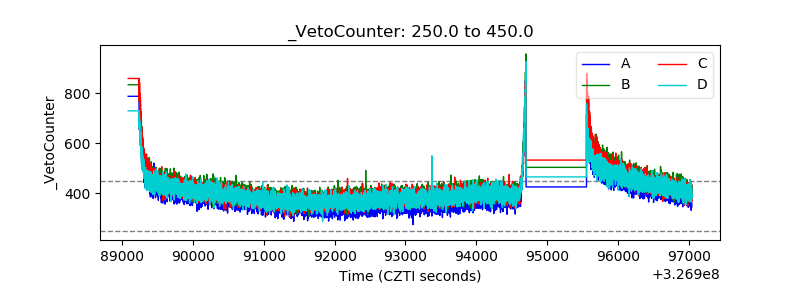 |