| Param | Original file | Final file |
|---|---|---|
| Filename | modeM0/AS1A07_127T03_9000003662_24993cztM0_level2.evt | modeM0/AS1A07_127T03_9000003662_24993cztM0_level2_quad_clean.evt |
| Size (bytes) | 461,039,040 | 66,663,360 |
| Size | 439.7 MB | 63.6 MB |
| Events in quadrant A | 3,249,845 | 399,592 |
| Events in quadrant B | 3,441,120 | 402,270 |
| Events in quadrant C | 3,332,030 | 381,813 |
| Events in quadrant D | 3,497,431 | 380,660 |
| Mode M0 | |||
|---|---|---|---|
| Quadrant | BADHDUFLAG | Total packets | Discarded packets |
| A | 0 | 13796 | 4 |
| B | 0 | 14385 | 2 |
| C | 0 | 13836 | 2 |
| D | 0 | 14667 | 2 |
| Mode SS | |||
|---|---|---|---|
| Quadrant | BADHDUFLAG | Total packets | Discarded packets |
| A | 0 | 134 | 0 |
| B | 0 | 134 | 0 |
| C | 0 | 134 | 0 |
| D | 0 | 134 | 0 |
| Mode M9 | |||
|---|---|---|---|
| Quadrant | BADHDUFLAG | Total packets | Discarded packets |
| A | 0 | 14 | 0 |
| B | 0 | 15 | 0 |
| C | 0 | 15 | 0 |
| D | 0 | 15 | 0 |
| Quadrant | Total seconds | Saturated seconds | Saturation percentage |
|---|---|---|---|
| A | 6504 | 58 | 0.891759% |
| B | 6504 | 86 | 1.322263% |
| C | 6504 | 107 | 1.645141% |
| D | 6504 | 60 | 0.922509% |
Noise dominated data is calculated using 1-second bins in cleaned event files. If a bin has >2000 counts, and if more than 50% of those come from <1% of pixels, then it is considered to be noise-dominated and hence unusable.
| Quadrant | # 1 sec bins | Bins with >0 counts | Bins with >2000 counts | High rate bins dominated by noise | Noise dominated (total time) | Noise dominated (detector-on time) | Marked lightcurve |
|---|---|---|---|---|---|---|---|
| A | 7529 | 6505 | 0 | 0 | 0.00% | 0.00% | 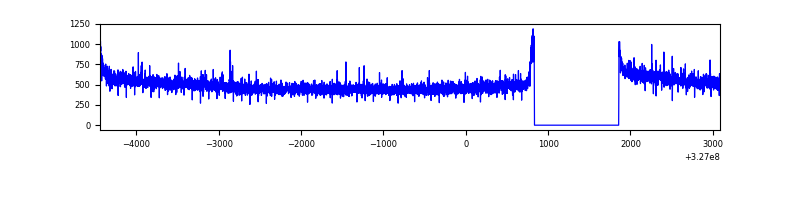 |
| B | 7529 | 6505 | 8 | 8 | 0.11% | 0.12% | 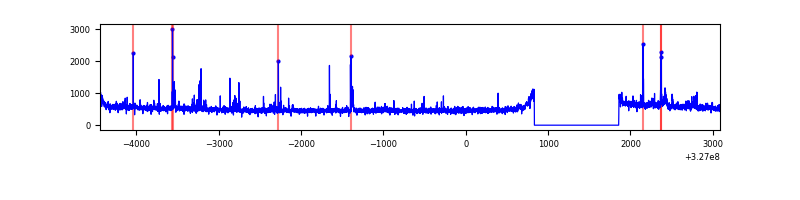 |
| C | 7529 | 6505 | 5 | 5 | 0.07% | 0.08% | 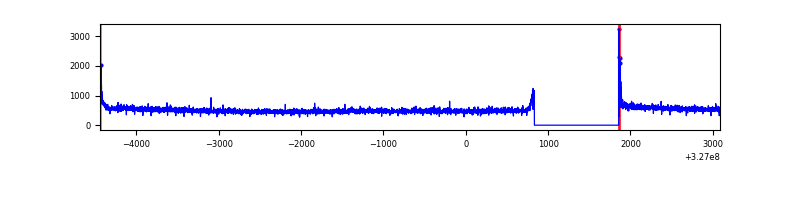 |
| D | 7529 | 6505 | 15 | 15 | 0.20% | 0.23% | 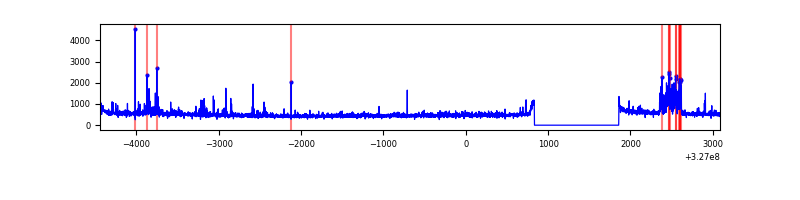 |
Top three noisy pixels from each quadrant. If the there are fewer than three noisy pixels in the level2.evt file, extra rows are filled as -1
| Pixel properties | Quadrant properties | ||||||
|---|---|---|---|---|---|---|---|
| Quadrant | DetID | PixID | Counts | Sigma | Mean | Median | Sigma |
| A | 6 | 16 | 11631 | 63.97 | 839 | 822 | 169.0 |
| A | 13 | 254 | 10686 | 58.38 | 839 | 822 | 169.0 |
| A | 3 | 137 | 7446 | 39.2 | 839 | 822 | 169.0 |
| B | 10 | 246 | 47984 | 296.51 | 832 | 811 | 159.1 |
| B | 5 | 172 | 41295 | 254.47 | 832 | 811 | 159.1 |
| B | 3 | 64 | 20100 | 121.24 | 832 | 811 | 159.1 |
| C | 14 | 238 | 126474 | 669.1 | 795 | 800 | 187.8 |
| C | 7 | 247 | 62271 | 327.28 | 795 | 800 | 187.8 |
| C | 0 | 10 | 43619 | 227.97 | 795 | 800 | 187.8 |
| D | 12 | 153 | 174833 | 884.21 | 813 | 791 | 196.8 |
| D | 8 | 195 | 136165 | 687.76 | 813 | 791 | 196.8 |
| D | 1 | 52 | 74858 | 376.29 | 813 | 791 | 196.8 |
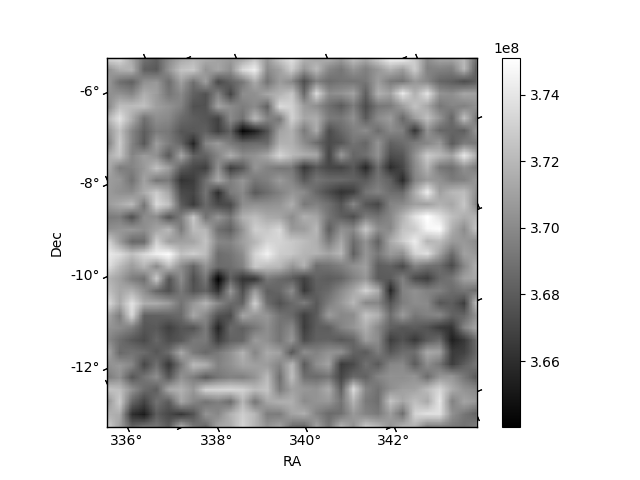
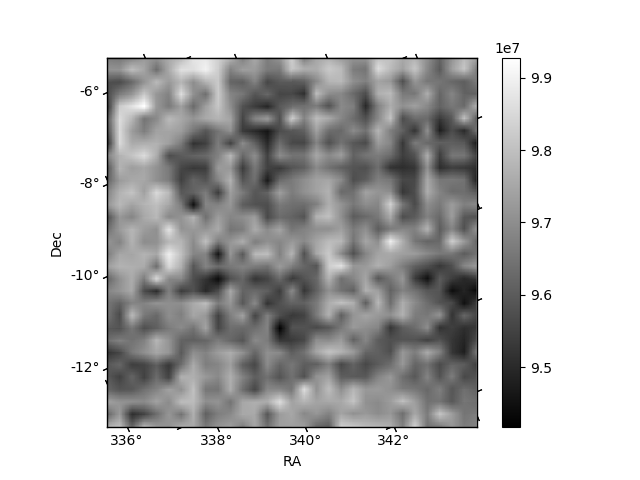
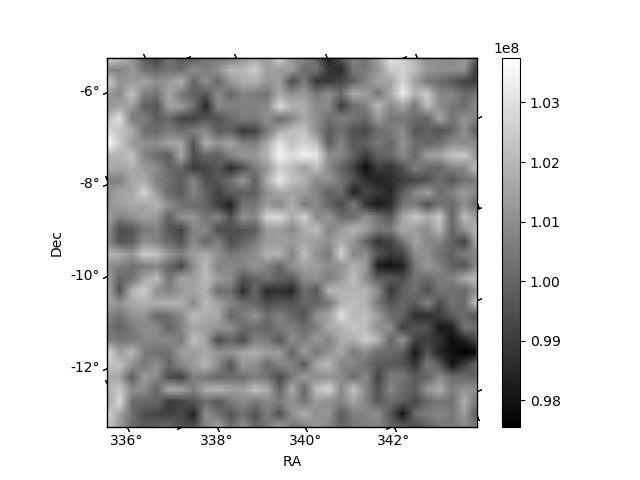
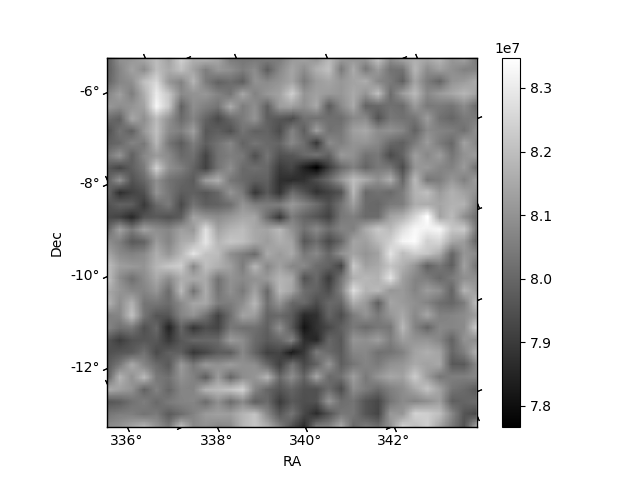
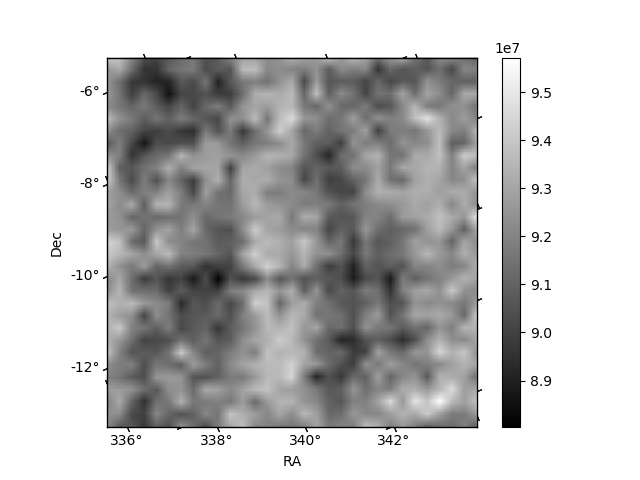
Histogram calculated using DETX and DETY for each event in the final _common_clean file
| Quadrant A | 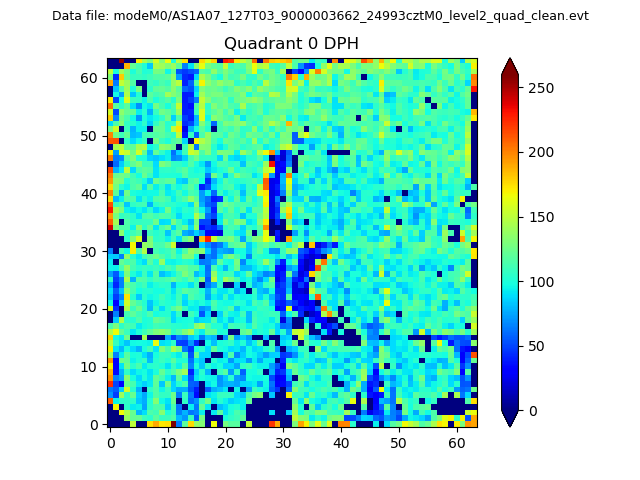 |
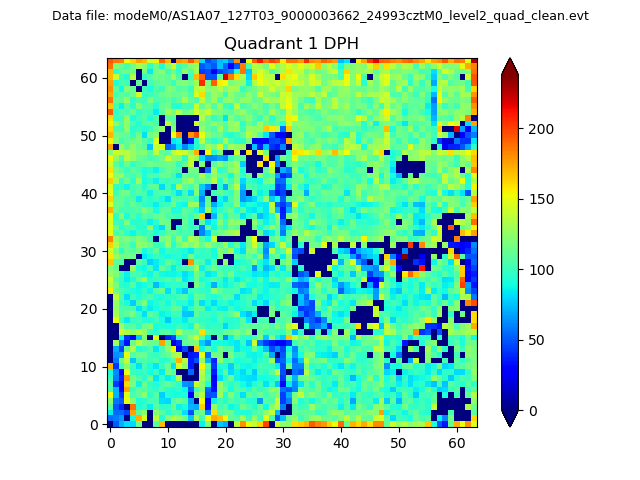 |
Quadrant B |
|---|---|---|---|
| Quadrant D | 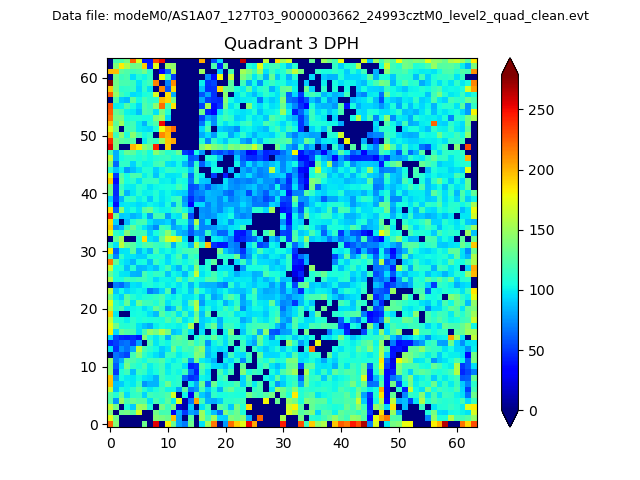 |
 |
Quadrant C |
| Plot type | Count rate plots | Images |
|---|---|---|
| Comparison with Poisson distribution Blue bars denote a histogram of data divided into 1 sec bins. Red curve is a Poisson curve with rate = median count rate of data. |
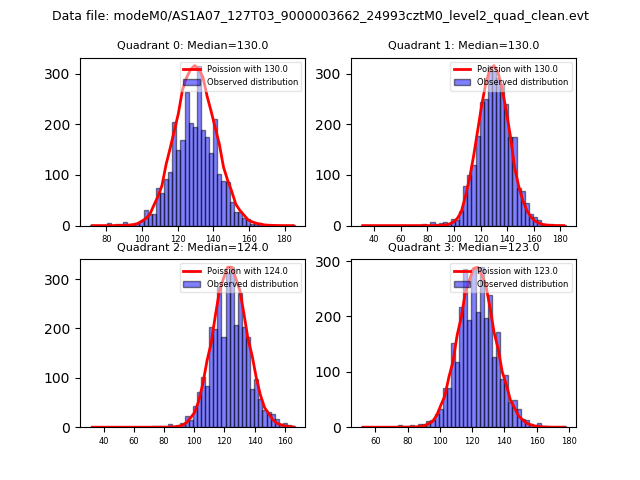 |
 |
| Quadrant-wise count rates Data is divided into 100 sec bins |
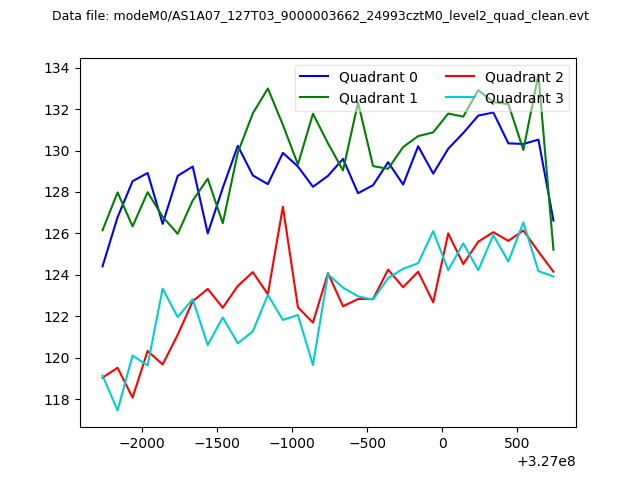 |
|
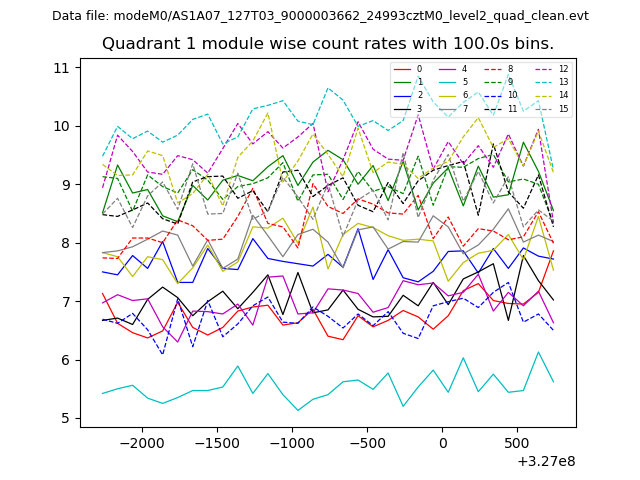
| Module-wise count rates for Quadrant A Data is divided into 100 sec bins |
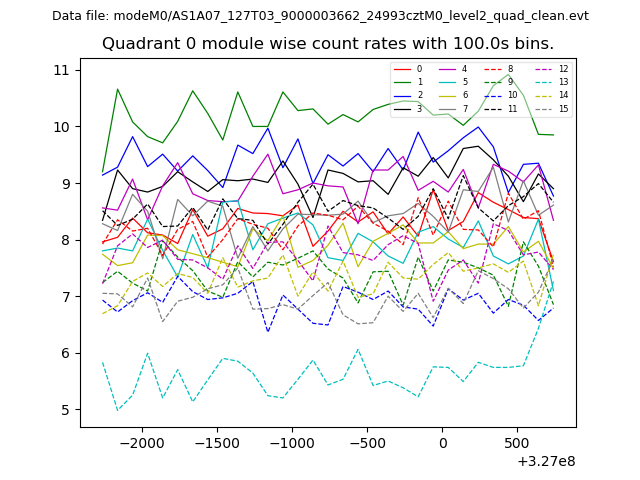 |
 |
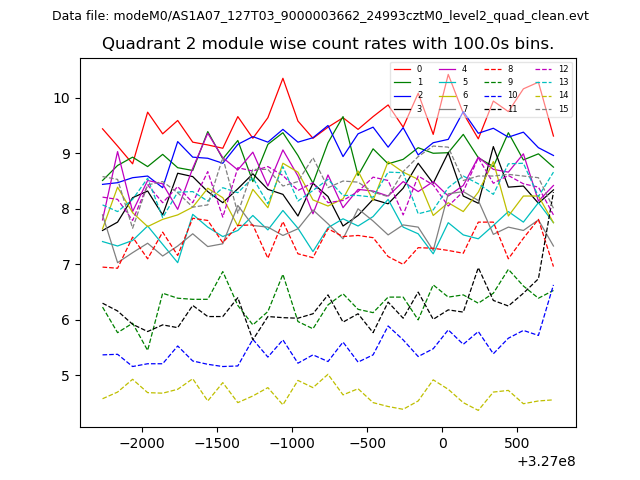
| Module-wise count rates for Quadrant B Data is divided into 100 sec bins |
 |
 |
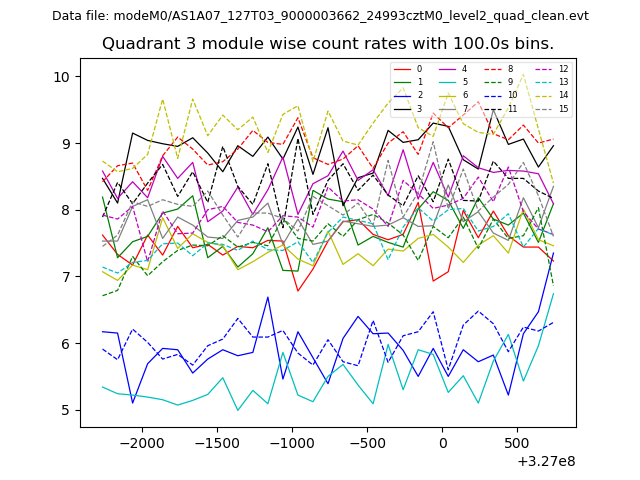
| Module-wise count rates for Quadrant C Data is divided into 100 sec bins |
 |
 |
| Module-wise count rates for Quadrant D Data is divided into 100 sec bins |
 |
 |
| Parameter | Plot |
|---|---|
| CZT HV Monitor |  |
| D_VDD | 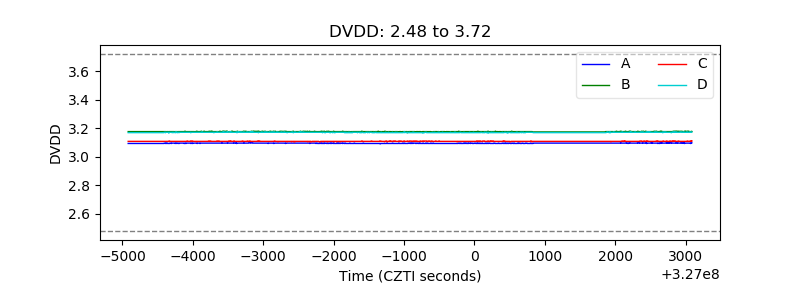 |
| Temperature 1 | 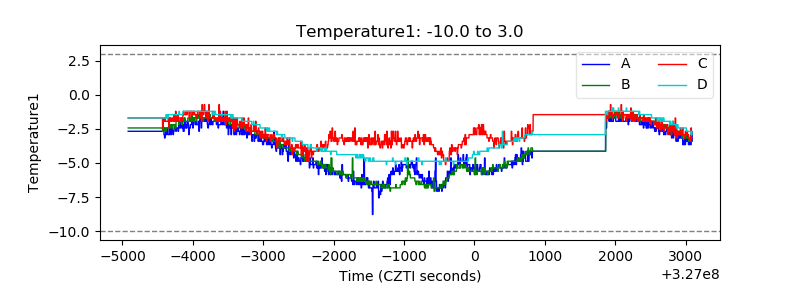 |
| Veto HV Monitor | 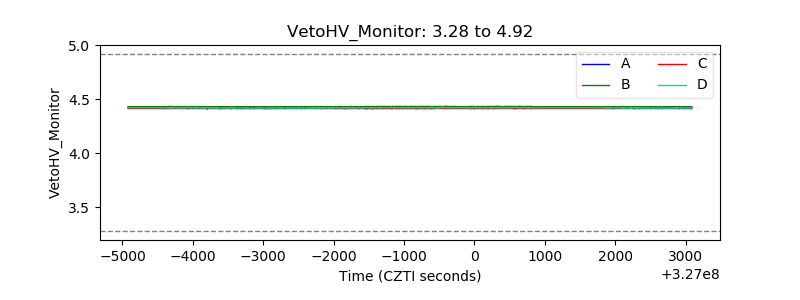 |
| Veto LLD | 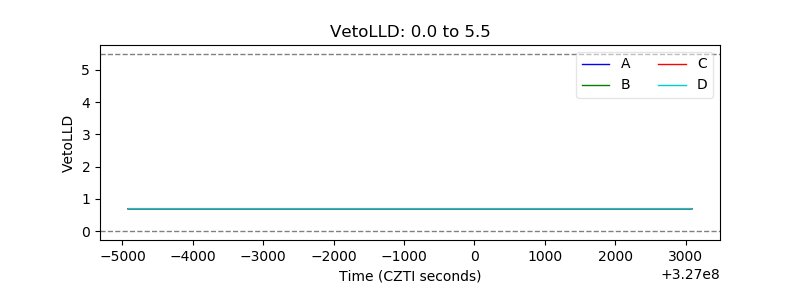 |
| Alpha Counter | 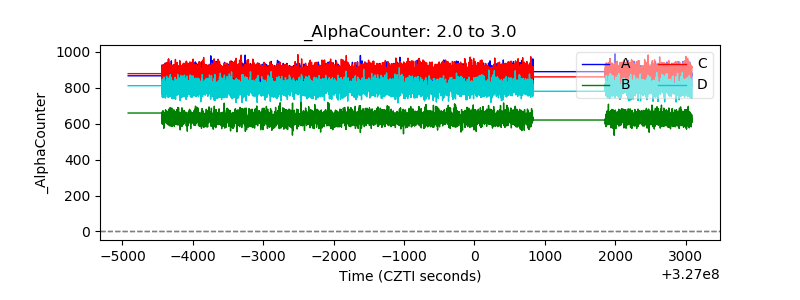 |
| _CPM_Rate | 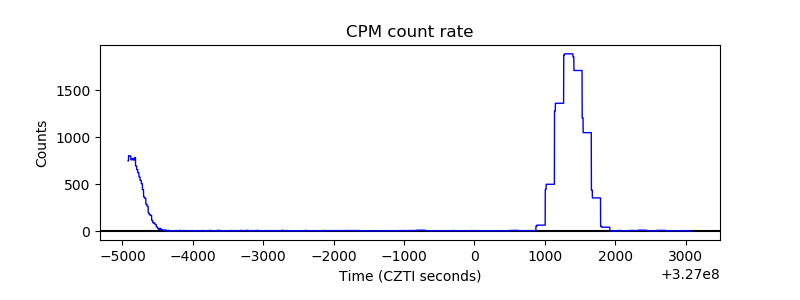 |
| CZT Counter | 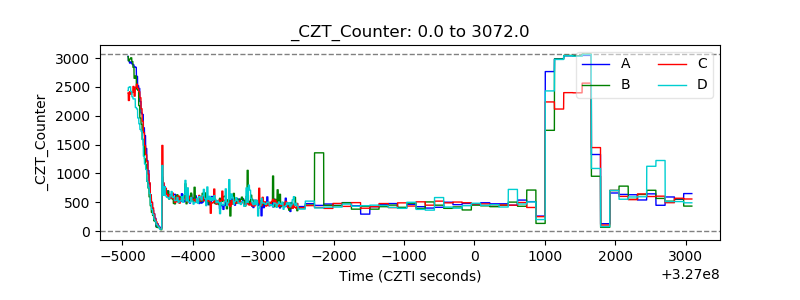 |
| +2.5 Volts monitor |  |
| +5 Volts monitor |  |
| _ROLL_ROT | 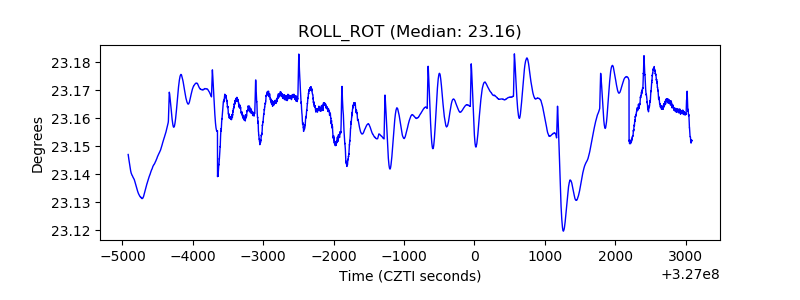 |
| _Roll_DEC | 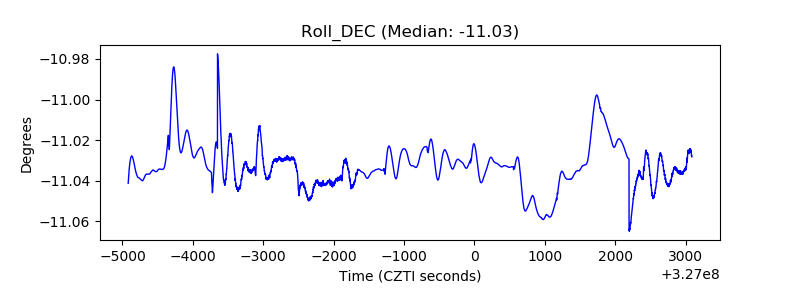 |
| _Roll_RA | 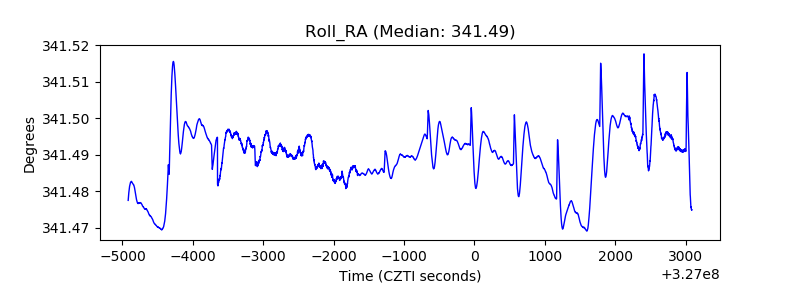 |
| Veto Counter | 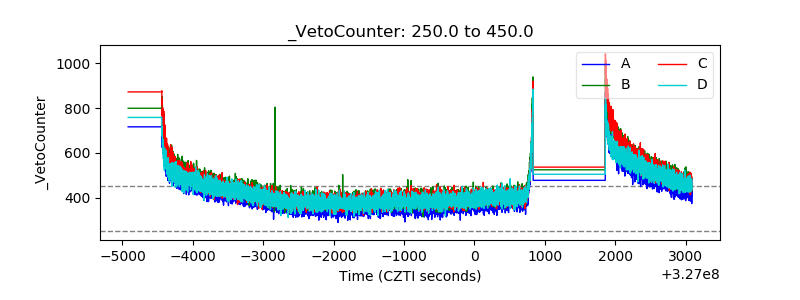 |