| Param | Original file | Final file |
|---|---|---|
| Filename | modeM0/AS1A07_127T03_9000003662_24995cztM0_level2.evt | modeM0/AS1A07_127T03_9000003662_24995cztM0_level2_quad_clean.evt |
| Size (bytes) | 476,265,600 | 73,679,040 |
| Size | 454.2 MB | 70.3 MB |
| Events in quadrant A | 3,319,671 | 453,693 |
| Events in quadrant B | 3,527,946 | 460,992 |
| Events in quadrant C | 3,612,394 | 436,189 |
| Events in quadrant D | 3,529,291 | 433,634 |
| Mode M0 | |||
|---|---|---|---|
| Quadrant | BADHDUFLAG | Total packets | Discarded packets |
| A | 0 | 14057 | 2 |
| B | 0 | 14705 | 2 |
| C | 0 | 14825 | 3 |
| D | 0 | 14794 | 2 |
| Mode SS | |||
|---|---|---|---|
| Quadrant | BADHDUFLAG | Total packets | Discarded packets |
| A | 0 | 130 | 0 |
| B | 0 | 130 | 0 |
| C | 0 | 130 | 0 |
| D | 0 | 130 | 0 |
| Mode M9 | |||
|---|---|---|---|
| Quadrant | BADHDUFLAG | Total packets | Discarded packets |
| A | 0 | 19 | 0 |
| B | 0 | 20 | 0 |
| C | 0 | 20 | 0 |
| D | 0 | 20 | 0 |
| Quadrant | Total seconds | Saturated seconds | Saturation percentage |
|---|---|---|---|
| A | 6400 | 58 | 0.906250% |
| B | 6400 | 82 | 1.281250% |
| C | 6399 | 138 | 2.156587% |
| D | 6399 | 55 | 0.859509% |
Noise dominated data is calculated using 1-second bins in cleaned event files. If a bin has >2000 counts, and if more than 50% of those come from <1% of pixels, then it is considered to be noise-dominated and hence unusable.
| Quadrant | # 1 sec bins | Bins with >0 counts | Bins with >2000 counts | High rate bins dominated by noise | Noise dominated (total time) | Noise dominated (detector-on time) | Marked lightcurve |
|---|---|---|---|---|---|---|---|
| A | 7575 | 6401 | 1 | 1 | 0.01% | 0.02% | 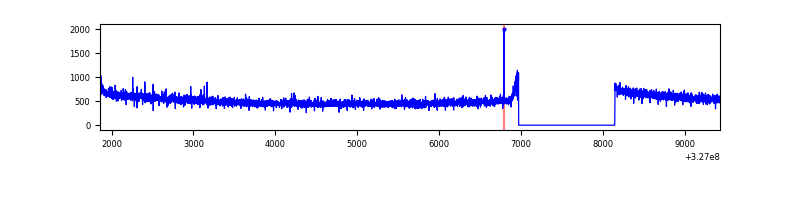 |
| B | 7575 | 6401 | 6 | 6 | 0.08% | 0.09% | 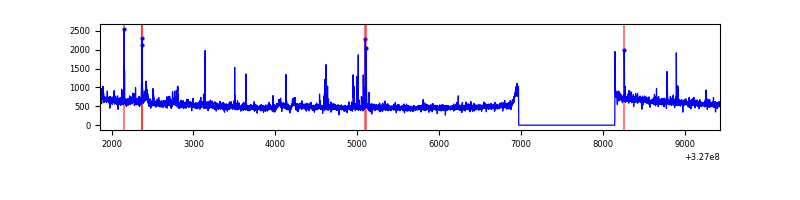 |
| C | 7574 | 6400 | 15 | 15 | 0.20% | 0.23% | 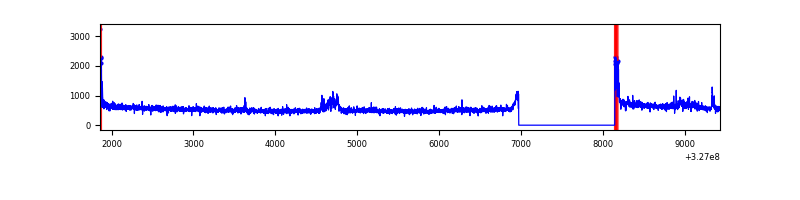 |
| D | 7574 | 6400 | 13 | 13 | 0.17% | 0.20% | 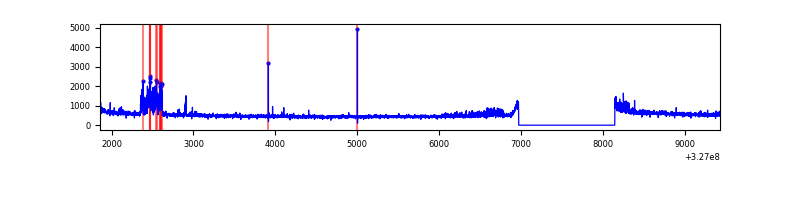 |
Top three noisy pixels from each quadrant. If the there are fewer than three noisy pixels in the level2.evt file, extra rows are filled as -1
| Pixel properties | Quadrant properties | ||||||
|---|---|---|---|---|---|---|---|
| Quadrant | DetID | PixID | Counts | Sigma | Mean | Median | Sigma |
| A | 13 | 254 | 9778 | 52.82 | 858 | 840 | 169.2 |
| A | 3 | 137 | 7529 | 39.53 | 858 | 840 | 169.2 |
| A | 0 | 226 | 7395 | 38.74 | 858 | 840 | 169.2 |
| B | 5 | 172 | 59636 | 365.47 | 856 | 837 | 160.9 |
| B | 0 | 229 | 29358 | 177.27 | 856 | 837 | 160.9 |
| B | 3 | 209 | 29166 | 176.08 | 856 | 837 | 160.9 |
| C | 7 | 247 | 205641 | 1076.1 | 818 | 827 | 190.3 |
| C | 14 | 238 | 131320 | 685.62 | 818 | 827 | 190.3 |
| C | 0 | 10 | 84545 | 439.86 | 818 | 827 | 190.3 |
| D | 12 | 153 | 181517 | 894.51 | 835 | 813 | 202.0 |
| D | 8 | 195 | 164421 | 809.88 | 835 | 813 | 202.0 |
| D | 2 | 234 | 26631 | 127.8 | 835 | 813 | 202.0 |
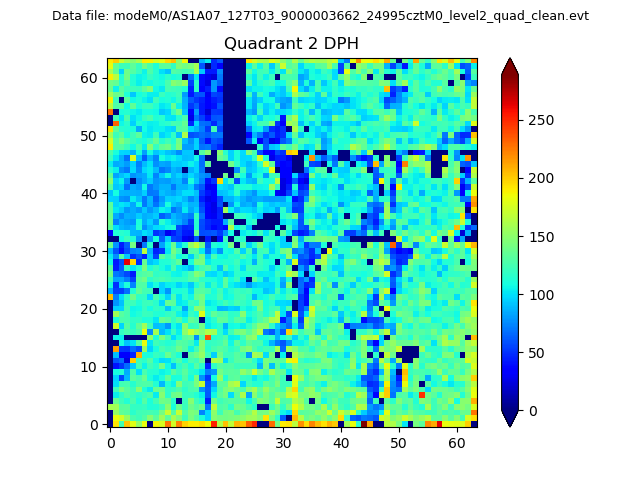
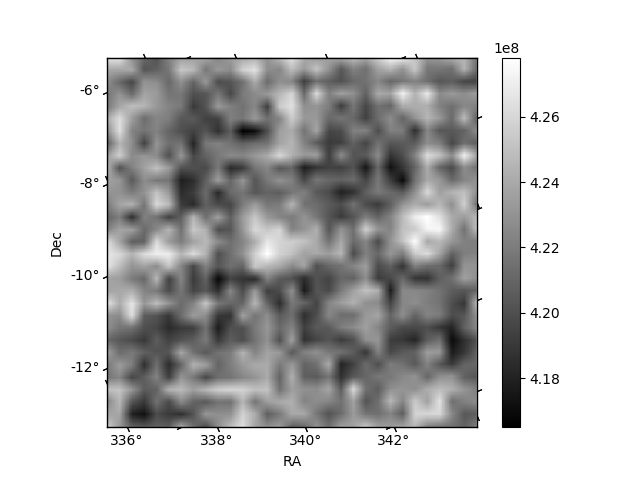
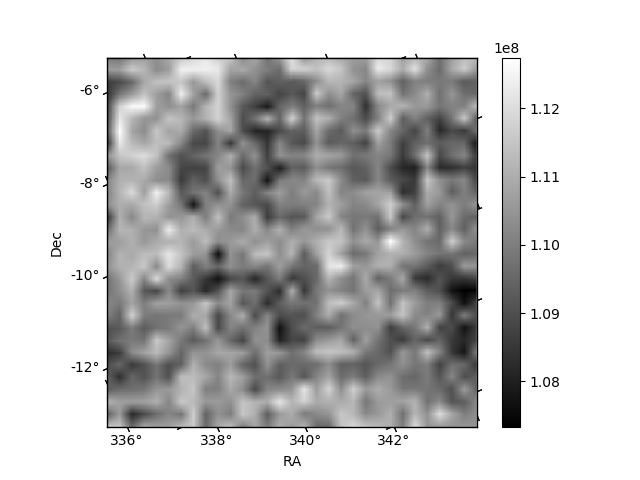
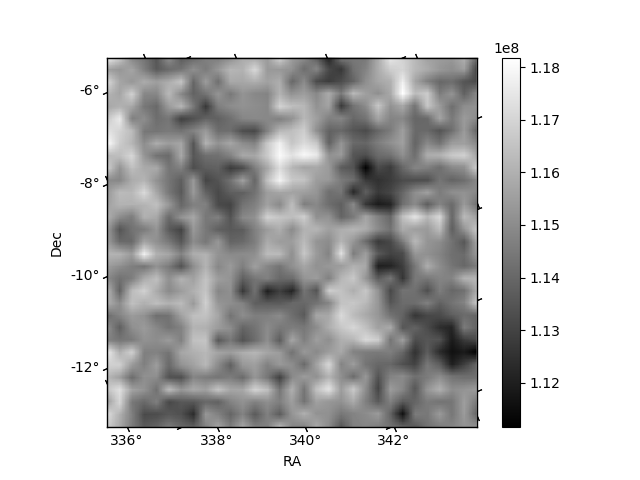
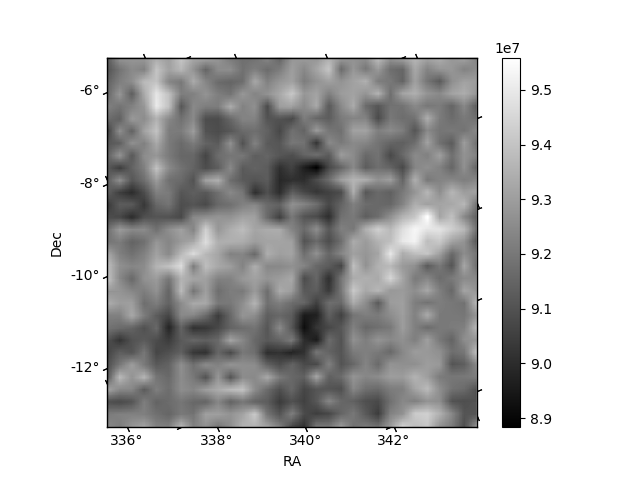
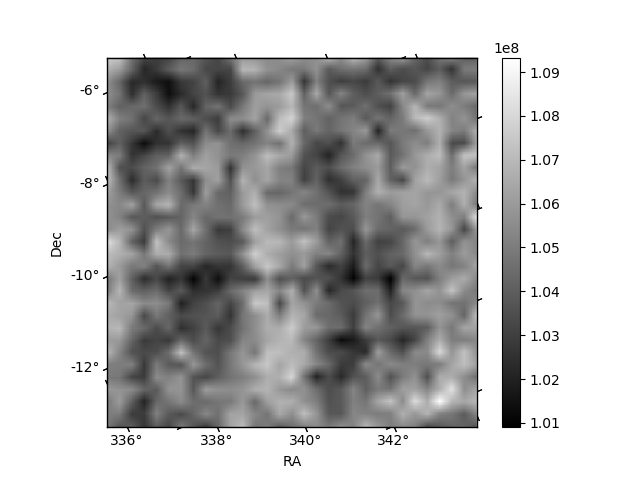
Histogram calculated using DETX and DETY for each event in the final _common_clean file
| Quadrant A | 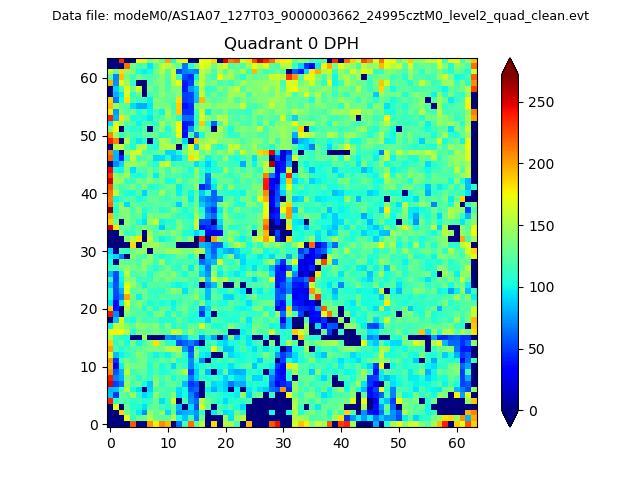 |
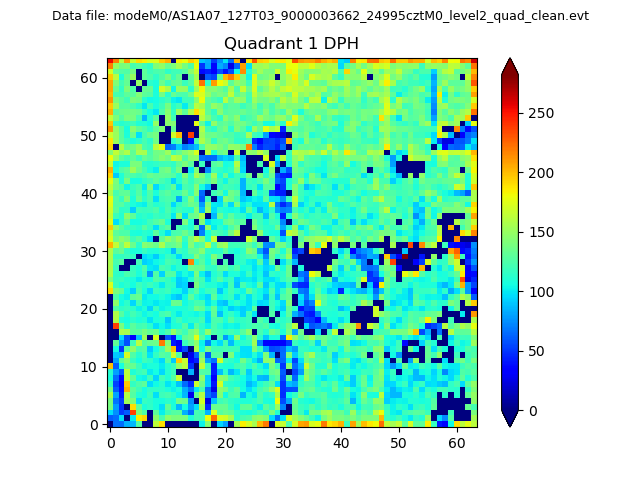 |
Quadrant B |
|---|---|---|---|
| Quadrant D | 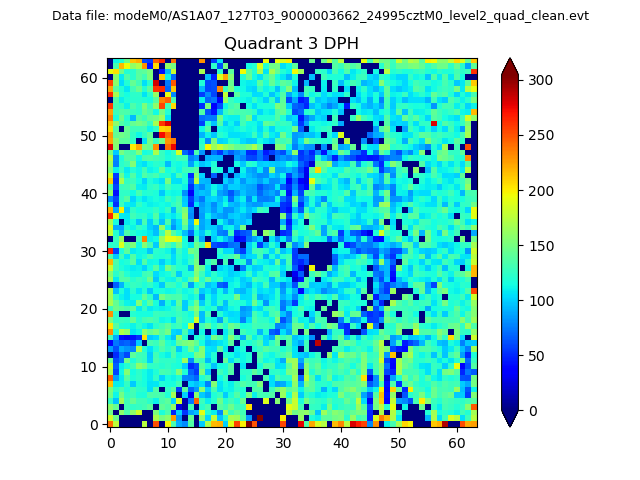 |
 |
Quadrant C |
| Plot type | Count rate plots | Images |
|---|---|---|
| Comparison with Poisson distribution Blue bars denote a histogram of data divided into 1 sec bins. Red curve is a Poisson curve with rate = median count rate of data. |
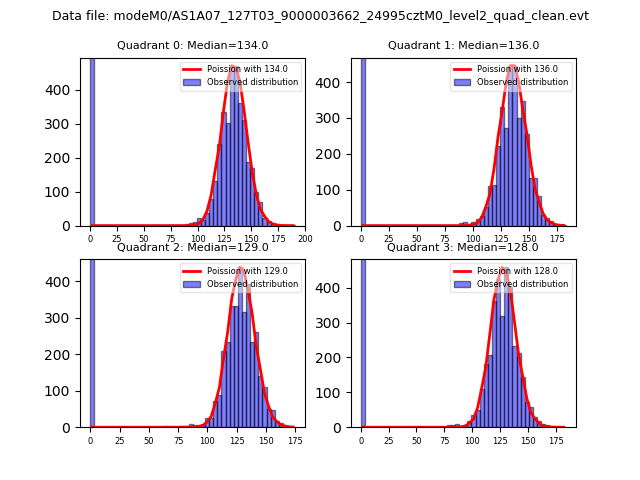 |
 |
| Quadrant-wise count rates Data is divided into 100 sec bins |
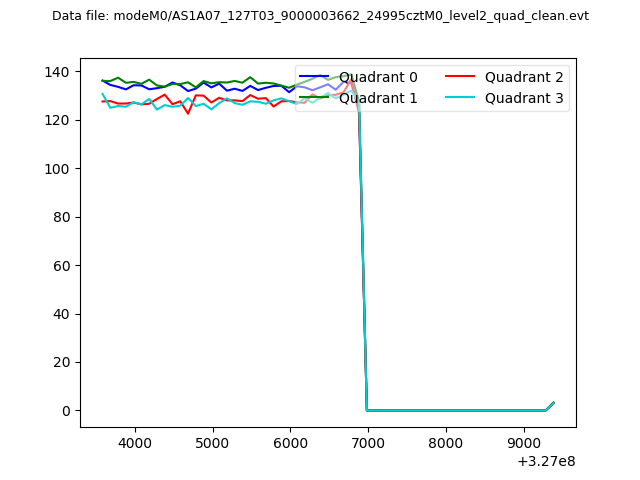 |
|
| Module-wise count rates for Quadrant A Data is divided into 100 sec bins |
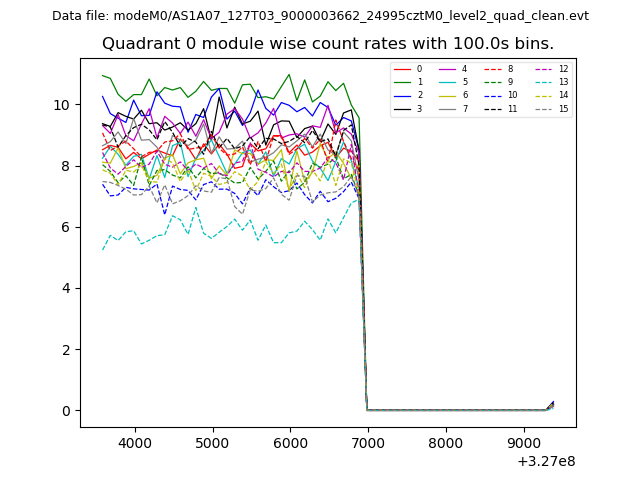 |
 |
| Module-wise count rates for Quadrant B Data is divided into 100 sec bins |
 |
 |
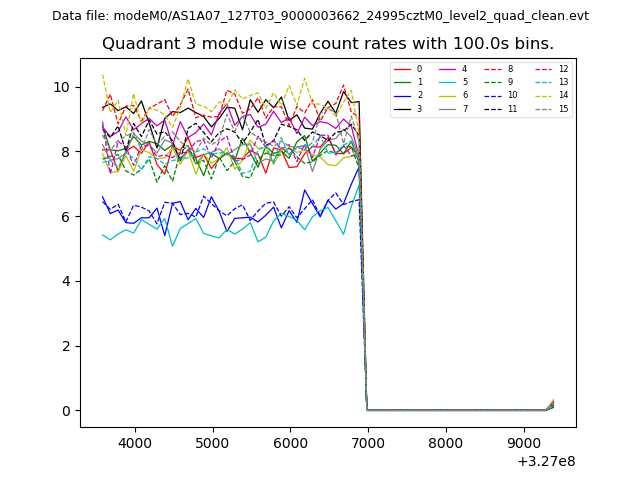
| Module-wise count rates for Quadrant C Data is divided into 100 sec bins |
 |
 |
| Module-wise count rates for Quadrant D Data is divided into 100 sec bins |
 |
 |
| Parameter | Plot |
|---|---|
| CZT HV Monitor |  |
| D_VDD | 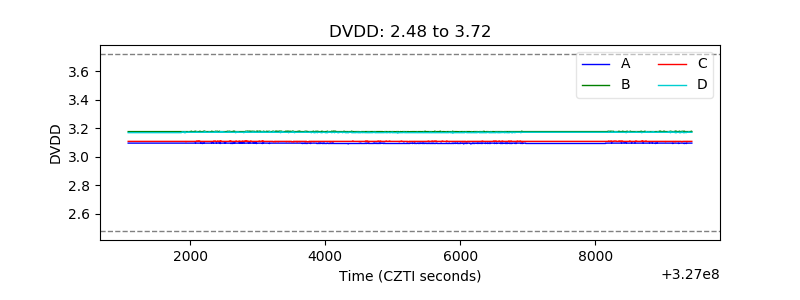 |
| Temperature 1 | 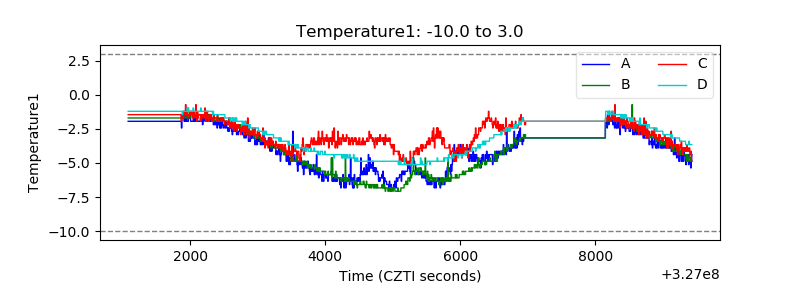 |
| Veto HV Monitor | 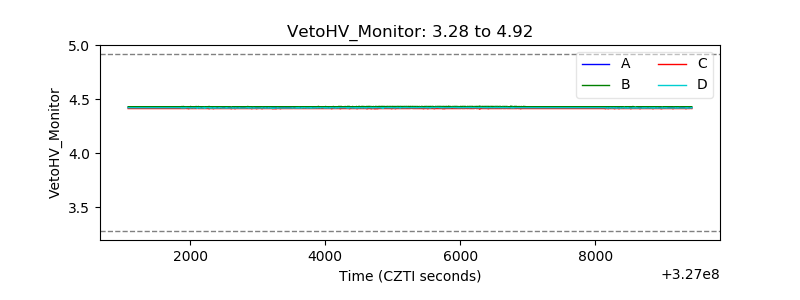 |
| Veto LLD | 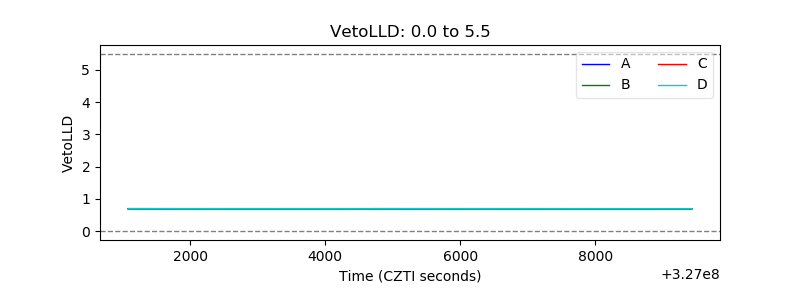 |
| Alpha Counter | 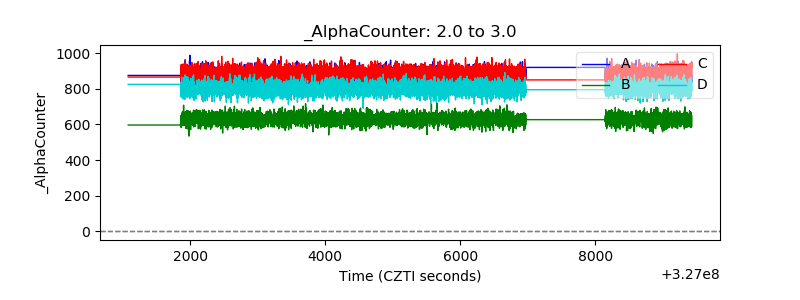 |
| _CPM_Rate | 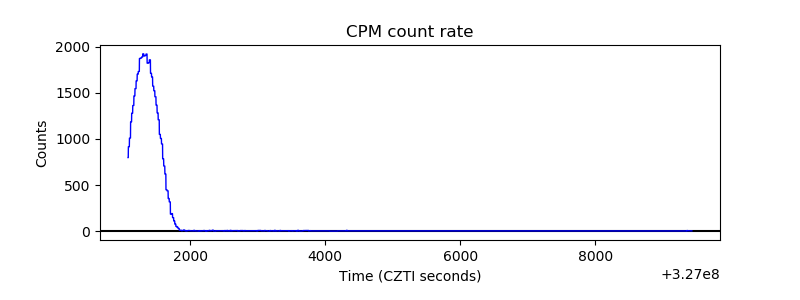 |
| CZT Counter | 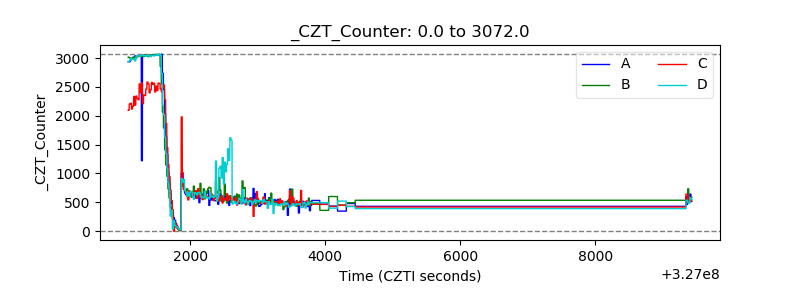 |
| +2.5 Volts monitor | 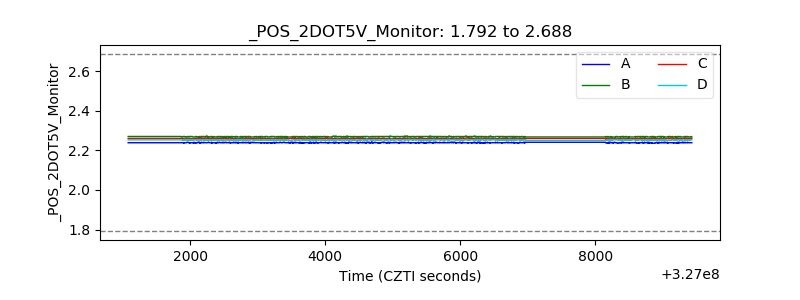 |
| +5 Volts monitor |  |
| _ROLL_ROT | 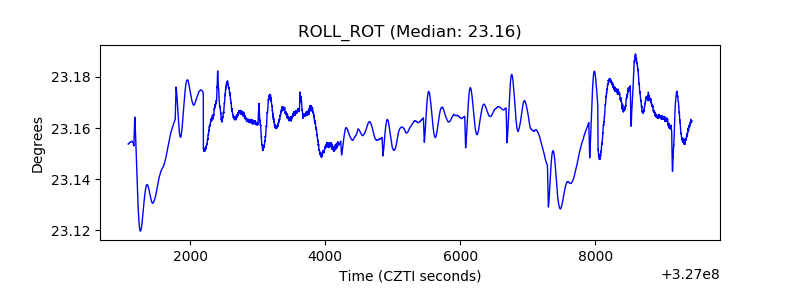 |
| _Roll_DEC | 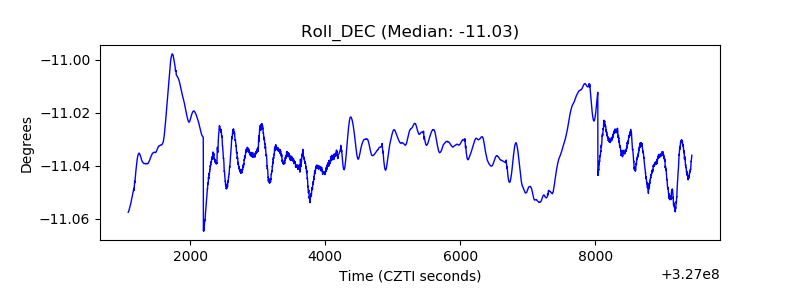 |
| _Roll_RA | 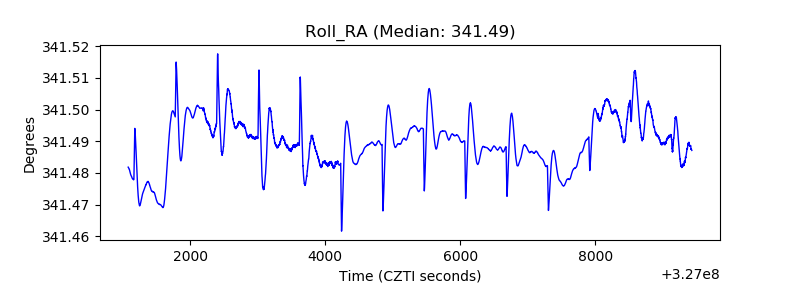 |
| Veto Counter |  |