| Param | Original file | Final file |
|---|---|---|
| Filename | modeM0/AS1A07_127T03_9000003662_24997cztM0_level2.evt | modeM0/AS1A07_127T03_9000003662_24997cztM0_level2_quad_clean.evt |
| Size (bytes) | 588,928,320 | 100,733,760 |
| Size | 561.6 MB | 96.1 MB |
| Events in quadrant A | 3,415,090 | 664,587 |
| Events in quadrant B | 3,583,739 | 684,295 |
| Events in quadrant C | 6,255,389 | 638,290 |
| Events in quadrant D | 4,164,539 | 633,151 |
| Mode M0 | |||
|---|---|---|---|
| Quadrant | BADHDUFLAG | Total packets | Discarded packets |
| A | 0 | 14143 | 2 |
| B | 0 | 14723 | 3 |
| C | 0 | 23023 | 2 |
| D | 0 | 16661 | 2 |
| Mode SS | |||
|---|---|---|---|
| Quadrant | BADHDUFLAG | Total packets | Discarded packets |
| A | 0 | 128 | 0 |
| B | 0 | 128 | 0 |
| C | 0 | 128 | 0 |
| D | 0 | 128 | 0 |
| Mode M9 | |||
|---|---|---|---|
| Quadrant | BADHDUFLAG | Total packets | Discarded packets |
| A | 0 | 26 | 0 |
| B | 0 | 26 | 0 |
| C | 0 | 26 | 0 |
| D | 0 | 26 | 0 |
| Quadrant | Total seconds | Saturated seconds | Saturation percentage |
|---|---|---|---|
| A | 6163 | 102 | 1.655038% |
| B | 6163 | 149 | 2.417654% |
| C | 6163 | 743 | 12.055817% |
| D | 6163 | 98 | 1.590135% |
Noise dominated data is calculated using 1-second bins in cleaned event files. If a bin has >2000 counts, and if more than 50% of those come from <1% of pixels, then it is considered to be noise-dominated and hence unusable.
| Quadrant | # 1 sec bins | Bins with >0 counts | Bins with >2000 counts | High rate bins dominated by noise | Noise dominated (total time) | Noise dominated (detector-on time) | Marked lightcurve |
|---|---|---|---|---|---|---|---|
| A | 8808 | 6165 | 0 | 0 | 0.00% | 0.00% | 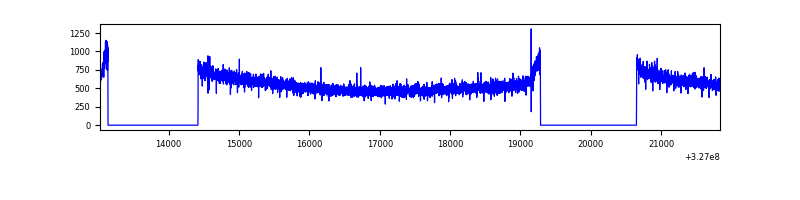 |
| B | 8808 | 6165 | 7 | 7 | 0.08% | 0.11% | 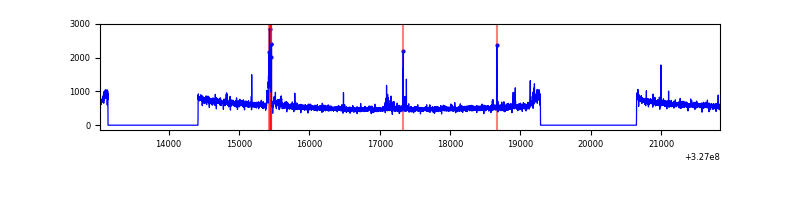 |
| C | 8808 | 6165 | 238 | 238 | 2.70% | 3.86% | 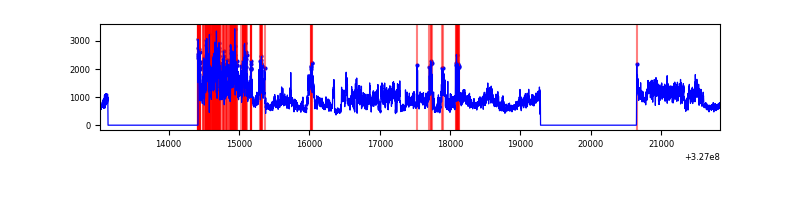 |
| D | 8808 | 6165 | 28 | 28 | 0.32% | 0.45% | 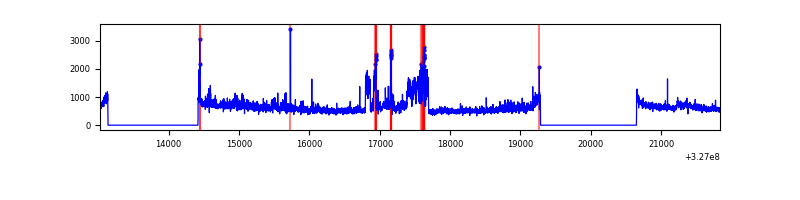 |
Top three noisy pixels from each quadrant. If the there are fewer than three noisy pixels in the level2.evt file, extra rows are filled as -1
| Pixel properties | Quadrant properties | ||||||
|---|---|---|---|---|---|---|---|
| Quadrant | DetID | PixID | Counts | Sigma | Mean | Median | Sigma |
| A | 13 | 254 | 9394 | 48.7 | 885 | 870 | 175.0 |
| A | 0 | 226 | 7534 | 38.08 | 885 | 870 | 175.0 |
| A | 3 | 137 | 7531 | 38.06 | 885 | 870 | 175.0 |
| B | 3 | 64 | 70452 | 424.32 | 886 | 868 | 164.0 |
| B | 4 | 80 | 19500 | 113.62 | 886 | 868 | 164.0 |
| B | 12 | 111 | 19047 | 110.86 | 886 | 868 | 164.0 |
| C | 7 | 247 | 2757356 | 14128.53 | 841 | 850 | 195.1 |
| C | 14 | 238 | 134744 | 686.28 | 841 | 850 | 195.1 |
| C | 0 | 10 | 44574 | 224.11 | 841 | 850 | 195.1 |
| D | 7 | 238 | 546994 | 2598.87 | 872 | 850 | 210.1 |
| D | 8 | 195 | 283339 | 1344.25 | 872 | 850 | 210.1 |
| D | 2 | 234 | 24803 | 113.98 | 872 | 850 | 210.1 |
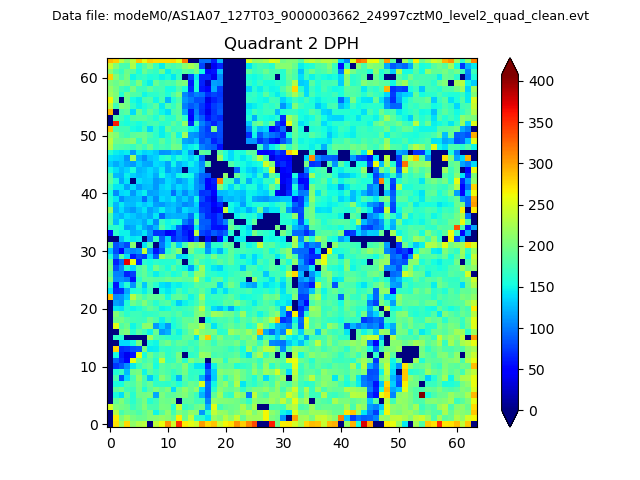
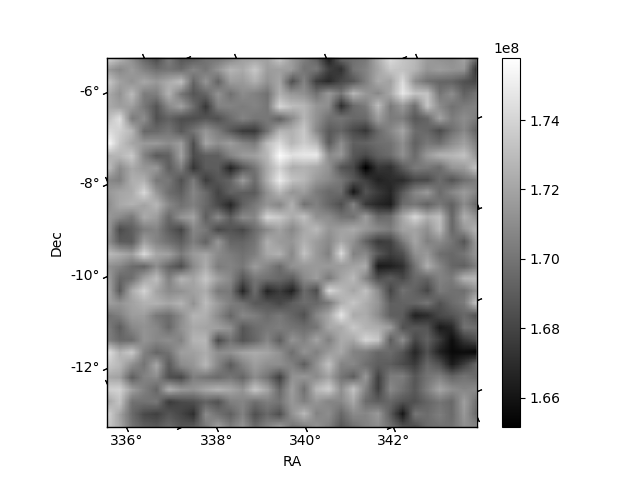
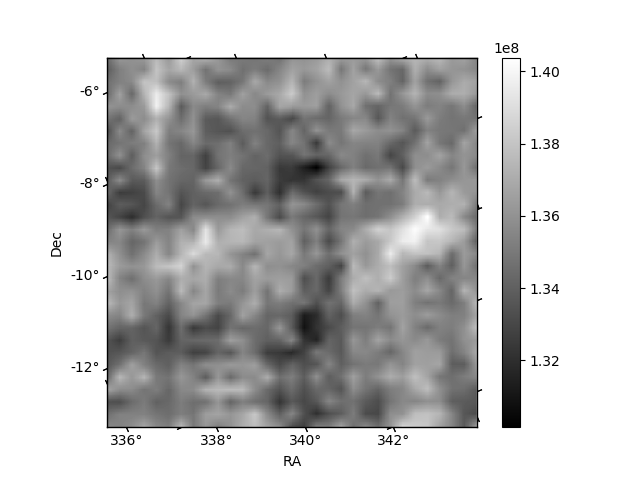
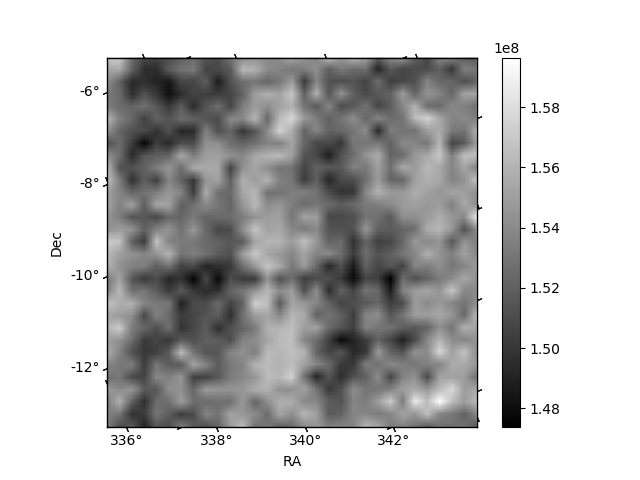
Histogram calculated using DETX and DETY for each event in the final _common_clean file
| Quadrant A | 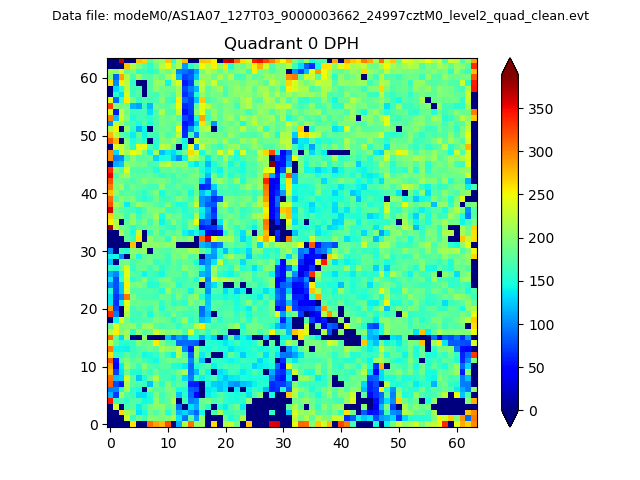 |
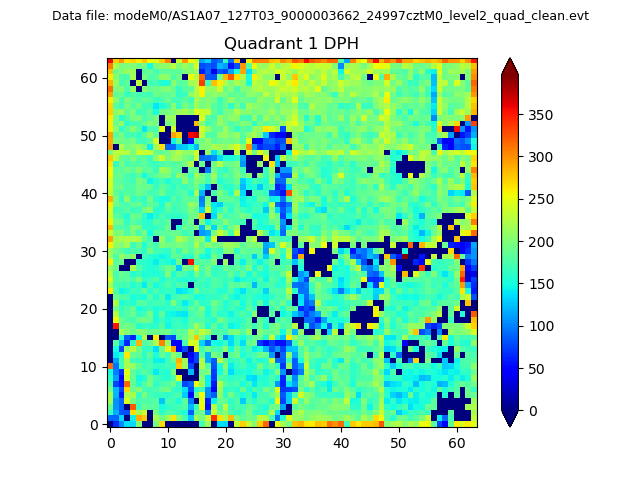 |
Quadrant B |
|---|---|---|---|
| Quadrant D | 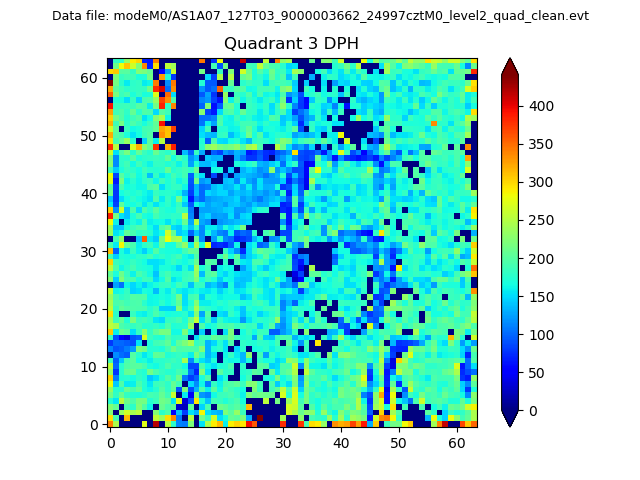 |
 |
Quadrant C |
| Plot type | Count rate plots | Images |
|---|---|---|
| Comparison with Poisson distribution Blue bars denote a histogram of data divided into 1 sec bins. Red curve is a Poisson curve with rate = median count rate of data. |
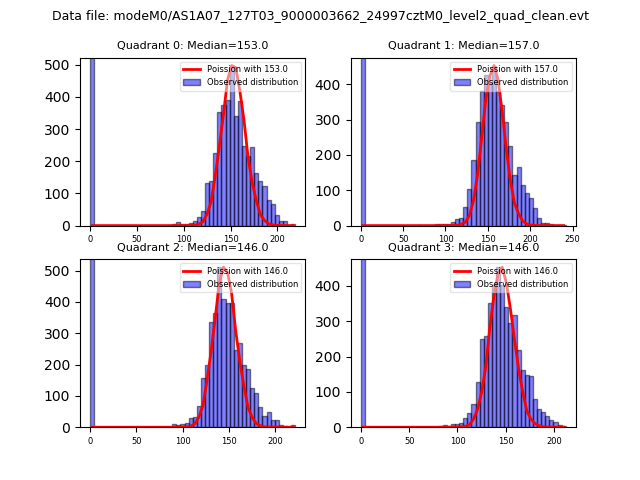 |
 |
| Quadrant-wise count rates Data is divided into 100 sec bins |
 |
|
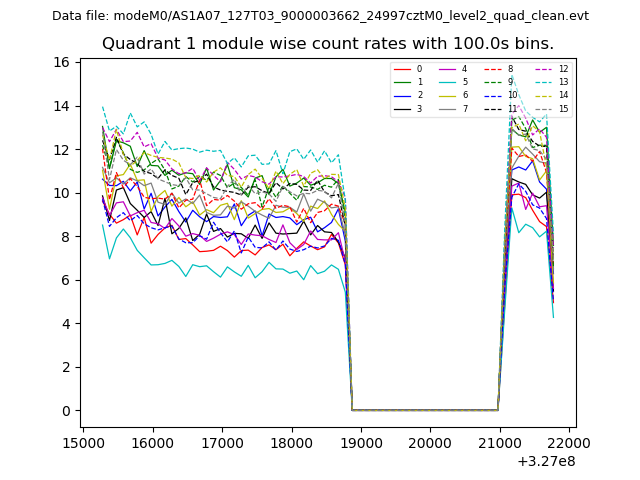
| Module-wise count rates for Quadrant A Data is divided into 100 sec bins |
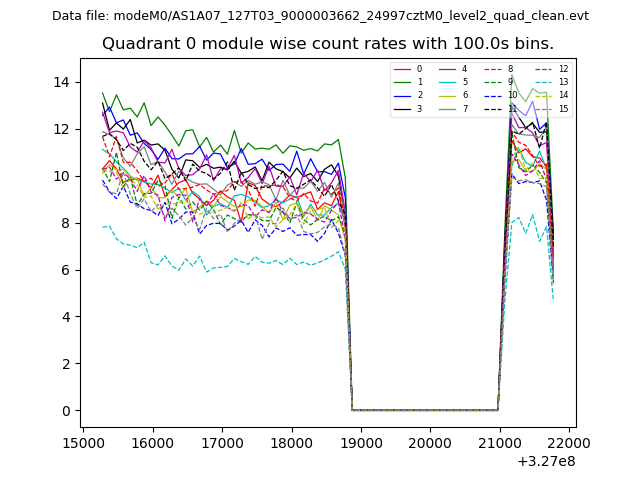 |
 |
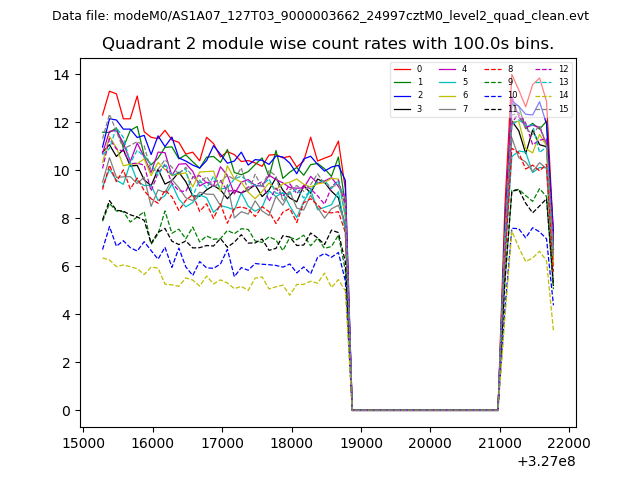
| Module-wise count rates for Quadrant B Data is divided into 100 sec bins |
 |
 |
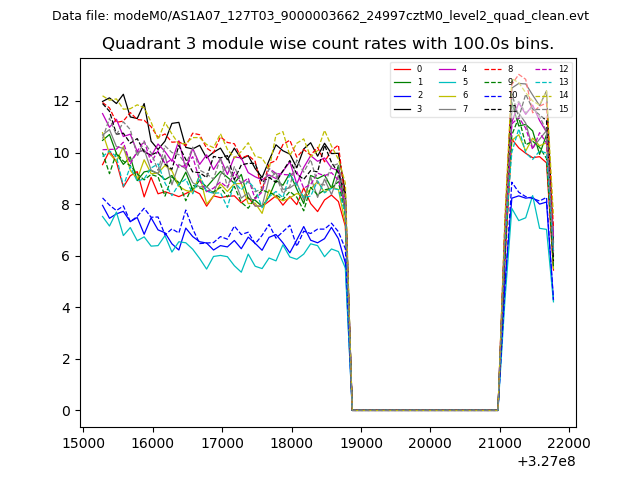
| Module-wise count rates for Quadrant C Data is divided into 100 sec bins |
 |
 |
| Module-wise count rates for Quadrant D Data is divided into 100 sec bins |
 |
 |
| Parameter | Plot |
|---|---|
| CZT HV Monitor | 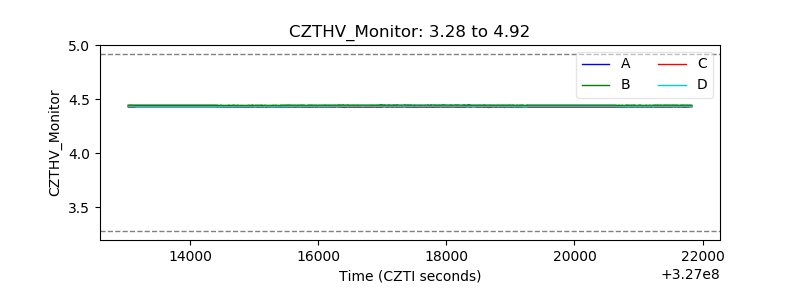 |
| D_VDD | 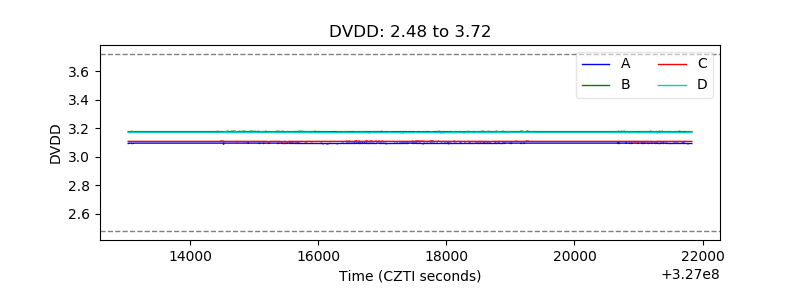 |
| Temperature 1 | 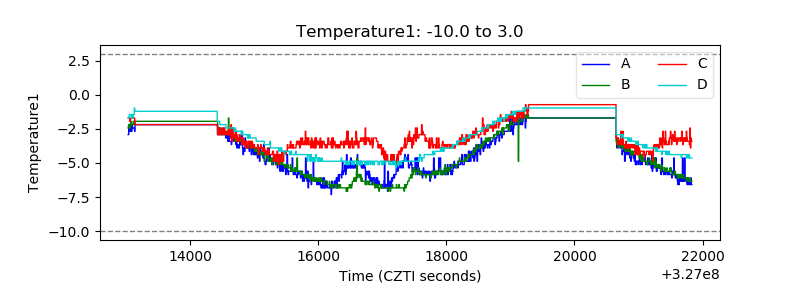 |
| Veto HV Monitor | 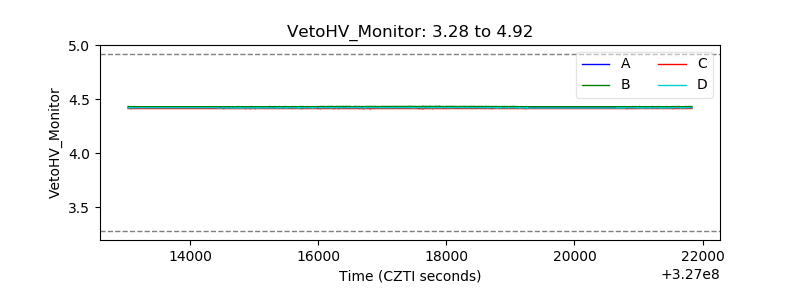 |
| Veto LLD |  |
| Alpha Counter |  |
| _CPM_Rate | 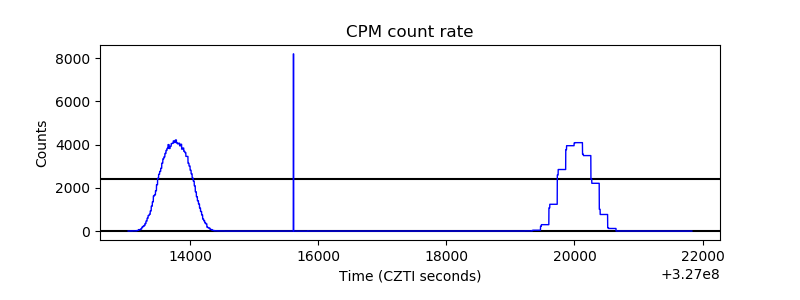 |
| CZT Counter |  |
| +2.5 Volts monitor |  |
| +5 Volts monitor |  |
| _ROLL_ROT | 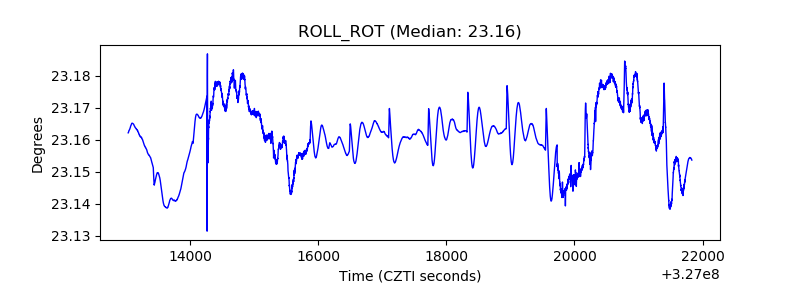 |
| _Roll_DEC | 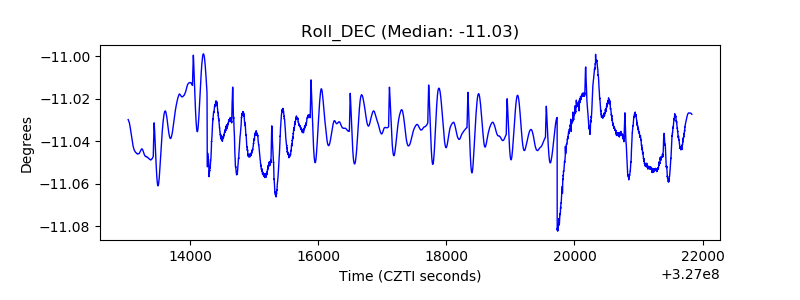 |
| _Roll_RA | 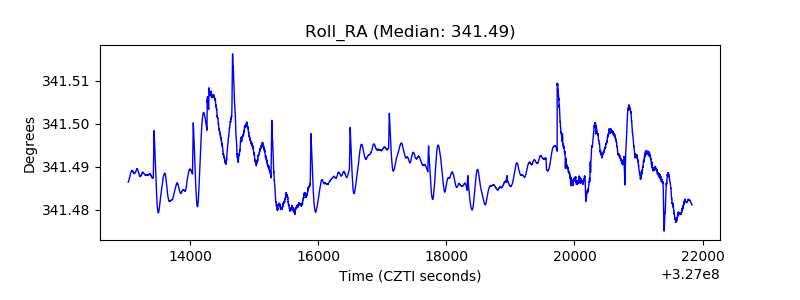 |
| Veto Counter | 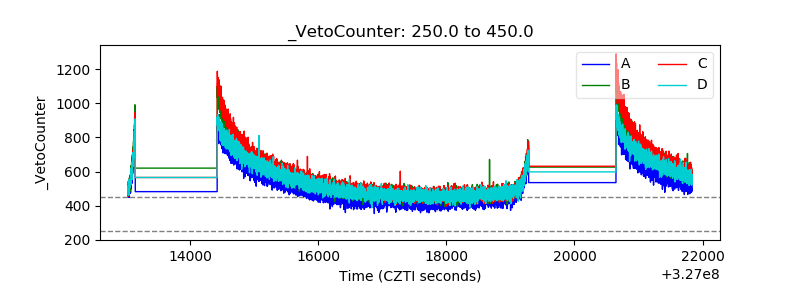 |