| Param | Original file | Final file |
|---|---|---|
| Filename | modeM0/AS1A07_127T03_9000003662_24999cztM0_level2.evt | modeM0/AS1A07_127T03_9000003662_24999cztM0_level2_quad_clean.evt |
| Size (bytes) | 505,071,360 | 111,916,800 |
| Size | 481.7 MB | 106.7 MB |
| Events in quadrant A | 3,144,636 | 742,513 |
| Events in quadrant B | 3,256,666 | 771,002 |
| Events in quadrant C | 5,226,029 | 724,582 |
| Events in quadrant D | 3,252,544 | 722,834 |
| Mode M0 | |||
|---|---|---|---|
| Quadrant | BADHDUFLAG | Total packets | Discarded packets |
| A | 0 | 13109 | 2 |
| B | 0 | 13476 | 2 |
| C | 0 | 19787 | 2 |
| D | 0 | 13516 | 2 |
| Mode SS | |||
|---|---|---|---|
| Quadrant | BADHDUFLAG | Total packets | Discarded packets |
| A | 0 | 126 | 0 |
| B | 0 | 126 | 0 |
| C | 0 | 126 | 0 |
| D | 0 | 126 | 0 |
| Mode M9 | |||
|---|---|---|---|
| Quadrant | BADHDUFLAG | Total packets | Discarded packets |
| A | 0 | 13 | 0 |
| B | 0 | 13 | 0 |
| C | 0 | 13 | 0 |
| D | 0 | 13 | 0 |
| Quadrant | Total seconds | Saturated seconds | Saturation percentage |
|---|---|---|---|
| A | 6136 | 31 | 0.505215% |
| B | 6137 | 65 | 1.059149% |
| C | 6137 | 389 | 6.338602% |
| D | 6137 | 29 | 0.472544% |
Noise dominated data is calculated using 1-second bins in cleaned event files. If a bin has >2000 counts, and if more than 50% of those come from <1% of pixels, then it is considered to be noise-dominated and hence unusable.
| Quadrant | # 1 sec bins | Bins with >0 counts | Bins with >2000 counts | High rate bins dominated by noise | Noise dominated (total time) | Noise dominated (detector-on time) | Marked lightcurve |
|---|---|---|---|---|---|---|---|
| A | 7476 | 6138 | 0 | 0 | 0.00% | 0.00% | 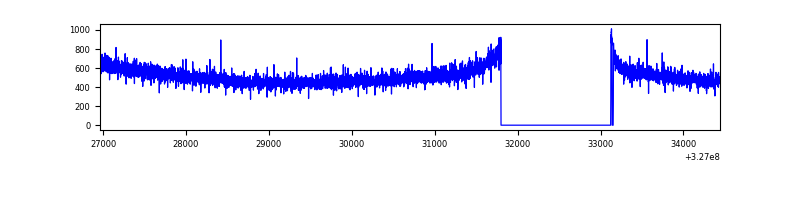 |
| B | 7477 | 6139 | 0 | 0 | 0.00% | 0.00% | 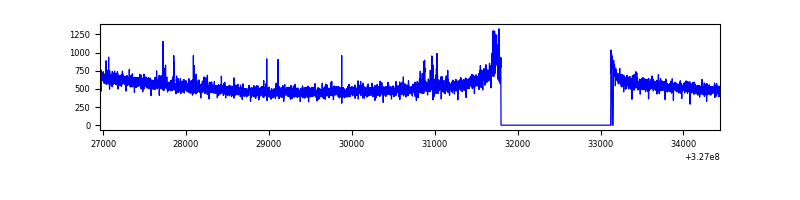 |
| C | 7477 | 6139 | 102 | 102 | 1.36% | 1.66% | 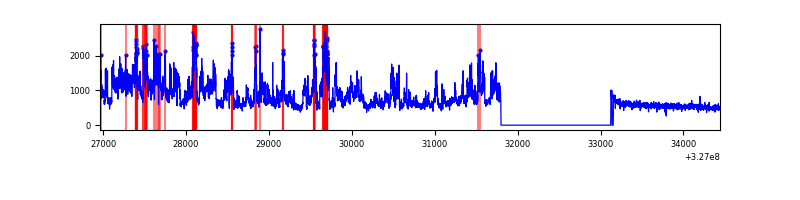 |
| D | 7477 | 6139 | 3 | 3 | 0.04% | 0.05% | 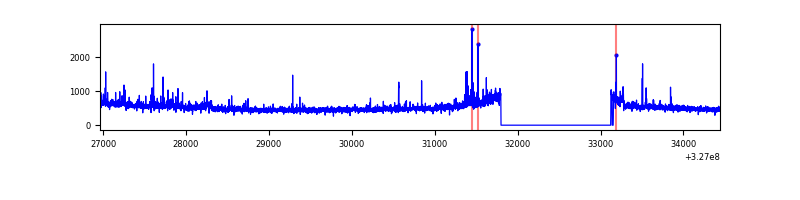 |
Top three noisy pixels from each quadrant. If the there are fewer than three noisy pixels in the level2.evt file, extra rows are filled as -1
| Pixel properties | Quadrant properties | ||||||
|---|---|---|---|---|---|---|---|
| Quadrant | DetID | PixID | Counts | Sigma | Mean | Median | Sigma |
| A | 13 | 254 | 9123 | 51.27 | 816 | 802 | 162.3 |
| A | 0 | 226 | 7026 | 38.35 | 816 | 802 | 162.3 |
| A | 3 | 137 | 6914 | 37.66 | 816 | 802 | 162.3 |
| B | 0 | 190 | 29445 | 186.32 | 822 | 804 | 153.7 |
| B | 12 | 111 | 17955 | 111.57 | 822 | 804 | 153.7 |
| B | 11 | 111 | 16030 | 99.05 | 822 | 804 | 153.7 |
| C | 7 | 247 | 1967303 | 10679.23 | 795 | 802 | 184.1 |
| C | 14 | 238 | 126077 | 680.32 | 795 | 802 | 184.1 |
| C | 2 | 16 | 28647 | 151.21 | 795 | 802 | 184.1 |
| D | 2 | 244 | 112004 | 573.91 | 809 | 789 | 193.8 |
| D | 8 | 195 | 69031 | 352.15 | 809 | 789 | 193.8 |
| D | 2 | 234 | 24386 | 121.77 | 809 | 789 | 193.8 |
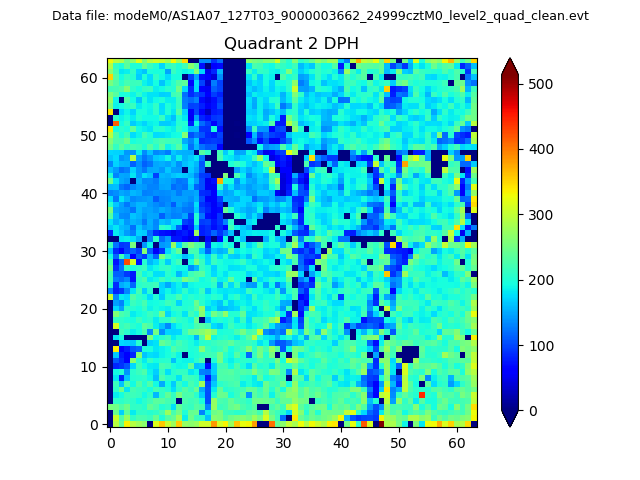
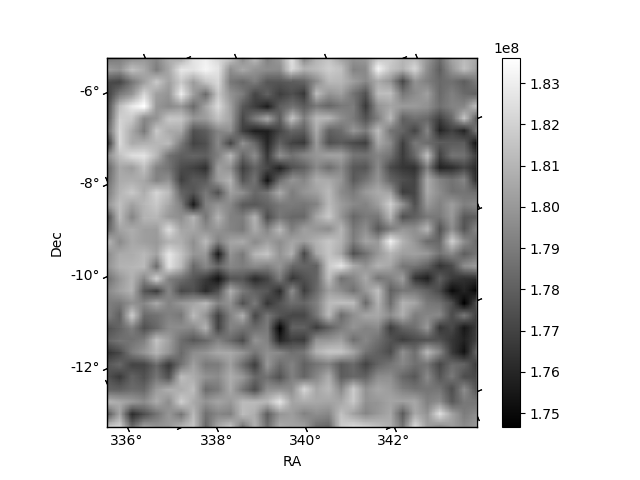
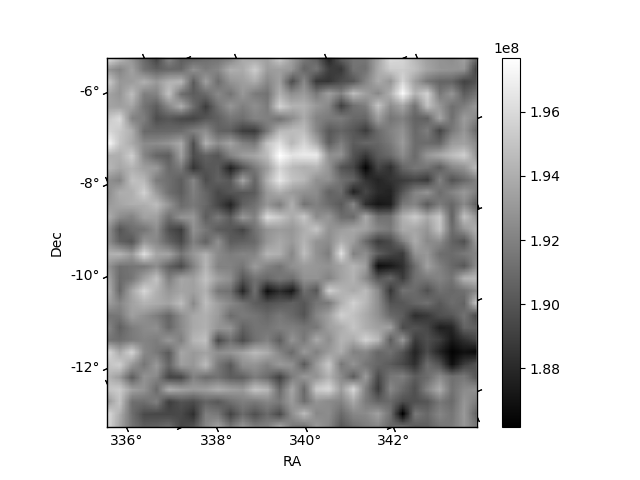
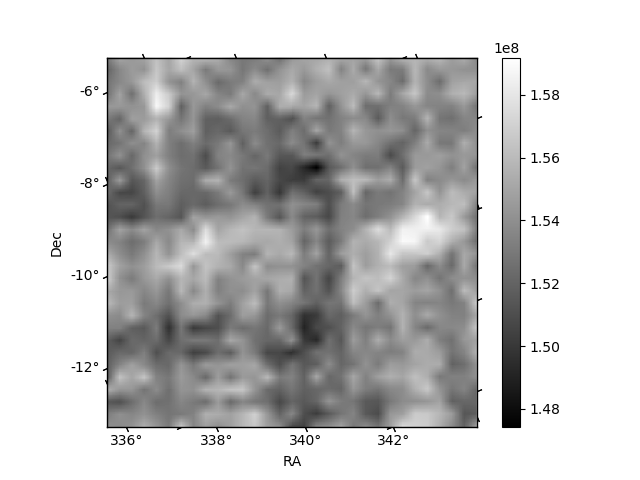
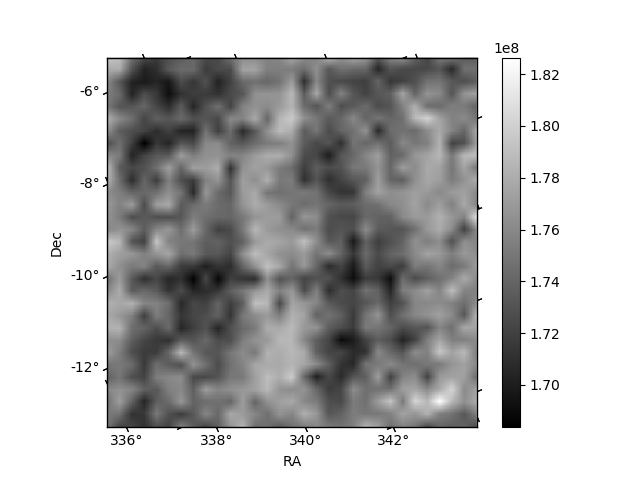
Histogram calculated using DETX and DETY for each event in the final _common_clean file
| Quadrant A | 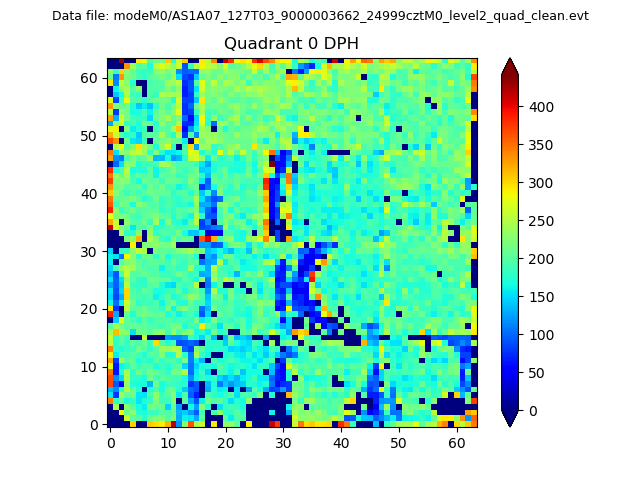 |
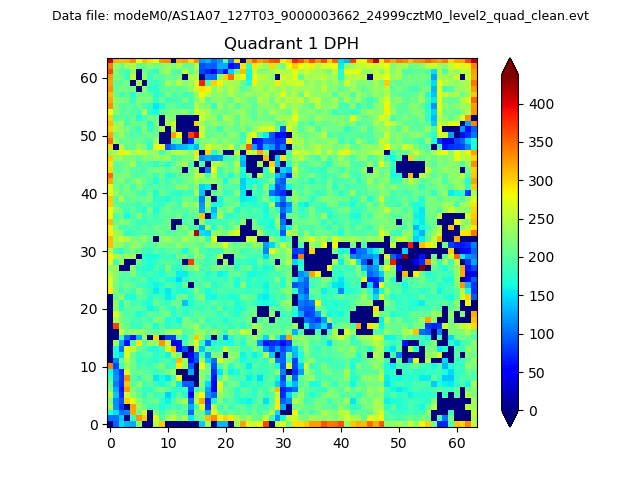 |
Quadrant B |
|---|---|---|---|
| Quadrant D | 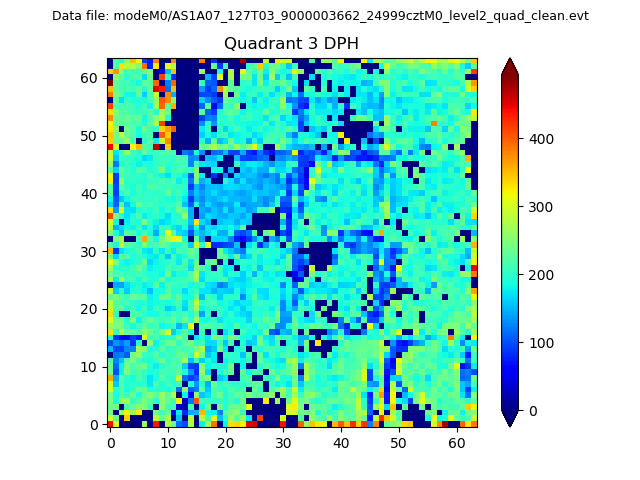 |
 |
Quadrant C |
| Plot type | Count rate plots | Images |
|---|---|---|
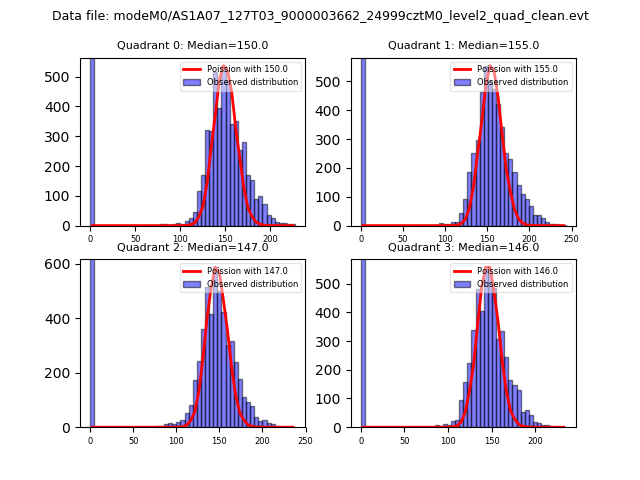
| Comparison with Poisson distribution Blue bars denote a histogram of data divided into 1 sec bins. Red curve is a Poisson curve with rate = median count rate of data. |
 |
 |
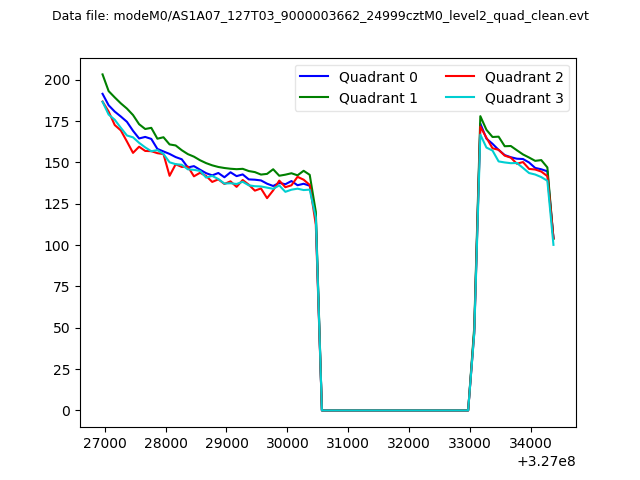
| Quadrant-wise count rates Data is divided into 100 sec bins |
 |
|
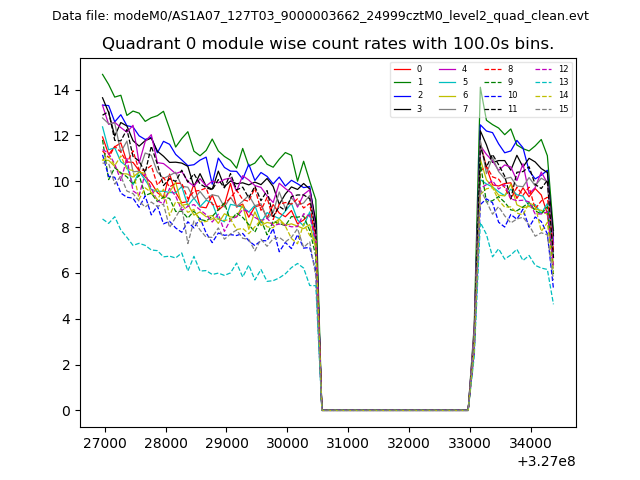
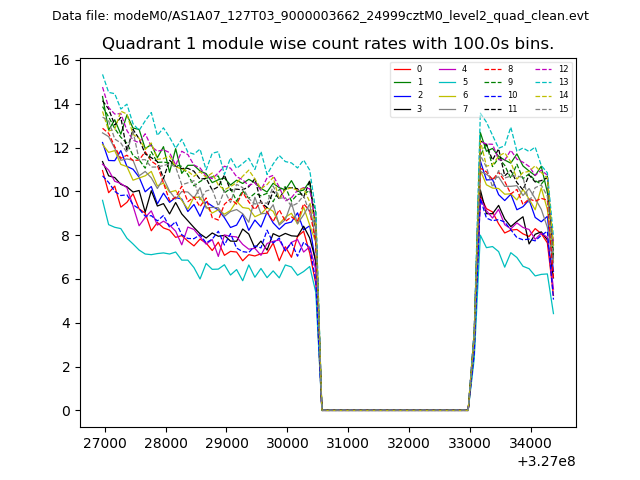
| Module-wise count rates for Quadrant A Data is divided into 100 sec bins |
 |
 |
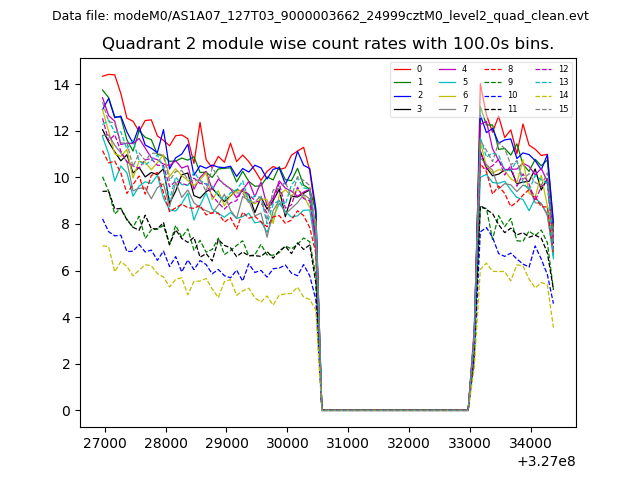
| Module-wise count rates for Quadrant B Data is divided into 100 sec bins |
 |
 |
| Module-wise count rates for Quadrant C Data is divided into 100 sec bins |
 |
 |
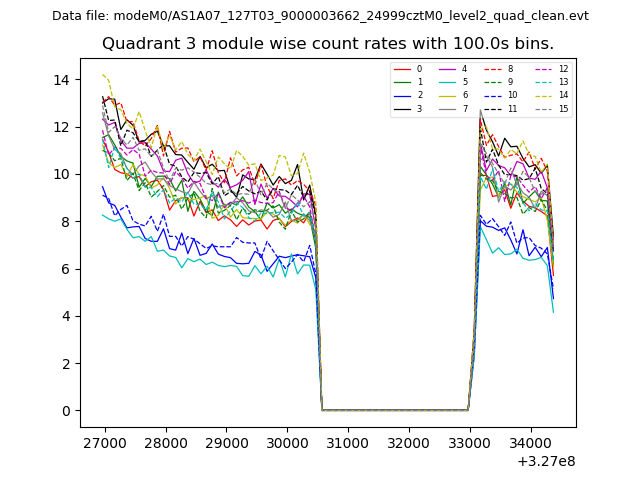
| Module-wise count rates for Quadrant D Data is divided into 100 sec bins |
 |
 |
| Parameter | Plot |
|---|---|
| CZT HV Monitor | 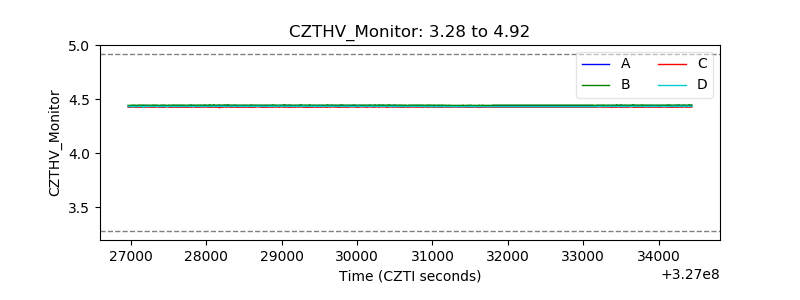 |
| D_VDD | 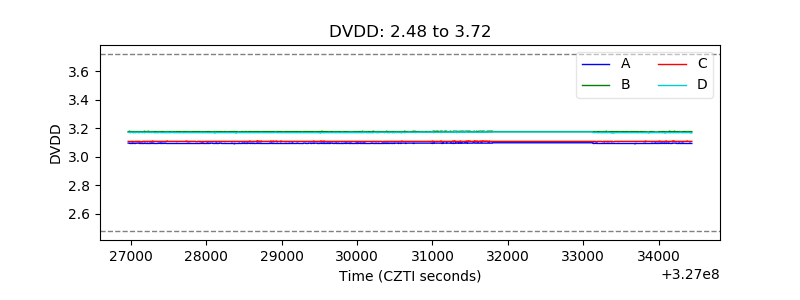 |
| Temperature 1 | 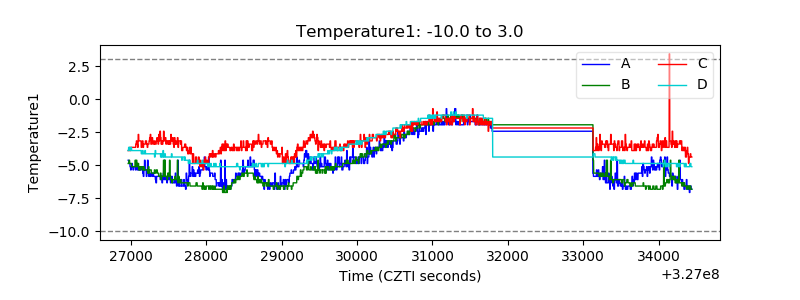 |
| Veto HV Monitor | 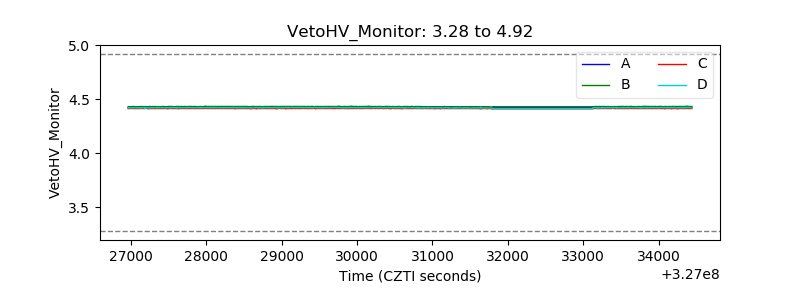 |
| Veto LLD | 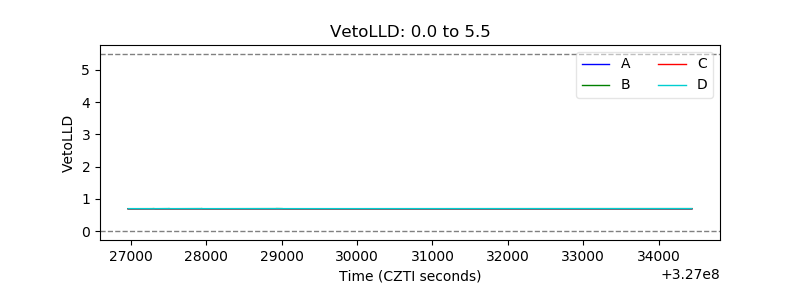 |
| Alpha Counter | 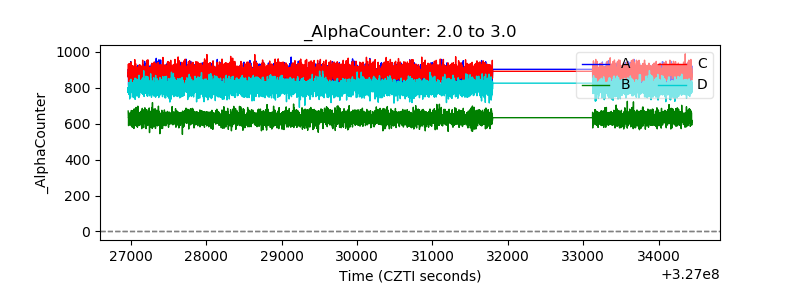 |
| _CPM_Rate | 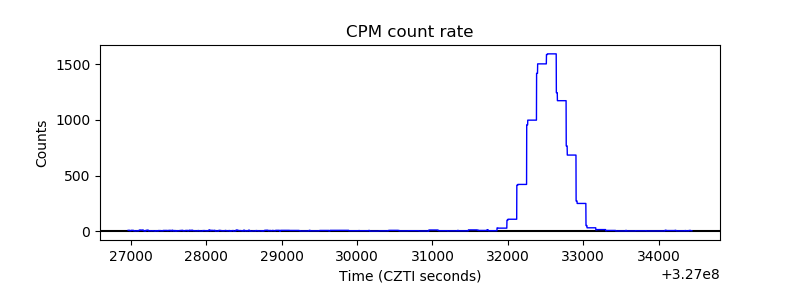 |
| CZT Counter | 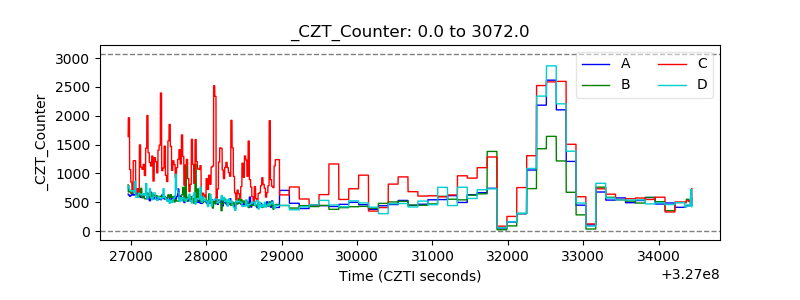 |
| +2.5 Volts monitor | 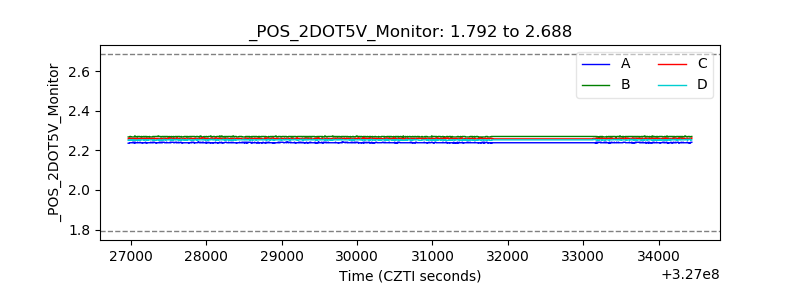 |
| +5 Volts monitor | 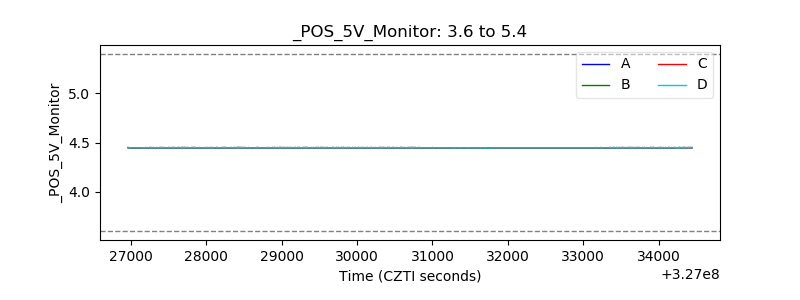 |
| _ROLL_ROT | 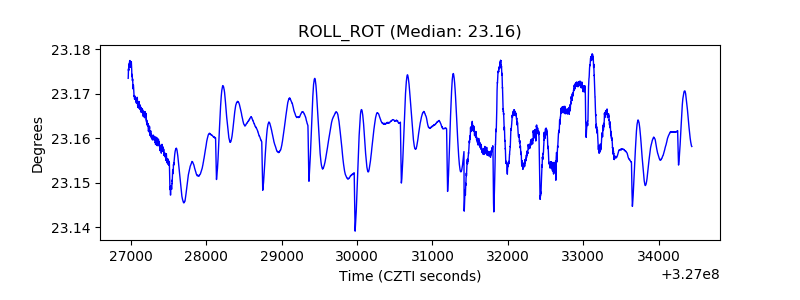 |
| _Roll_DEC | 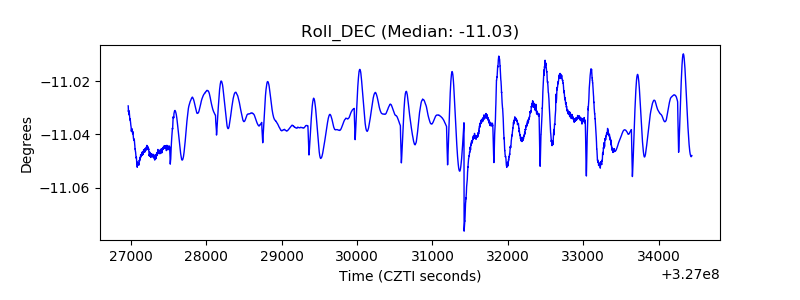 |
| _Roll_RA | 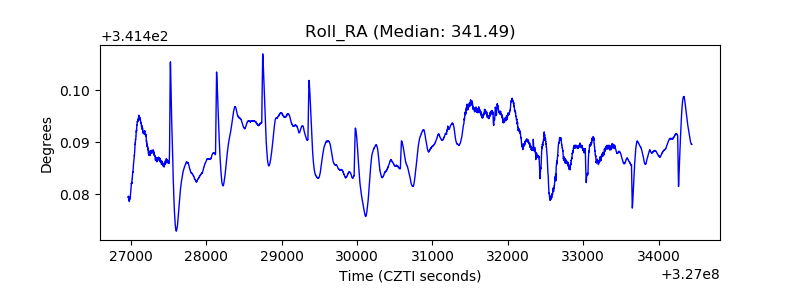 |
| Veto Counter | 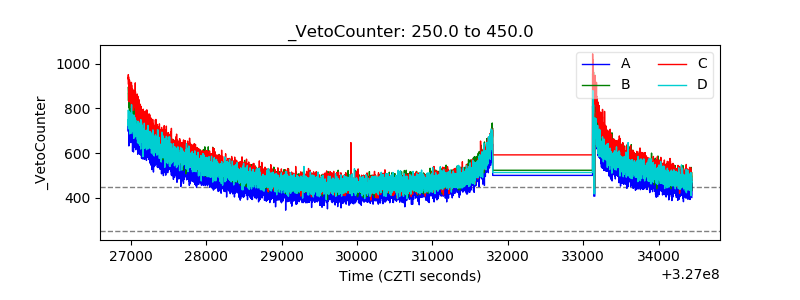 |