| Param | Original file | Final file |
|---|---|---|
| Filename | modeM0/AS1A07_127T03_9000003662_25000cztM0_level2.evt | modeM0/AS1A07_127T03_9000003662_25000cztM0_level2_quad_clean.evt |
| Size (bytes) | 455,379,840 | 101,234,880 |
| Size | 434.3 MB | 96.5 MB |
| Events in quadrant A | 3,262,670 | 652,944 |
| Events in quadrant B | 3,380,236 | 672,844 |
| Events in quadrant C | 3,427,139 | 647,913 |
| Events in quadrant D | 3,276,025 | 635,348 |
| Mode M0 | |||
|---|---|---|---|
| Quadrant | BADHDUFLAG | Total packets | Discarded packets |
| A | 0 | 13788 | 2 |
| B | 0 | 14081 | 2 |
| C | 0 | 14089 | 2 |
| D | 0 | 13861 | 2 |
| Mode SS | |||
|---|---|---|---|
| Quadrant | BADHDUFLAG | Total packets | Discarded packets |
| A | 0 | 134 | 0 |
| B | 0 | 134 | 0 |
| C | 0 | 134 | 0 |
| D | 0 | 134 | 0 |
| Mode M9 | |||
|---|---|---|---|
| Quadrant | BADHDUFLAG | Total packets | Discarded packets |
| A | 0 | 15 | 0 |
| B | 0 | 16 | 0 |
| C | 0 | 16 | 0 |
| D | 0 | 16 | 0 |
| Quadrant | Total seconds | Saturated seconds | Saturation percentage |
|---|---|---|---|
| A | 6547 | 57 | 0.870628% |
| B | 6547 | 95 | 1.451046% |
| C | 6547 | 135 | 2.062013% |
| D | 6547 | 38 | 0.580419% |
Noise dominated data is calculated using 1-second bins in cleaned event files. If a bin has >2000 counts, and if more than 50% of those come from <1% of pixels, then it is considered to be noise-dominated and hence unusable.
| Quadrant | # 1 sec bins | Bins with >0 counts | Bins with >2000 counts | High rate bins dominated by noise | Noise dominated (total time) | Noise dominated (detector-on time) | Marked lightcurve |
|---|---|---|---|---|---|---|---|
| A | 7577 | 6549 | 0 | 0 | 0.00% | 0.00% | 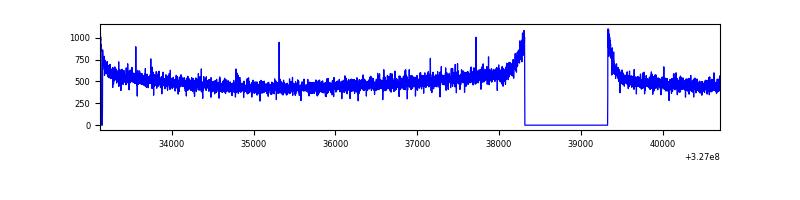 |
| B | 7577 | 6549 | 3 | 3 | 0.04% | 0.05% | 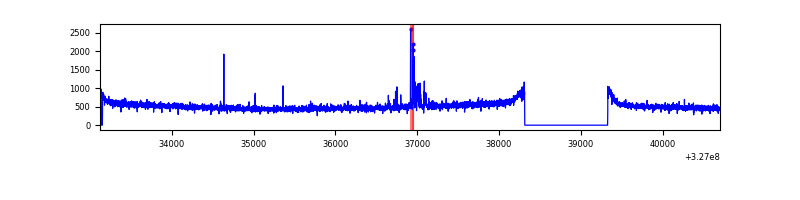 |
| C | 7577 | 6549 | 2 | 2 | 0.03% | 0.03% | 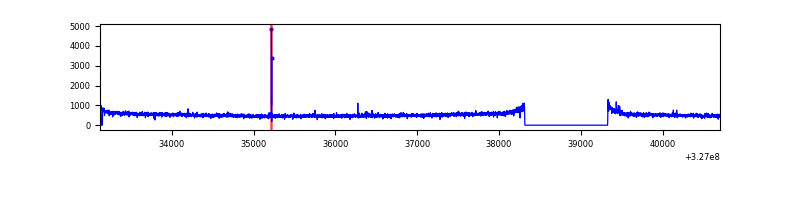 |
| D | 7577 | 6549 | 1 | 1 | 0.01% | 0.02% | 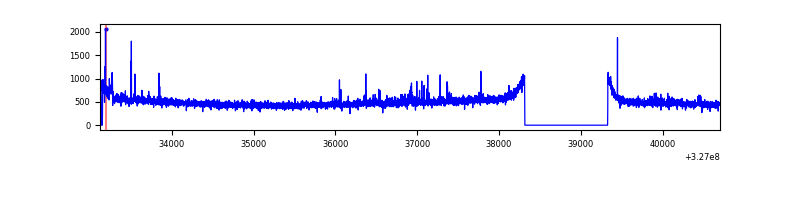 |
Top three noisy pixels from each quadrant. If the there are fewer than three noisy pixels in the level2.evt file, extra rows are filled as -1
| Pixel properties | Quadrant properties | ||||||
|---|---|---|---|---|---|---|---|
| Quadrant | DetID | PixID | Counts | Sigma | Mean | Median | Sigma |
| A | 13 | 254 | 9962 | 53.92 | 846 | 829 | 169.4 |
| A | 3 | 137 | 7479 | 39.26 | 846 | 829 | 169.4 |
| A | 0 | 226 | 7130 | 37.2 | 846 | 829 | 169.4 |
| B | 0 | 190 | 24775 | 148.96 | 851 | 832 | 160.7 |
| B | 15 | 32 | 21942 | 131.33 | 851 | 832 | 160.7 |
| B | 12 | 111 | 19606 | 116.8 | 851 | 832 | 160.7 |
| C | 14 | 238 | 130599 | 665.07 | 829 | 835 | 195.1 |
| C | 7 | 247 | 48057 | 242.02 | 829 | 835 | 195.1 |
| C | 2 | 16 | 16988 | 82.79 | 829 | 835 | 195.1 |
| D | 8 | 195 | 55083 | 265.78 | 839 | 816 | 204.2 |
| D | 2 | 244 | 29542 | 140.69 | 839 | 816 | 204.2 |
| D | 2 | 234 | 24770 | 117.32 | 839 | 816 | 204.2 |
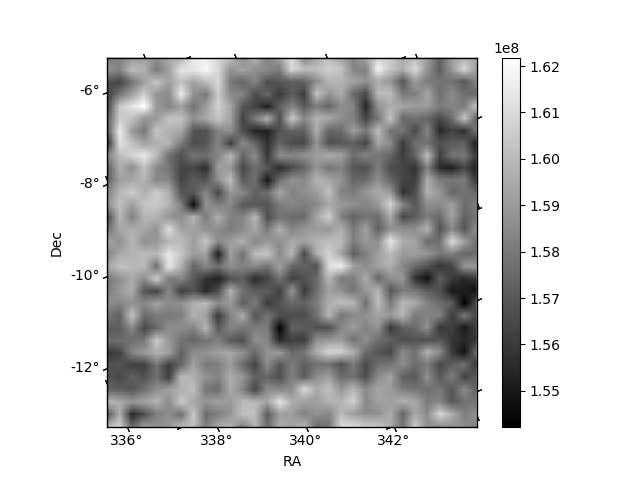
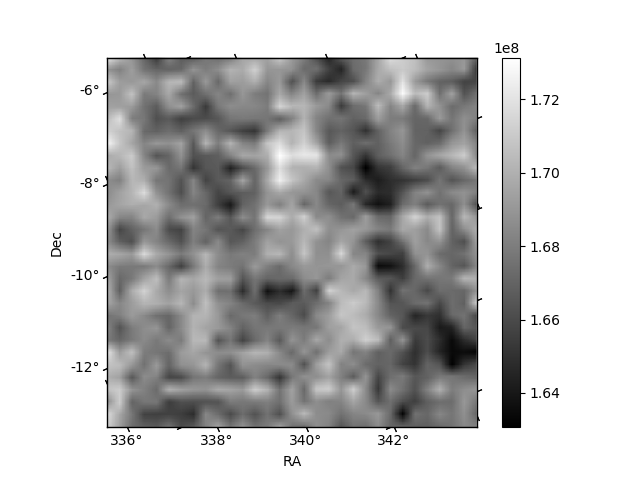
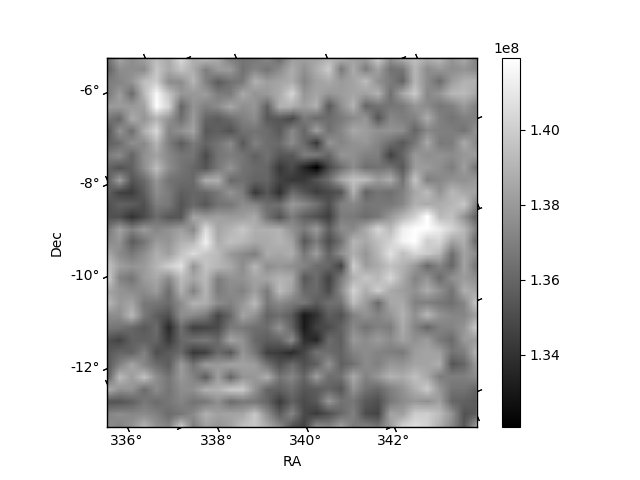
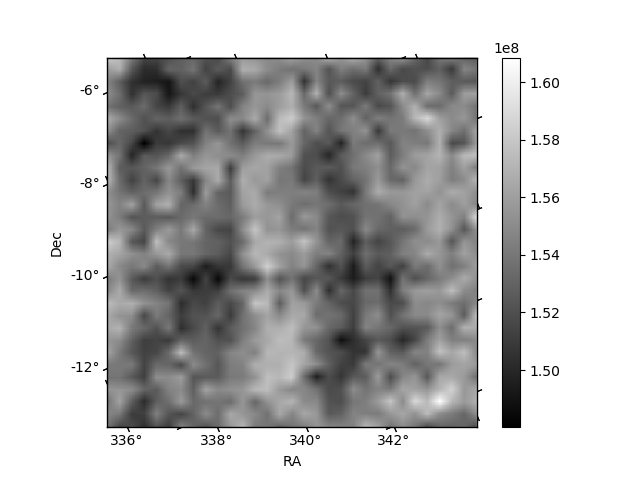
Histogram calculated using DETX and DETY for each event in the final _common_clean file
| Quadrant A | 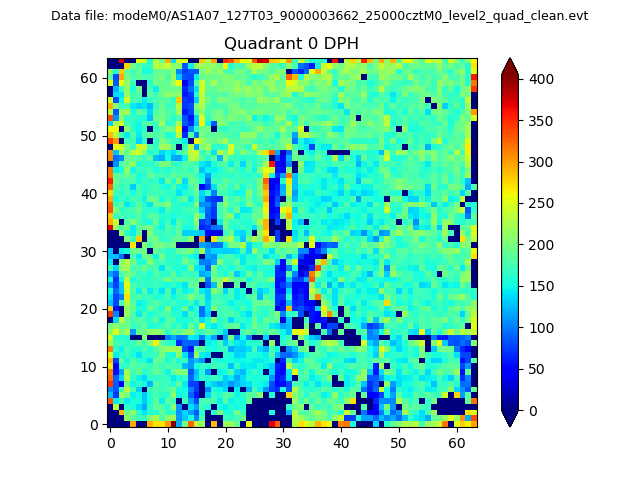 |
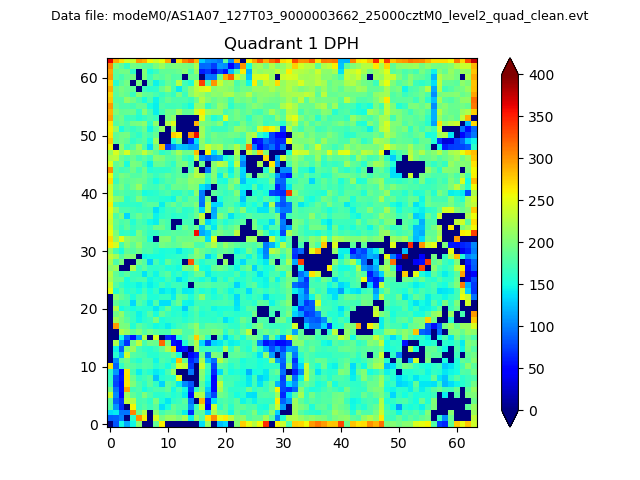 |
Quadrant B |
|---|---|---|---|
| Quadrant D | 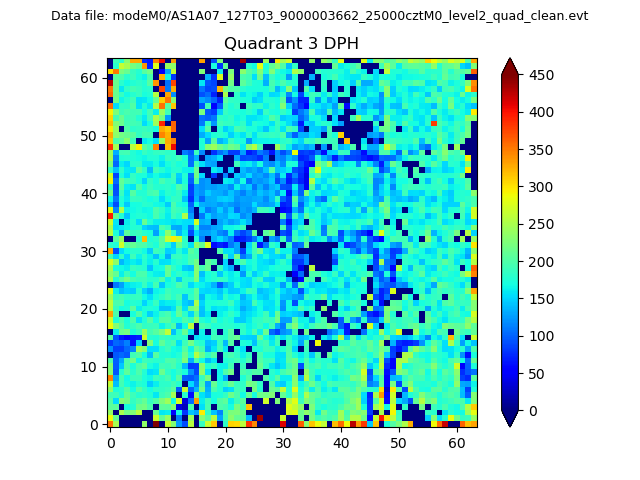 |
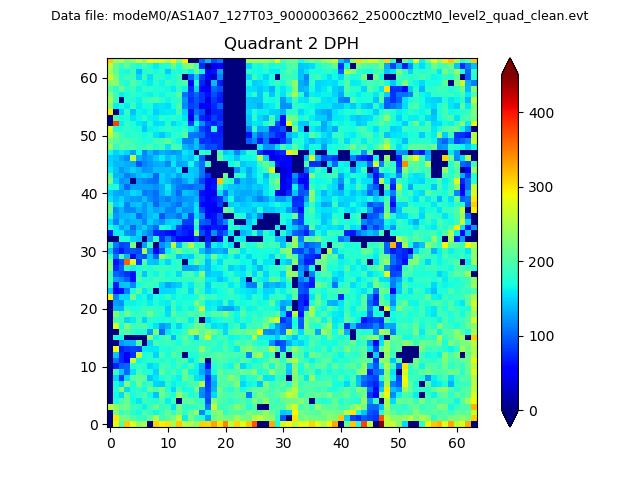 |
Quadrant C |
| Plot type | Count rate plots | Images |
|---|---|---|
| Comparison with Poisson distribution Blue bars denote a histogram of data divided into 1 sec bins. Red curve is a Poisson curve with rate = median count rate of data. |
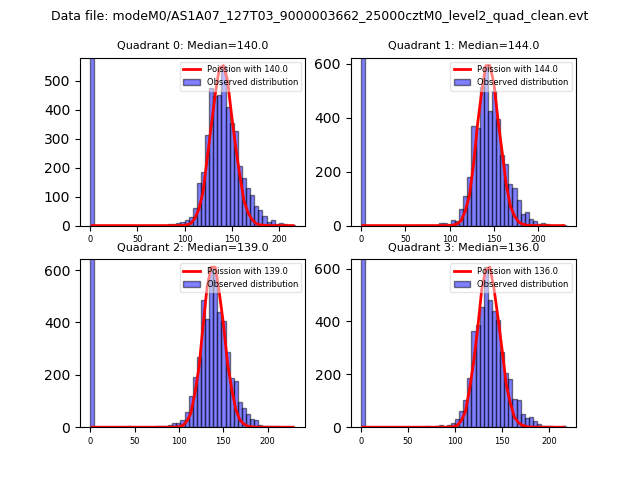 |
 |
| Quadrant-wise count rates Data is divided into 100 sec bins |
 |
|
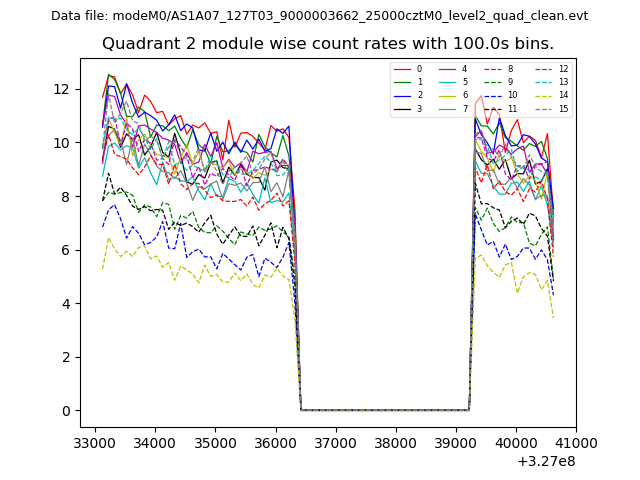
| Module-wise count rates for Quadrant A Data is divided into 100 sec bins |
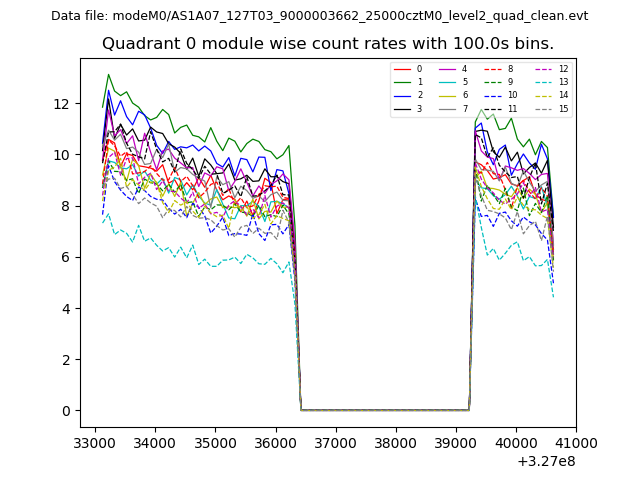 |
 |
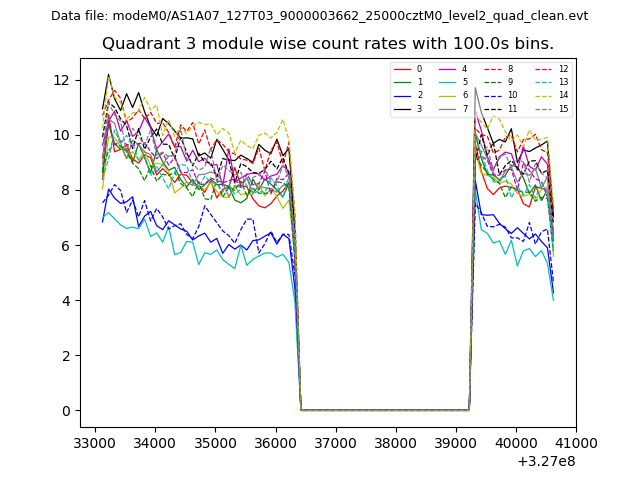
| Module-wise count rates for Quadrant B Data is divided into 100 sec bins |
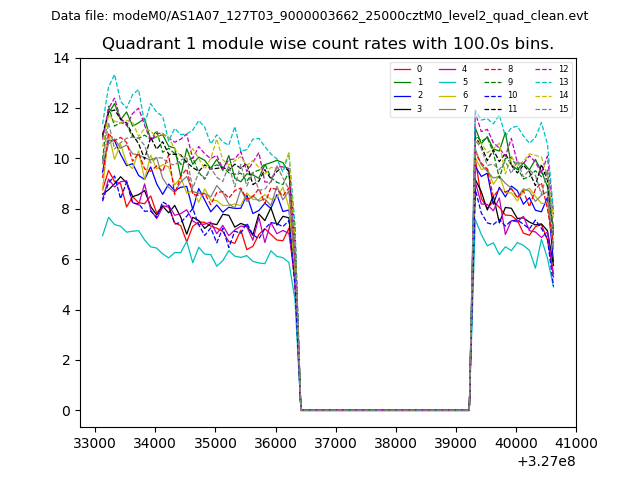 |
 |
| Module-wise count rates for Quadrant C Data is divided into 100 sec bins |
 |
 |
| Module-wise count rates for Quadrant D Data is divided into 100 sec bins |
 |
 |
| Parameter | Plot |
|---|---|
| CZT HV Monitor | 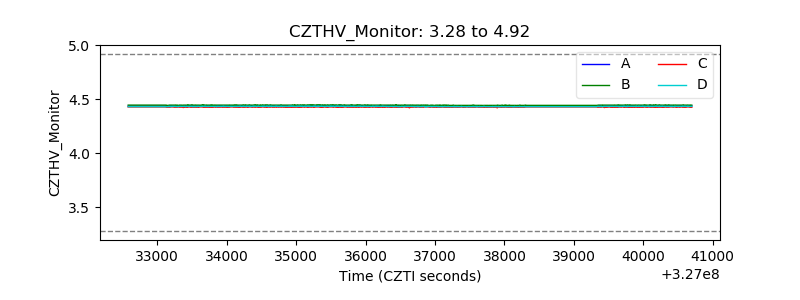 |
| D_VDD | 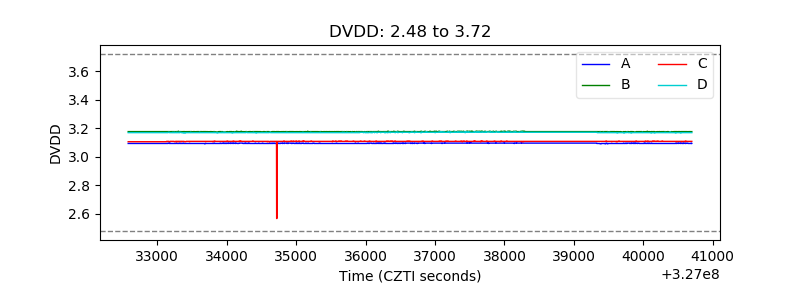 |
| Temperature 1 | 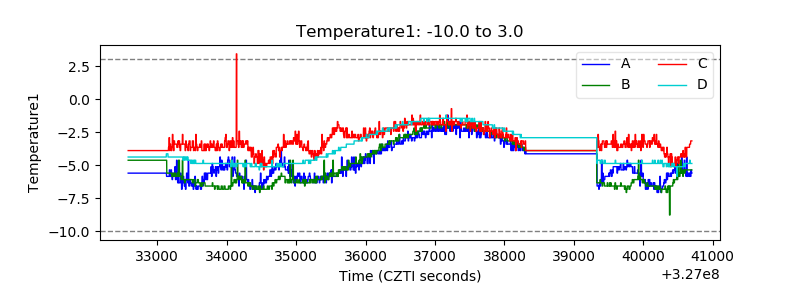 |
| Veto HV Monitor | 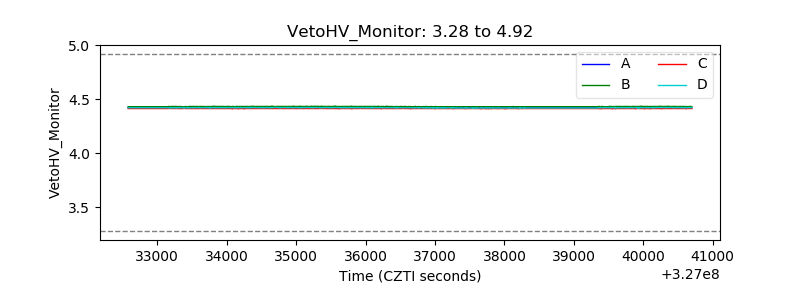 |
| Veto LLD | 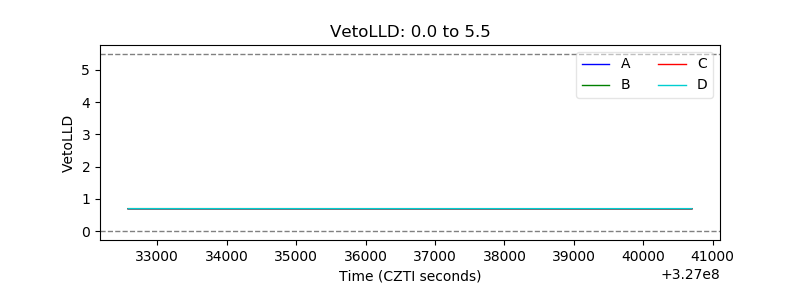 |
| Alpha Counter | 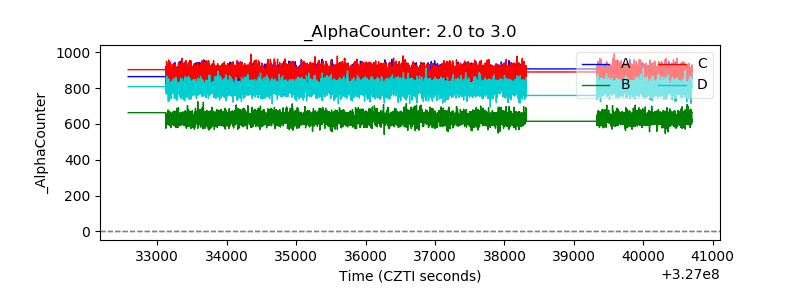 |
| _CPM_Rate | 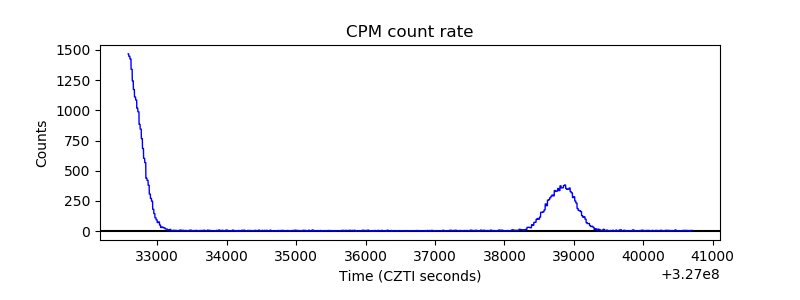 |
| CZT Counter |  |
| +2.5 Volts monitor |  |
| +5 Volts monitor |  |
| _ROLL_ROT | 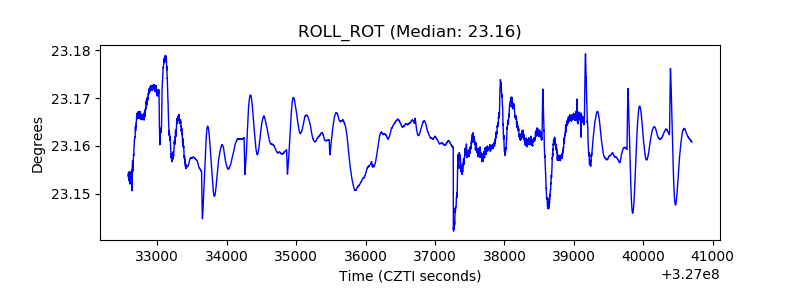 |
| _Roll_DEC | 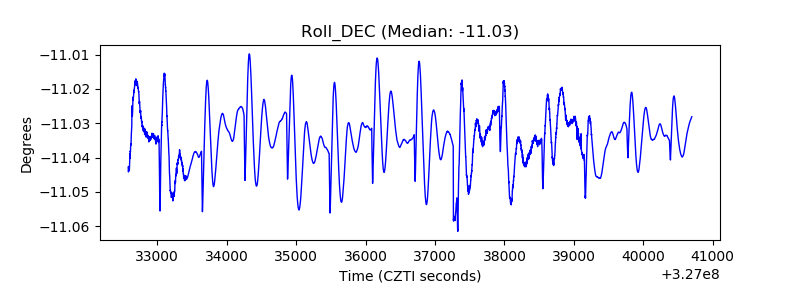 |
| _Roll_RA |  |
| Veto Counter | 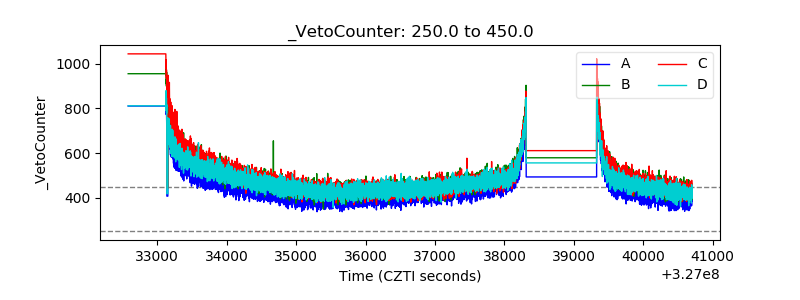 |