| Param | Original file | Final file |
|---|---|---|
| Filename | modeM0/AS1A07_127T03_9000003662_25001cztM0_level2.evt | modeM0/AS1A07_127T03_9000003662_25001cztM0_level2_quad_clean.evt |
| Size (bytes) | 434,312,640 | 87,347,520 |
| Size | 414.2 MB | 83.3 MB |
| Events in quadrant A | 3,102,415 | 551,500 |
| Events in quadrant B | 3,176,982 | 565,504 |
| Events in quadrant C | 3,171,279 | 543,196 |
| Events in quadrant D | 3,262,859 | 533,765 |
| Mode M0 | |||
|---|---|---|---|
| Quadrant | BADHDUFLAG | Total packets | Discarded packets |
| A | 0 | 13374 | 1 |
| B | 0 | 13516 | 1 |
| C | 0 | 13380 | 1 |
| D | 0 | 13886 | 1 |
| Mode SS | |||
|---|---|---|---|
| Quadrant | BADHDUFLAG | Total packets | Discarded packets |
| A | 0 | 132 | 0 |
| B | 0 | 132 | 0 |
| C | 0 | 132 | 0 |
| D | 0 | 132 | 0 |
| Mode M9 | |||
|---|---|---|---|
| Quadrant | BADHDUFLAG | Total packets | Discarded packets |
| A | 0 | 6 | 0 |
| B | 0 | 6 | 0 |
| C | 0 | 6 | 0 |
| D | 0 | 6 | 0 |
| Quadrant | Total seconds | Saturated seconds | Saturation percentage |
|---|---|---|---|
| A | 6463 | 57 | 0.881943% |
| B | 6464 | 80 | 1.237624% |
| C | 6464 | 96 | 1.485149% |
| D | 6464 | 35 | 0.541460% |
Noise dominated data is calculated using 1-second bins in cleaned event files. If a bin has >2000 counts, and if more than 50% of those come from <1% of pixels, then it is considered to be noise-dominated and hence unusable.
| Quadrant | # 1 sec bins | Bins with >0 counts | Bins with >2000 counts | High rate bins dominated by noise | Noise dominated (total time) | Noise dominated (detector-on time) | Marked lightcurve |
|---|---|---|---|---|---|---|---|
| A | 7074 | 6464 | 0 | 0 | 0.00% | 0.00% | 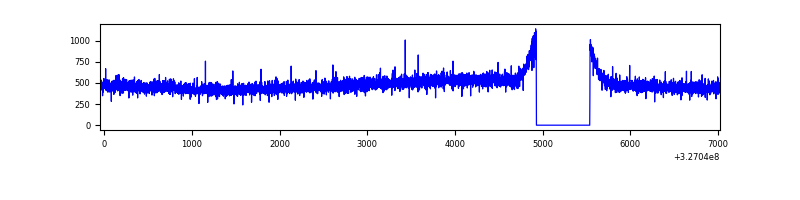 |
| B | 7075 | 6465 | 1 | 1 | 0.01% | 0.02% | 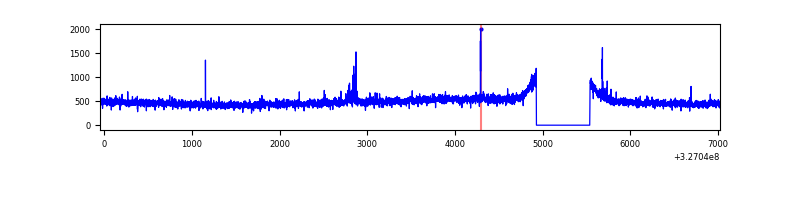 |
| C | 7075 | 6465 | 0 | 0 | 0.00% | 0.00% | 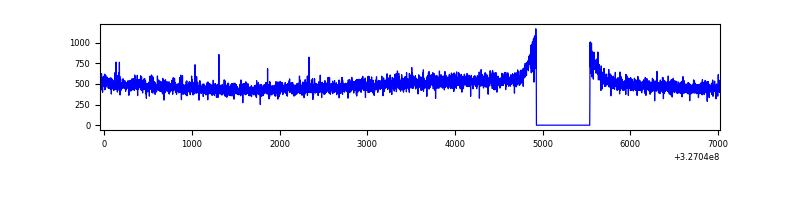 |
| D | 7075 | 6465 | 2 | 2 | 0.03% | 0.03% | 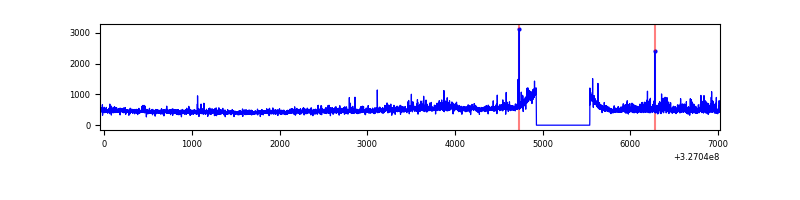 |
Top three noisy pixels from each quadrant. If the there are fewer than three noisy pixels in the level2.evt file, extra rows are filled as -1
| Pixel properties | Quadrant properties | ||||||
|---|---|---|---|---|---|---|---|
| Quadrant | DetID | PixID | Counts | Sigma | Mean | Median | Sigma |
| A | 13 | 254 | 9539 | 53.62 | 804 | 787 | 163.2 |
| A | 3 | 137 | 7394 | 40.48 | 804 | 787 | 163.2 |
| A | 0 | 226 | 7035 | 38.28 | 804 | 787 | 163.2 |
| B | 12 | 111 | 18859 | 117.74 | 801 | 781 | 153.5 |
| B | 11 | 111 | 17181 | 106.81 | 801 | 781 | 153.5 |
| B | 14 | 111 | 15170 | 93.72 | 801 | 781 | 153.5 |
| C | 14 | 238 | 120821 | 655.39 | 777 | 783 | 183.2 |
| C | 7 | 247 | 19167 | 100.37 | 777 | 783 | 183.2 |
| C | 13 | 61 | 5153 | 23.86 | 777 | 783 | 183.2 |
| D | 8 | 195 | 230753 | 1210.97 | 788 | 765 | 189.9 |
| D | 2 | 234 | 26582 | 135.93 | 788 | 765 | 189.9 |
| D | 7 | 238 | 15313 | 76.6 | 788 | 765 | 189.9 |
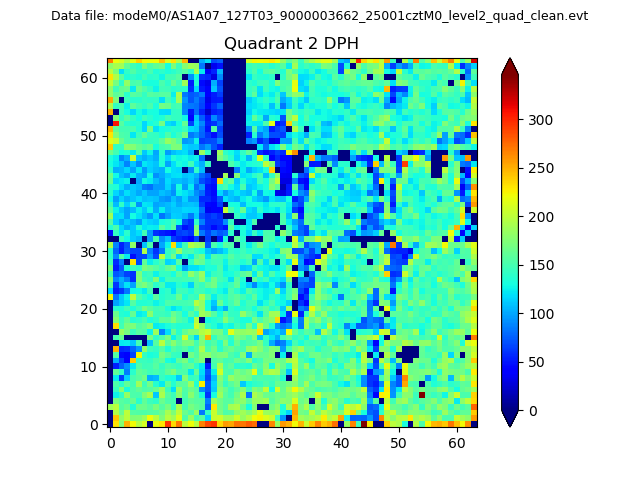
Histogram calculated using DETX and DETY for each event in the final _common_clean file
| Quadrant A | 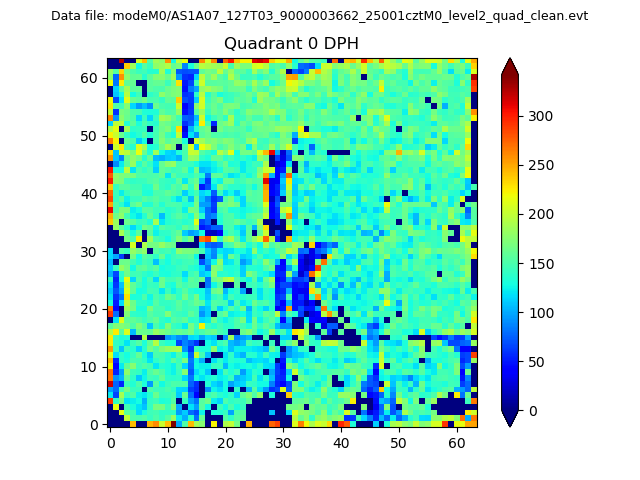 |
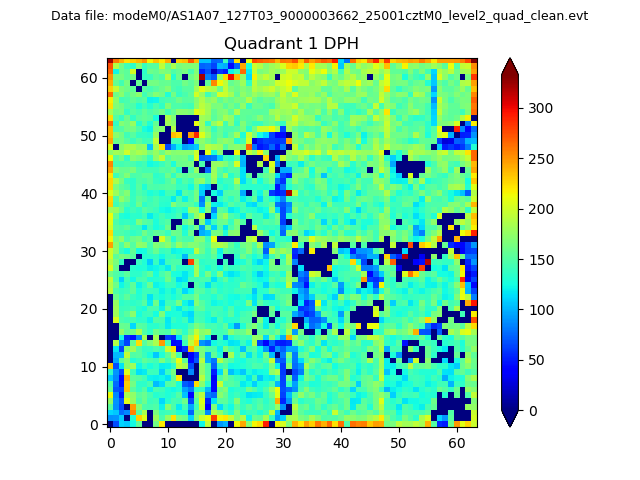 |
Quadrant B |
|---|---|---|---|
| Quadrant D | 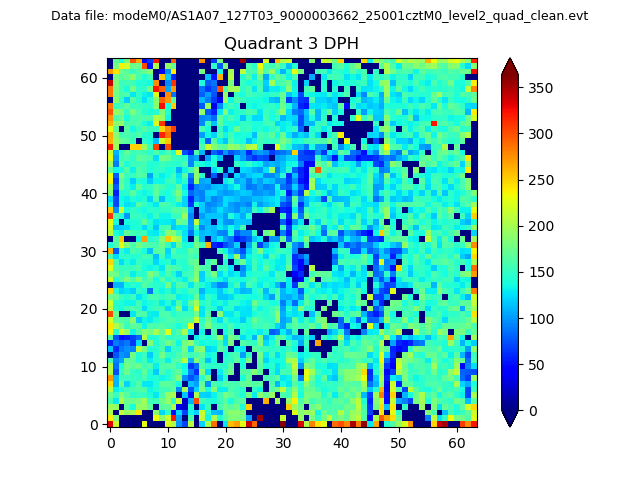 |
 |
Quadrant C |
| Plot type | Count rate plots | Images |
|---|---|---|
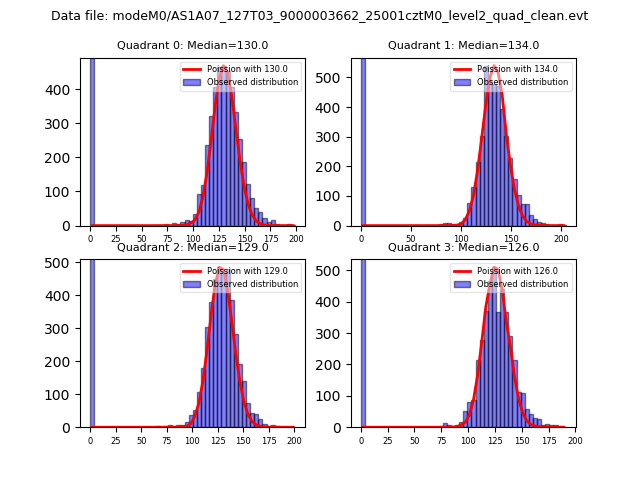
| Comparison with Poisson distribution Blue bars denote a histogram of data divided into 1 sec bins. Red curve is a Poisson curve with rate = median count rate of data. |
 |
 |
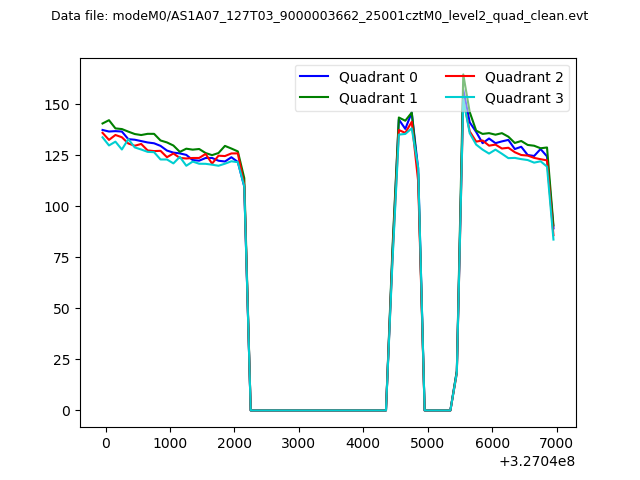
| Quadrant-wise count rates Data is divided into 100 sec bins |
 |
|
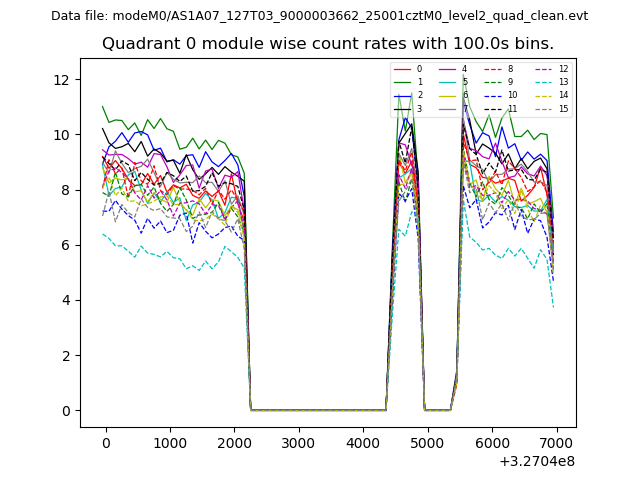
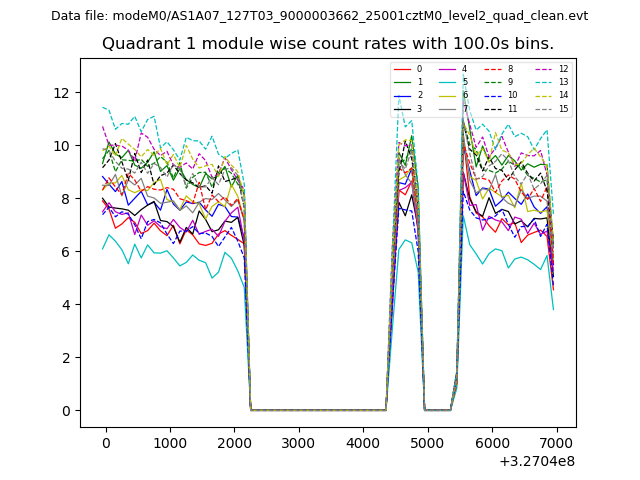
| Module-wise count rates for Quadrant A Data is divided into 100 sec bins |
 |
 |
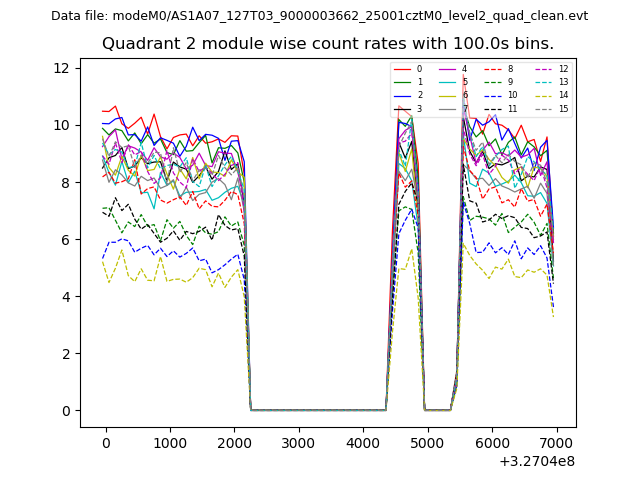
| Module-wise count rates for Quadrant B Data is divided into 100 sec bins |
 |
 |
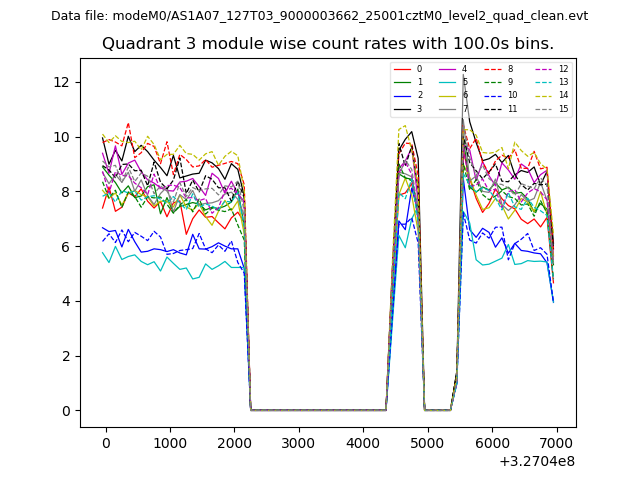
| Module-wise count rates for Quadrant C Data is divided into 100 sec bins |
 |
 |
| Module-wise count rates for Quadrant D Data is divided into 100 sec bins |
 |
 |
| Parameter | Plot |
|---|---|
| CZT HV Monitor | 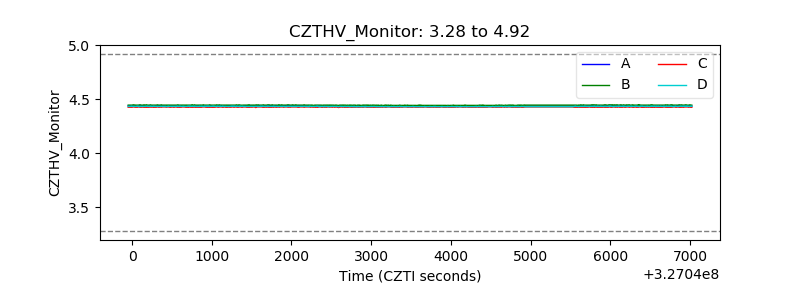 |
| D_VDD | 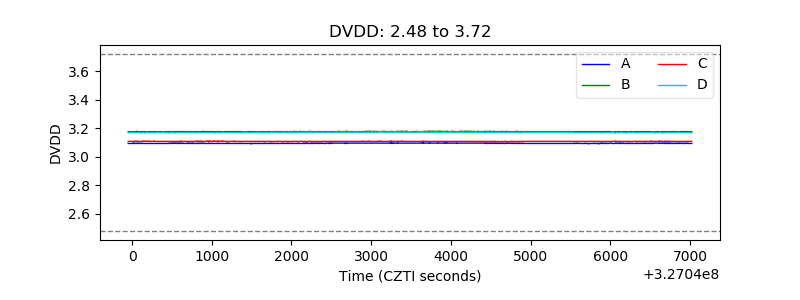 |
| Temperature 1 | 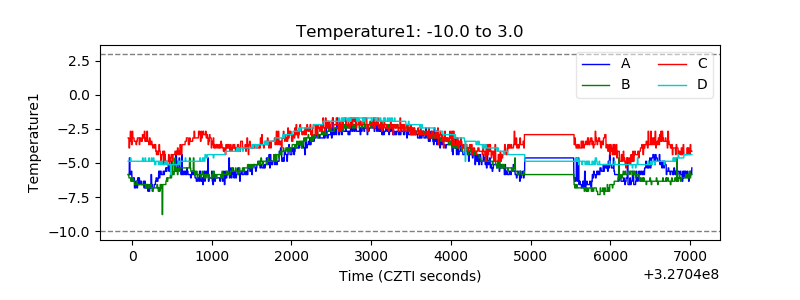 |
| Veto HV Monitor | 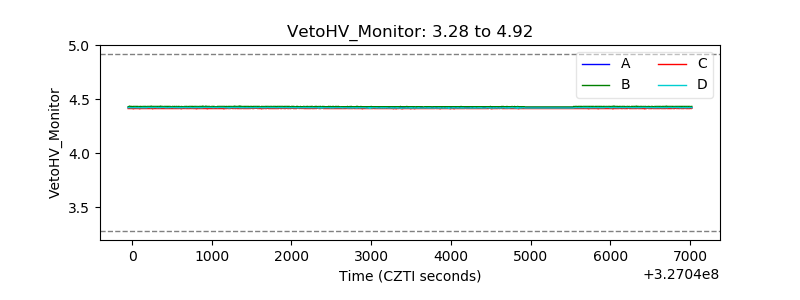 |
| Veto LLD | 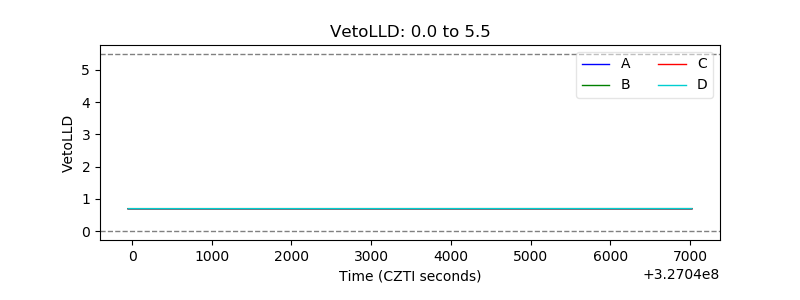 |
| Alpha Counter | 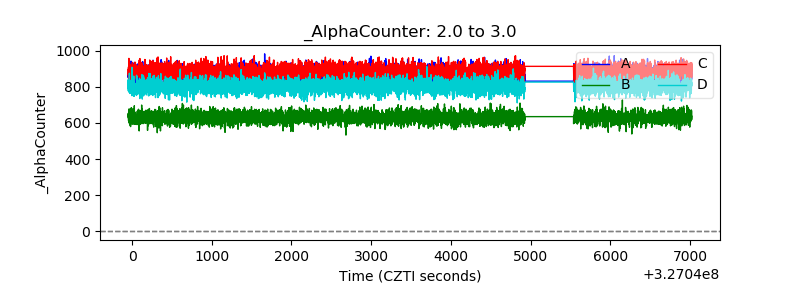 |
| _CPM_Rate | 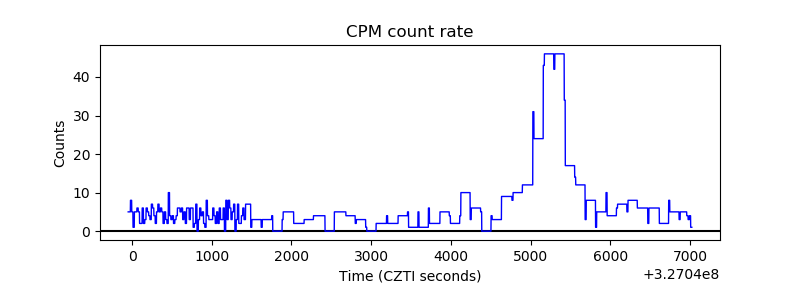 |
| CZT Counter | 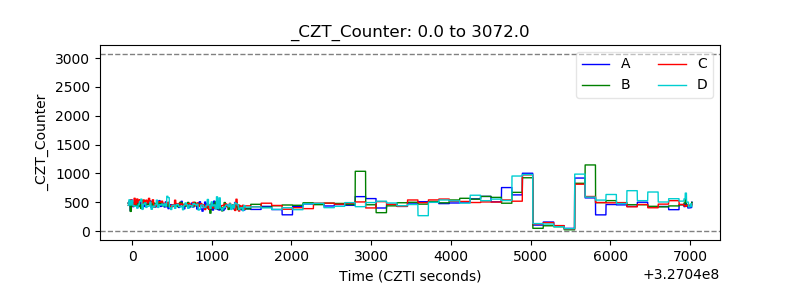 |
| +2.5 Volts monitor | 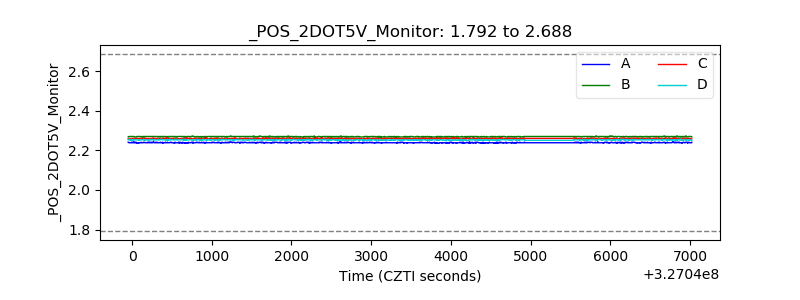 |
| +5 Volts monitor | 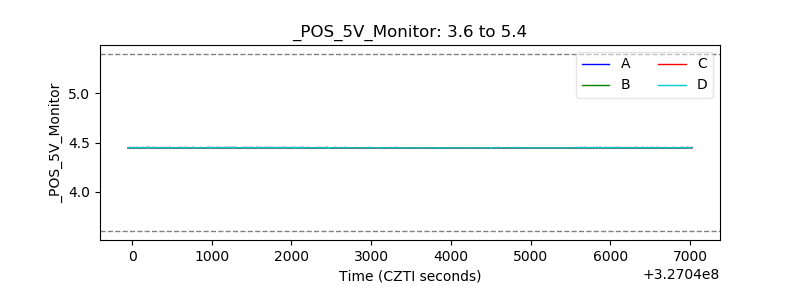 |
| _ROLL_ROT | 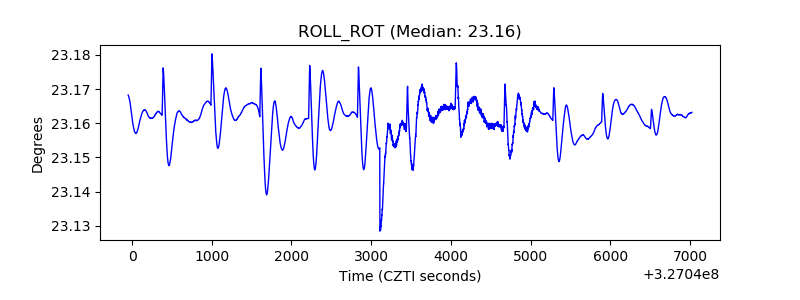 |
| _Roll_DEC |  |
| _Roll_RA | 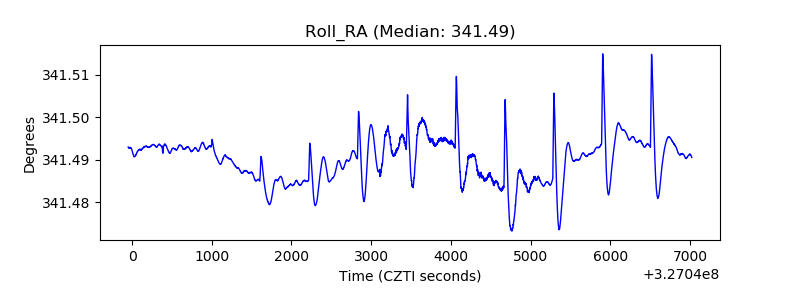 |
| Veto Counter | 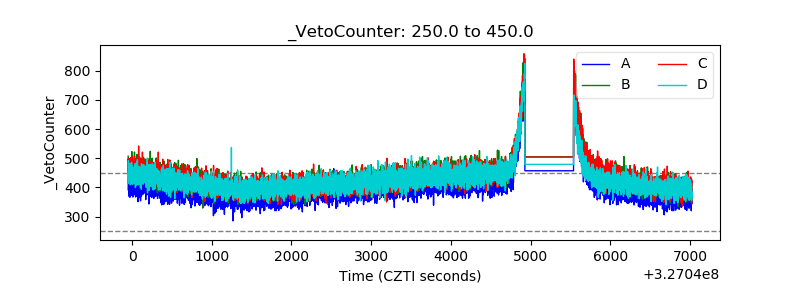 |