| Param | Original file | Final file |
|---|---|---|
| Filename | modeM0/AS1A07_127T03_9000003662_25002cztM0_level2.evt | modeM0/AS1A07_127T03_9000003662_25002cztM0_level2_quad_clean.evt |
| Size (bytes) | 535,524,480 | 110,384,640 |
| Size | 510.7 MB | 105.3 MB |
| Events in quadrant A | 3,734,926 | 704,443 |
| Events in quadrant B | 3,787,886 | 722,777 |
| Events in quadrant C | 3,782,620 | 695,376 |
| Events in quadrant D | 4,386,586 | 681,343 |
| Mode M0 | |||
|---|---|---|---|
| Quadrant | BADHDUFLAG | Total packets | Discarded packets |
| A | 0 | 16106 | 0 |
| B | 0 | 16211 | 0 |
| C | 0 | 16121 | 0 |
| D | 0 | 18192 | 0 |
| Mode SS | |||
|---|---|---|---|
| Quadrant | BADHDUFLAG | Total packets | Discarded packets |
| A | 0 | 156 | 0 |
| B | 0 | 156 | 0 |
| C | 0 | 156 | 0 |
| D | 0 | 156 | 0 |
| Quadrant | Total seconds | Saturated seconds | Saturation percentage |
|---|---|---|---|
| A | 7745 | 281 | 3.628147% |
| B | 7746 | 297 | 3.834237% |
| C | 7746 | 293 | 3.782597% |
| D | 7746 | 250 | 3.227472% |
Noise dominated data is calculated using 1-second bins in cleaned event files. If a bin has >2000 counts, and if more than 50% of those come from <1% of pixels, then it is considered to be noise-dominated and hence unusable.
| Quadrant | # 1 sec bins | Bins with >0 counts | Bins with >2000 counts | High rate bins dominated by noise | Noise dominated (total time) | Noise dominated (detector-on time) | Marked lightcurve |
|---|---|---|---|---|---|---|---|
| A | 7745 | 7745 | 0 | 0 | 0.00% | 0.00% | 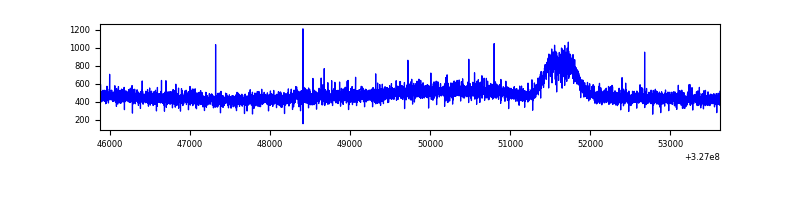 |
| B | 7746 | 7746 | 0 | 0 | 0.00% | 0.00% | 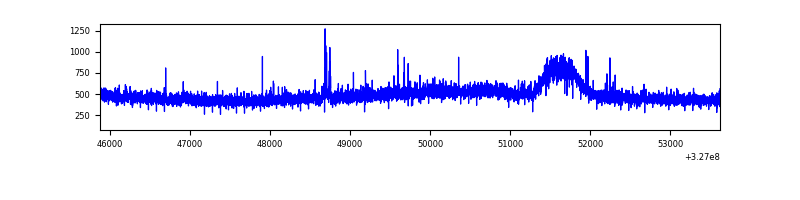 |
| C | 7746 | 7746 | 0 | 0 | 0.00% | 0.00% | 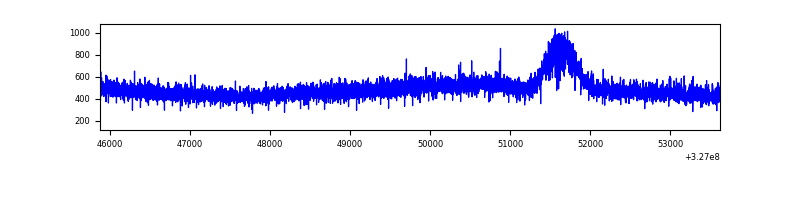 |
| D | 7746 | 7746 | 3 | 3 | 0.04% | 0.04% | 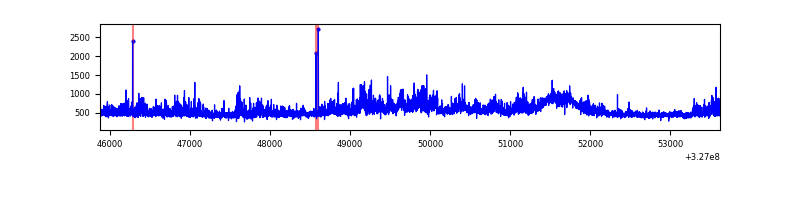 |
Top three noisy pixels from each quadrant. If the there are fewer than three noisy pixels in the level2.evt file, extra rows are filled as -1
| Pixel properties | Quadrant properties | ||||||
|---|---|---|---|---|---|---|---|
| Quadrant | DetID | PixID | Counts | Sigma | Mean | Median | Sigma |
| A | 13 | 254 | 12610 | 59.16 | 966 | 942 | 197.2 |
| A | 3 | 137 | 9061 | 41.16 | 966 | 942 | 197.2 |
| A | 0 | 226 | 8171 | 36.65 | 966 | 942 | 197.2 |
| B | 12 | 111 | 23211 | 119.34 | 958 | 930 | 186.7 |
| B | 11 | 111 | 21179 | 108.46 | 958 | 930 | 186.7 |
| B | 14 | 111 | 18629 | 94.8 | 958 | 930 | 186.7 |
| C | 14 | 238 | 145631 | 658.87 | 930 | 935 | 219.6 |
| C | 7 | 247 | 12286 | 51.69 | 930 | 935 | 219.6 |
| C | 13 | 61 | 6358 | 24.69 | 930 | 935 | 219.6 |
| D | 8 | 195 | 622271 | 2676.75 | 950 | 922 | 232.1 |
| D | 7 | 238 | 133697 | 571.99 | 950 | 922 | 232.1 |
| D | 2 | 234 | 33061 | 138.45 | 950 | 922 | 232.1 |
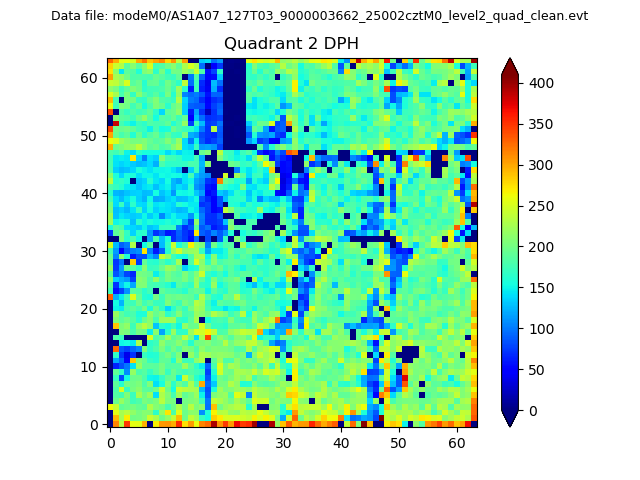
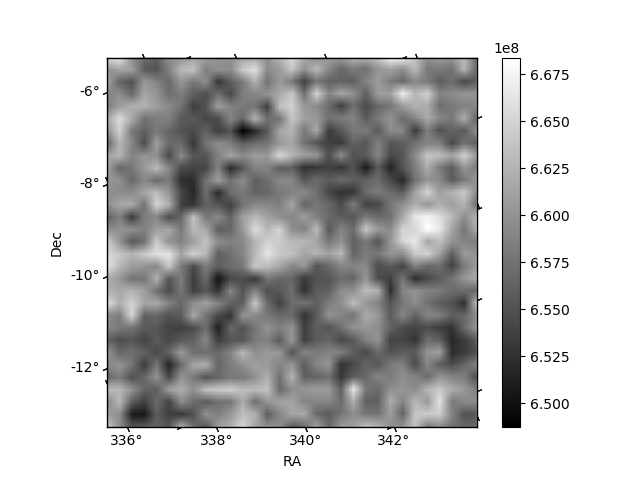
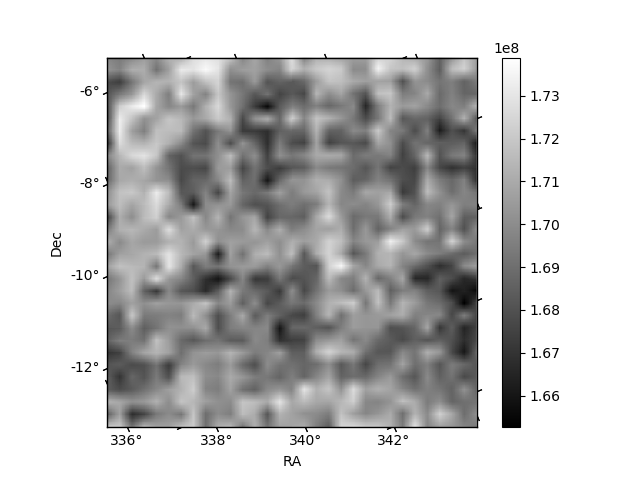
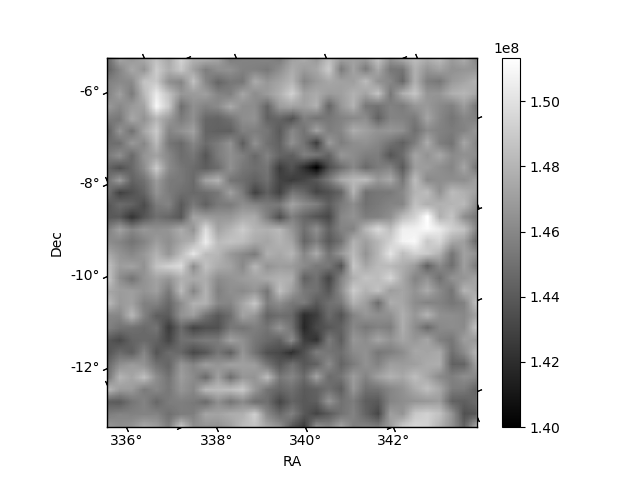
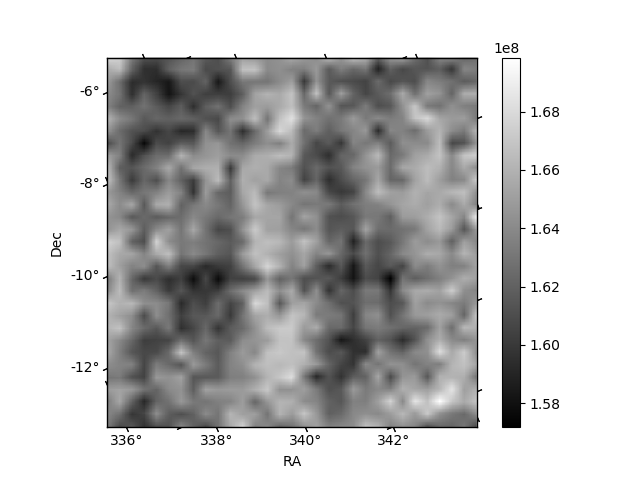
Histogram calculated using DETX and DETY for each event in the final _common_clean file
| Quadrant A | 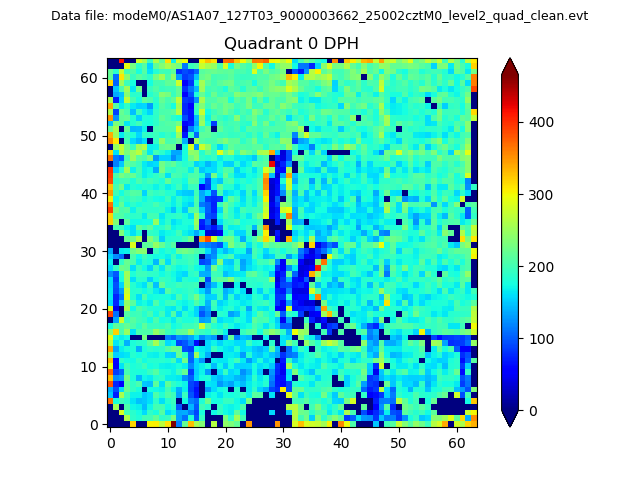 |
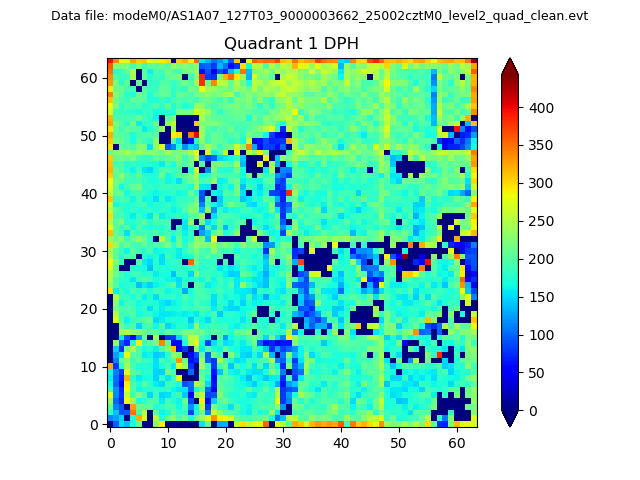 |
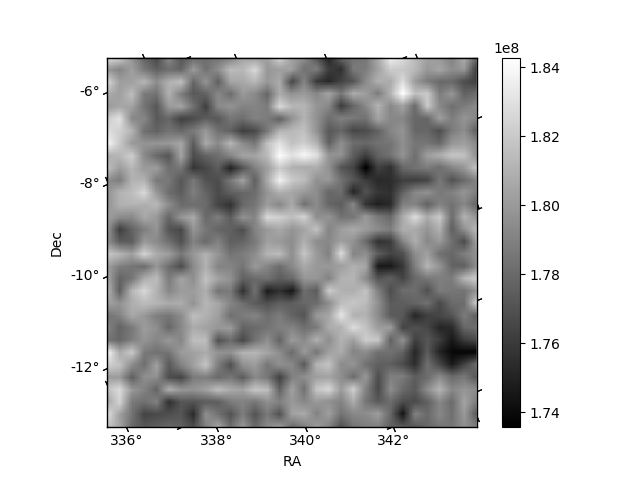
Quadrant B |
|---|---|---|---|
| Quadrant D | 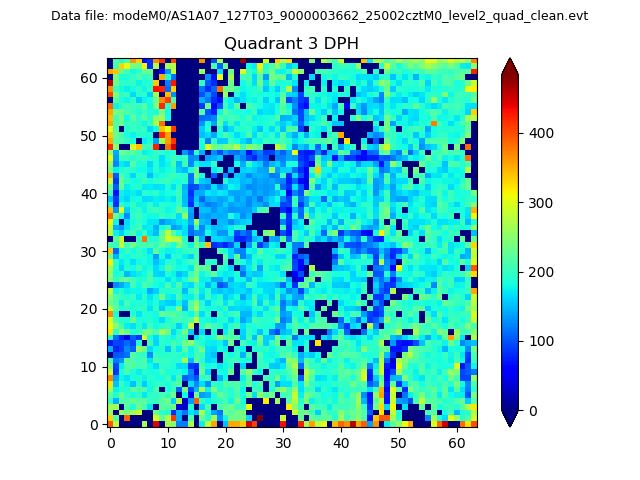 |
 |
Quadrant C |
| Plot type | Count rate plots | Images |
|---|---|---|
| Comparison with Poisson distribution Blue bars denote a histogram of data divided into 1 sec bins. Red curve is a Poisson curve with rate = median count rate of data. |
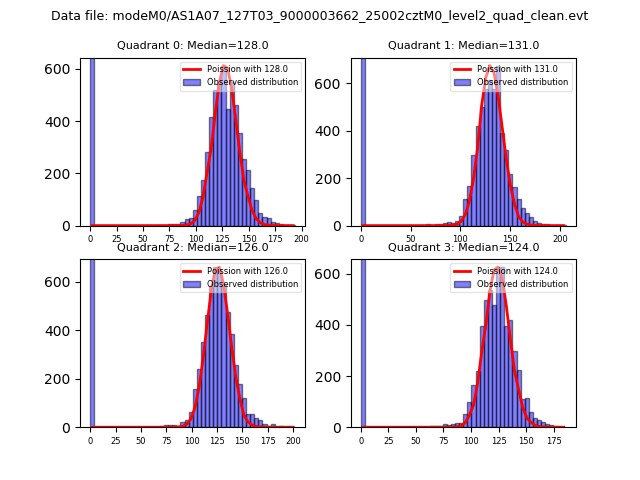 |
 |
| Quadrant-wise count rates Data is divided into 100 sec bins |
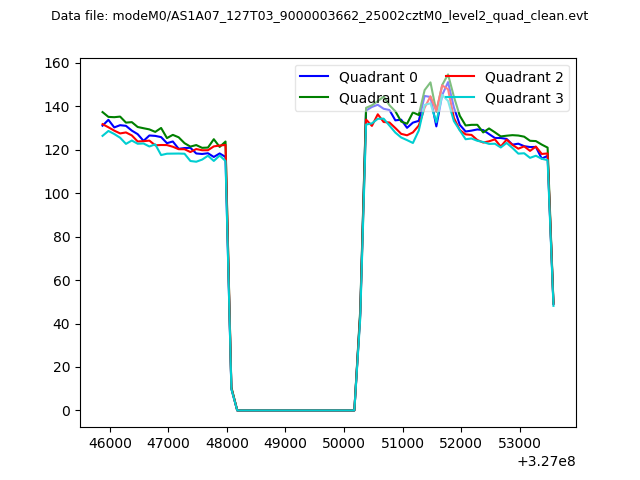 |
|
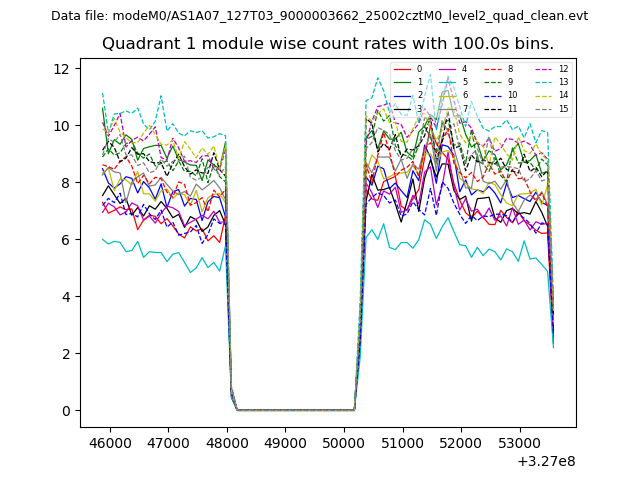
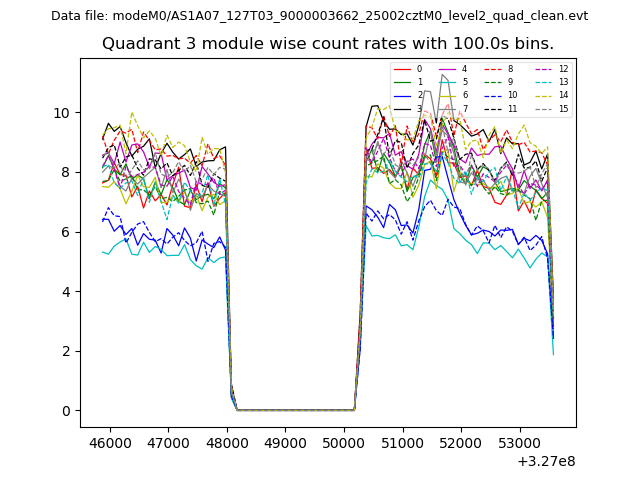
| Module-wise count rates for Quadrant A Data is divided into 100 sec bins |
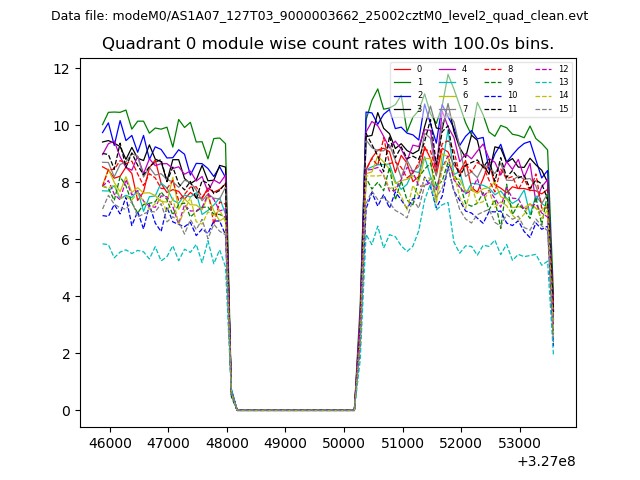 |
 |
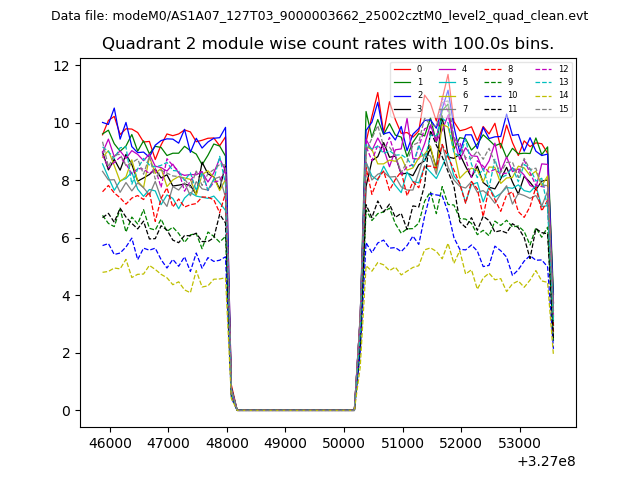
| Module-wise count rates for Quadrant B Data is divided into 100 sec bins |
 |
 |
| Module-wise count rates for Quadrant C Data is divided into 100 sec bins |
 |
 |
| Module-wise count rates for Quadrant D Data is divided into 100 sec bins |
 |
 |
| Parameter | Plot |
|---|---|
| CZT HV Monitor | 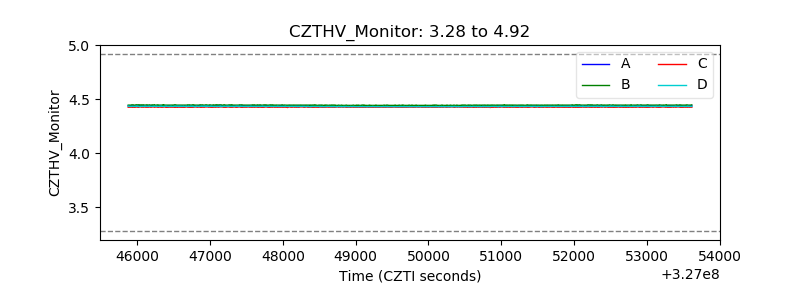 |
| D_VDD | 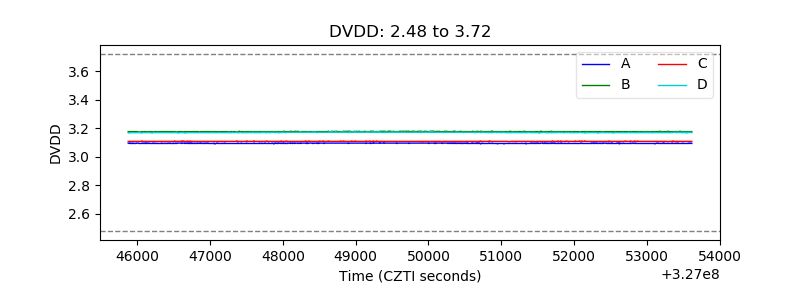 |
| Temperature 1 | 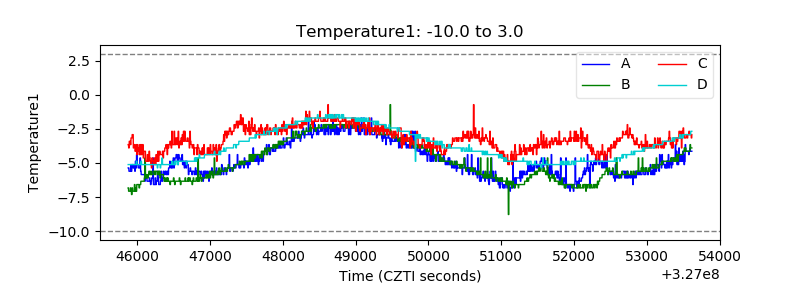 |
| Veto HV Monitor | 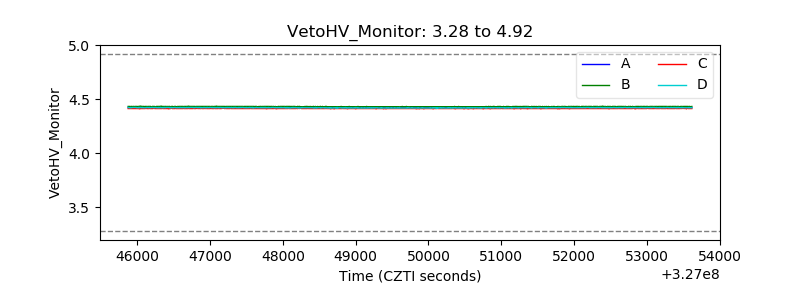 |
| Veto LLD | 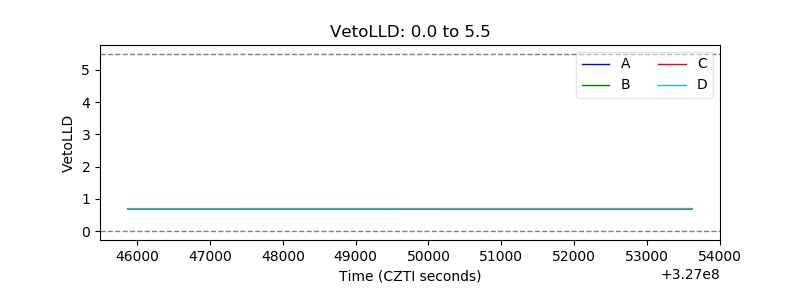 |
| Alpha Counter | 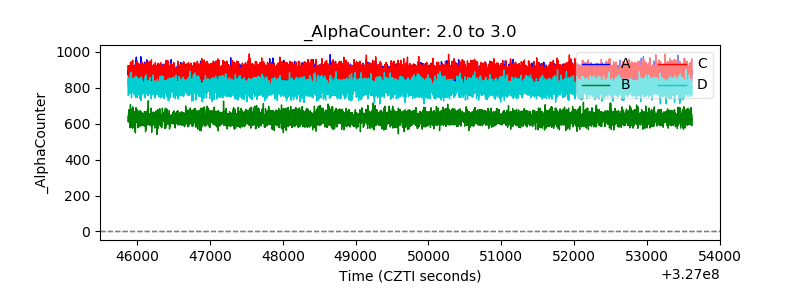 |
| _CPM_Rate | 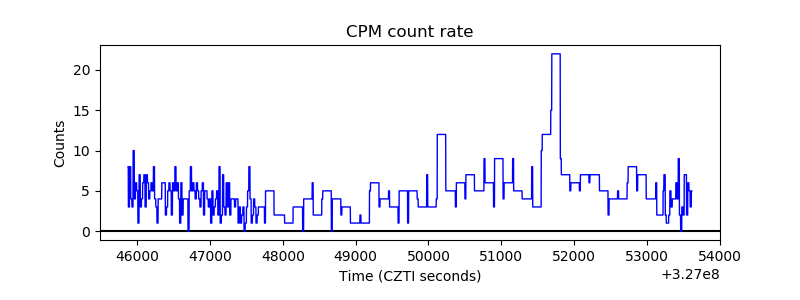 |
| CZT Counter | 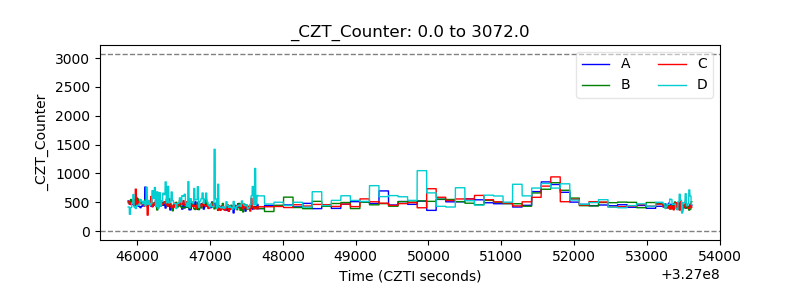 |
| +2.5 Volts monitor |  |
| +5 Volts monitor |  |
| _ROLL_ROT | 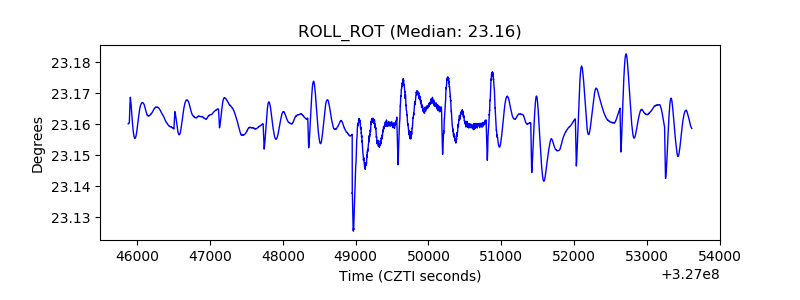 |
| _Roll_DEC | 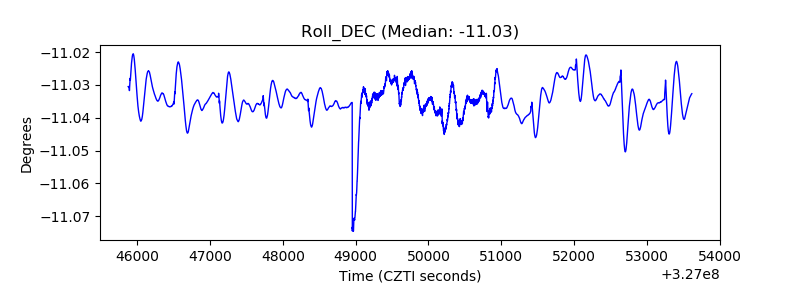 |
| _Roll_RA | 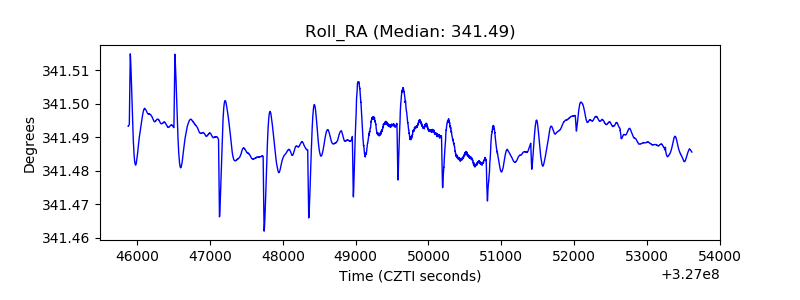 |
| Veto Counter | 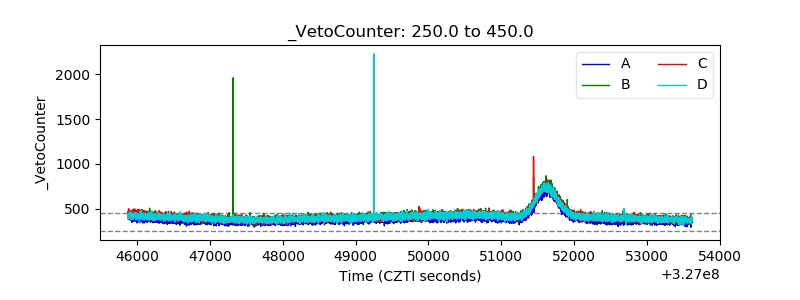 |