| Param | Original file | Final file |
|---|---|---|
| Filename | modeM0/AS1A07_127T03_9000003662_25003cztM0_level2.evt | modeM0/AS1A07_127T03_9000003662_25003cztM0_level2_quad_clean.evt |
| Size (bytes) | 495,953,280 | 97,329,600 |
| Size | 473.0 MB | 92.8 MB |
| Events in quadrant A | 3,371,024 | 617,009 |
| Events in quadrant B | 3,453,930 | 629,032 |
| Events in quadrant C | 3,571,810 | 607,507 |
| Events in quadrant D | 4,137,260 | 595,755 |
| Mode M0 | |||
|---|---|---|---|
| Quadrant | BADHDUFLAG | Total packets | Discarded packets |
| A | 0 | 14669 | 2 |
| B | 0 | 14848 | 3 |
| C | 0 | 15023 | 2 |
| D | 0 | 16922 | 2 |
| Mode SS | |||
|---|---|---|---|
| Quadrant | BADHDUFLAG | Total packets | Discarded packets |
| A | 0 | 146 | 0 |
| B | 0 | 146 | 0 |
| C | 0 | 146 | 0 |
| D | 0 | 146 | 0 |
| Mode M9 | |||
|---|---|---|---|
| Quadrant | BADHDUFLAG | Total packets | Discarded packets |
| A | 0 | 1 | 0 |
| B | 0 | 1 | 0 |
| C | 0 | 1 | 0 |
| D | 0 | 1 | 0 |
| Quadrant | Total seconds | Saturated seconds | Saturation percentage |
|---|---|---|---|
| A | 7146 | 207 | 2.896725% |
| B | 7146 | 218 | 3.050658% |
| C | 7146 | 216 | 3.022670% |
| D | 7146 | 169 | 2.364959% |
Noise dominated data is calculated using 1-second bins in cleaned event files. If a bin has >2000 counts, and if more than 50% of those come from <1% of pixels, then it is considered to be noise-dominated and hence unusable.
| Quadrant | # 1 sec bins | Bins with >0 counts | Bins with >2000 counts | High rate bins dominated by noise | Noise dominated (total time) | Noise dominated (detector-on time) | Marked lightcurve |
|---|---|---|---|---|---|---|---|
| A | 7241 | 7148 | 0 | 0 | 0.00% | 0.00% | 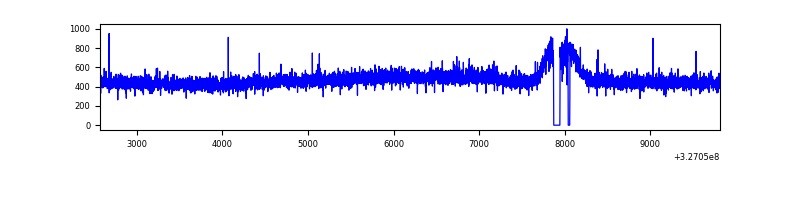 |
| B | 7241 | 7148 | 1 | 1 | 0.01% | 0.01% | 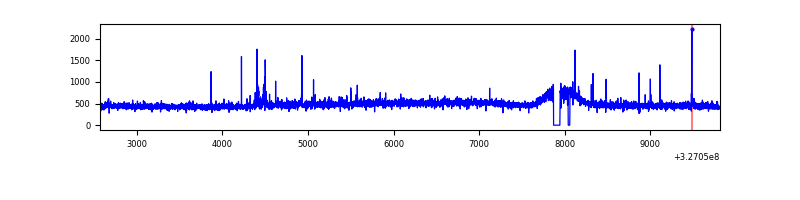 |
| C | 7241 | 7148 | 0 | 0 | 0.00% | 0.00% | 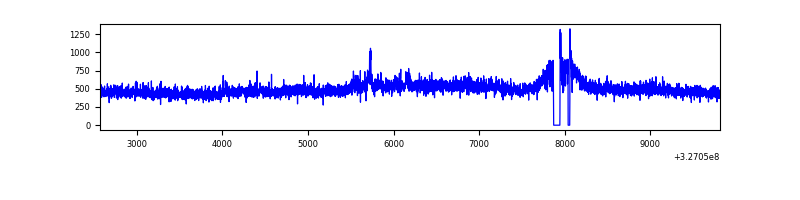 |
| D | 7241 | 7148 | 9 | 9 | 0.12% | 0.13% | 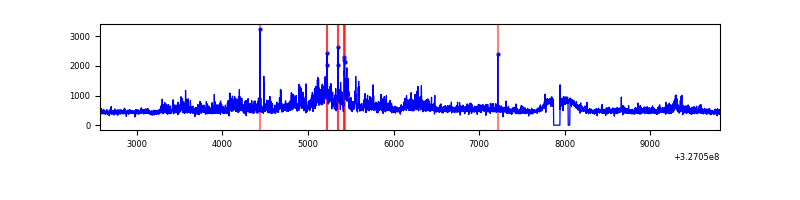 |
Top three noisy pixels from each quadrant. If the there are fewer than three noisy pixels in the level2.evt file, extra rows are filled as -1
| Pixel properties | Quadrant properties | ||||||
|---|---|---|---|---|---|---|---|
| Quadrant | DetID | PixID | Counts | Sigma | Mean | Median | Sigma |
| A | 13 | 254 | 11312 | 58.97 | 872 | 850 | 177.4 |
| A | 3 | 137 | 8200 | 41.43 | 872 | 850 | 177.4 |
| A | 0 | 226 | 7409 | 36.97 | 872 | 850 | 177.4 |
| B | 0 | 190 | 22861 | 130.15 | 866 | 842 | 169.2 |
| B | 12 | 111 | 20899 | 118.56 | 866 | 842 | 169.2 |
| B | 11 | 111 | 19096 | 107.9 | 866 | 842 | 169.2 |
| C | 7 | 247 | 158057 | 796.15 | 839 | 845 | 197.5 |
| C | 14 | 238 | 131284 | 660.57 | 839 | 845 | 197.5 |
| C | 3 | 233 | 11678 | 54.86 | 839 | 845 | 197.5 |
| D | 8 | 195 | 559528 | 2657.53 | 855 | 826 | 210.2 |
| D | 7 | 238 | 313252 | 1486.09 | 855 | 826 | 210.2 |
| D | 2 | 234 | 30220 | 139.82 | 855 | 826 | 210.2 |
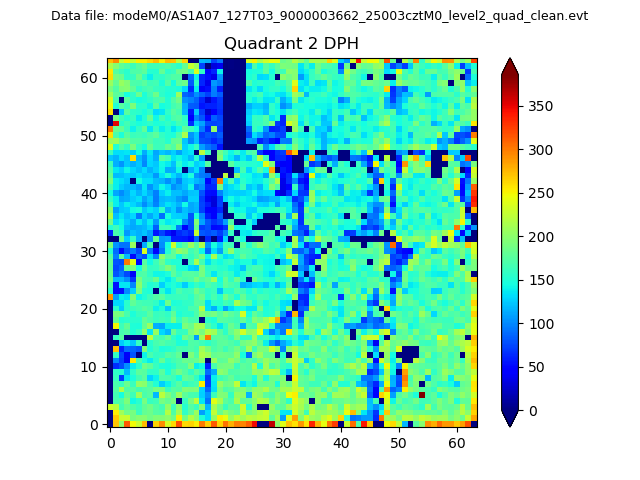
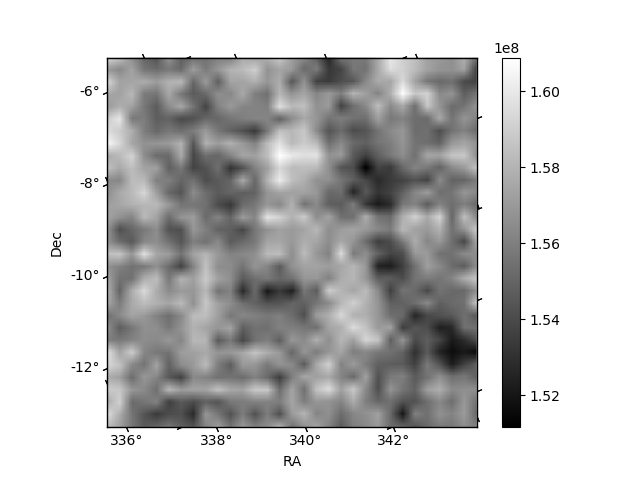
Histogram calculated using DETX and DETY for each event in the final _common_clean file
| Quadrant A | 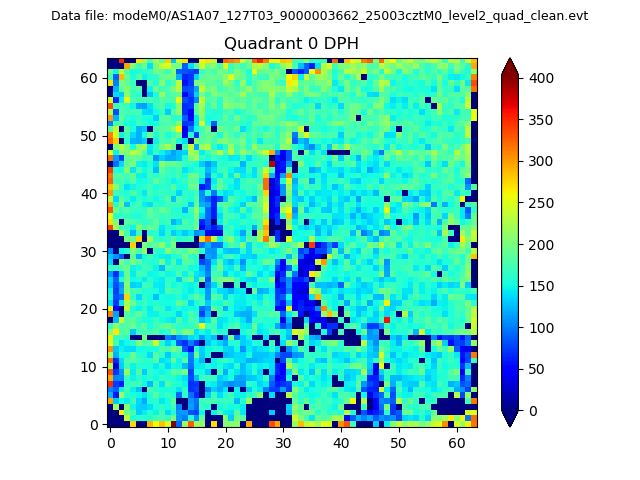 |
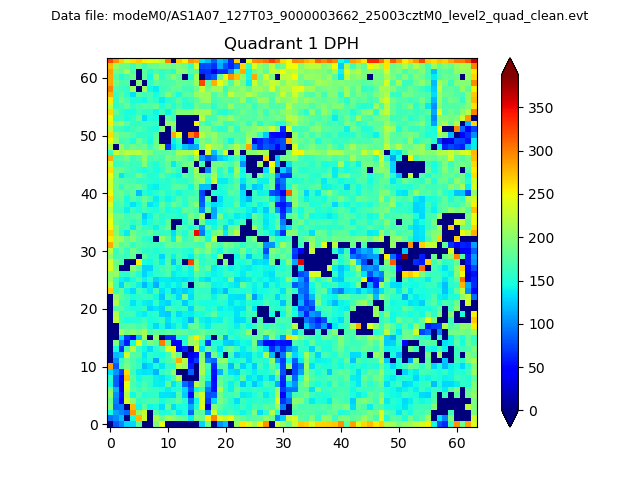 |
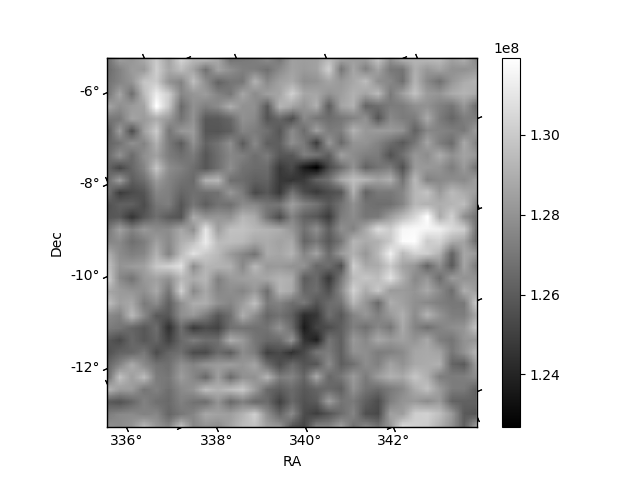
Quadrant B |
|---|---|---|---|
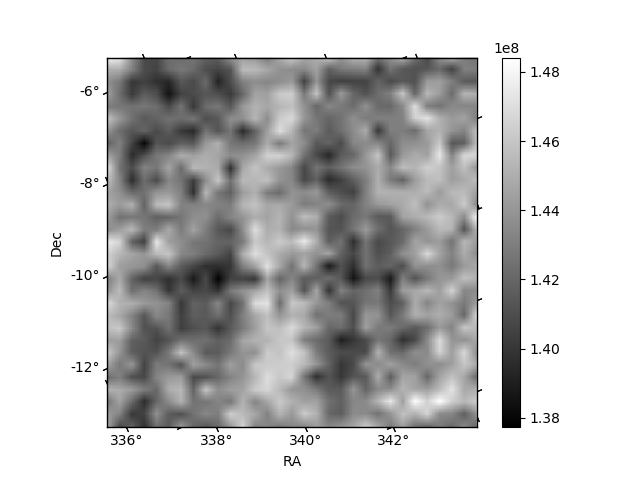
| Quadrant D | 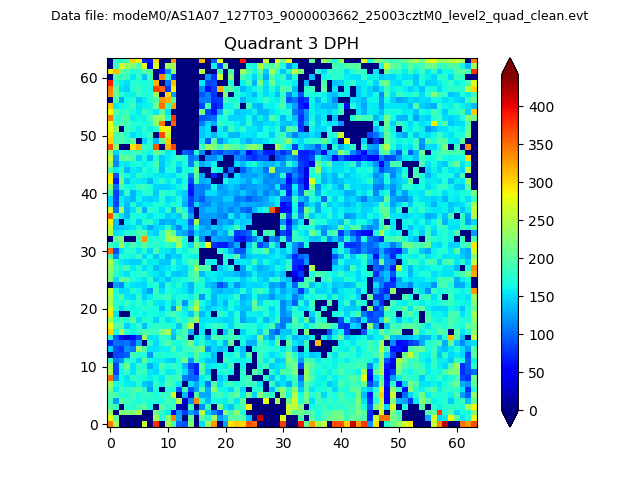 |
 |
Quadrant C |
| Plot type | Count rate plots | Images |
|---|---|---|
| Comparison with Poisson distribution Blue bars denote a histogram of data divided into 1 sec bins. Red curve is a Poisson curve with rate = median count rate of data. |
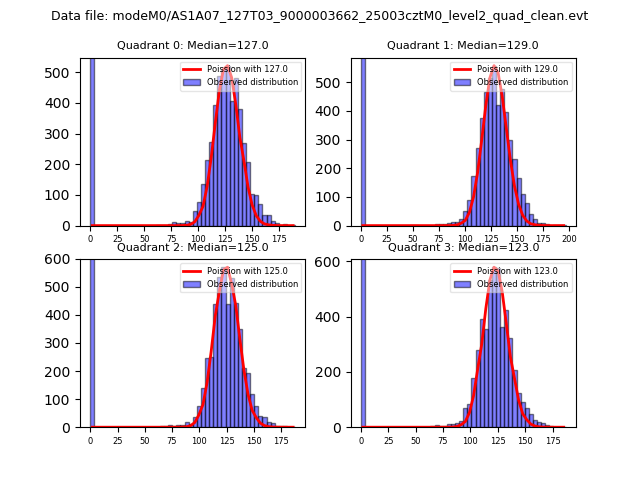 |
 |
| Quadrant-wise count rates Data is divided into 100 sec bins |
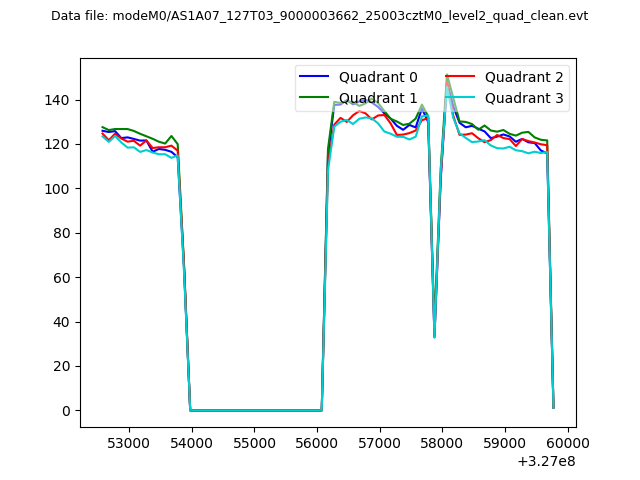 |
|
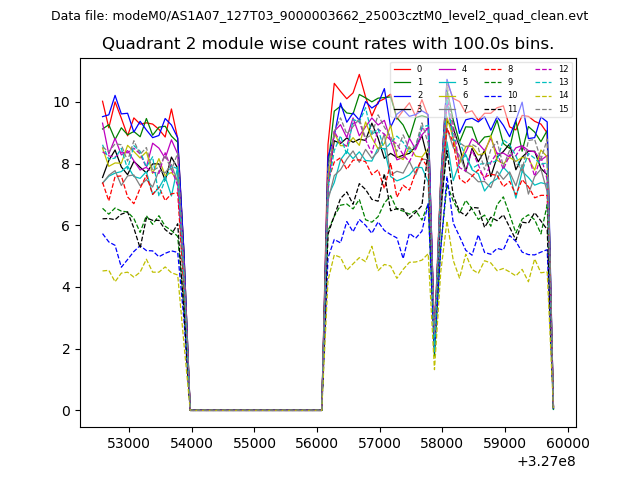
| Module-wise count rates for Quadrant A Data is divided into 100 sec bins |
 |
 |
| Module-wise count rates for Quadrant B Data is divided into 100 sec bins |
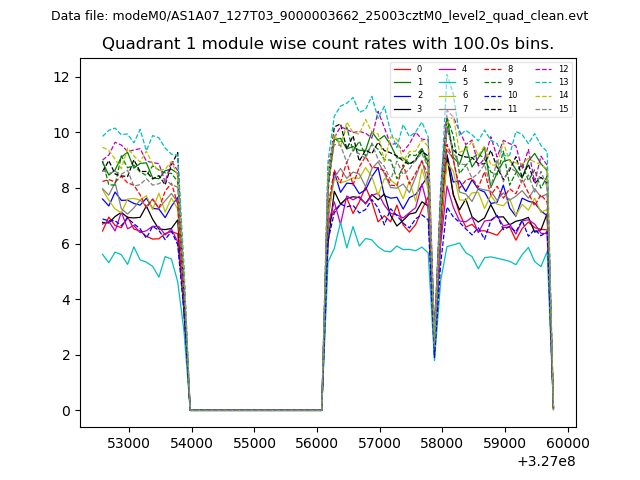 |
 |
| Module-wise count rates for Quadrant C Data is divided into 100 sec bins |
 |
 |
| Module-wise count rates for Quadrant D Data is divided into 100 sec bins |
 |
 |
| Parameter | Plot |
|---|---|
| CZT HV Monitor | 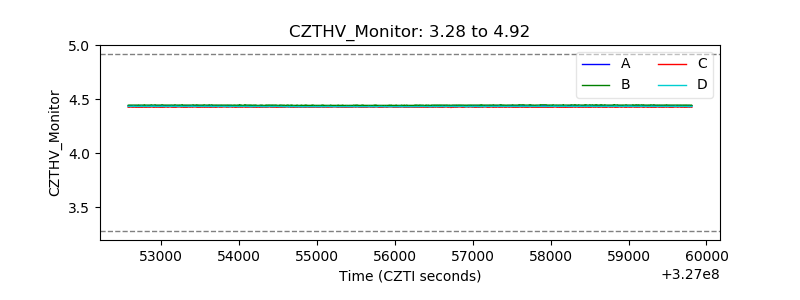 |
| D_VDD | 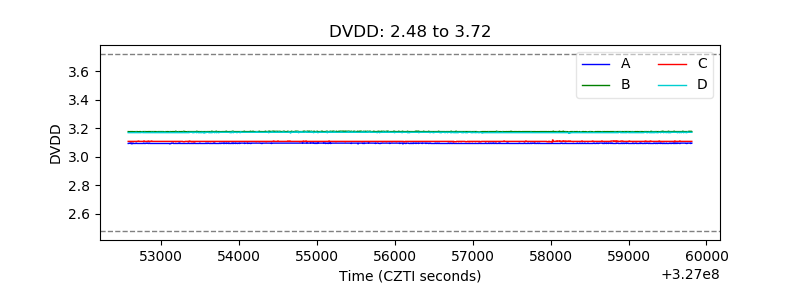 |
| Temperature 1 | 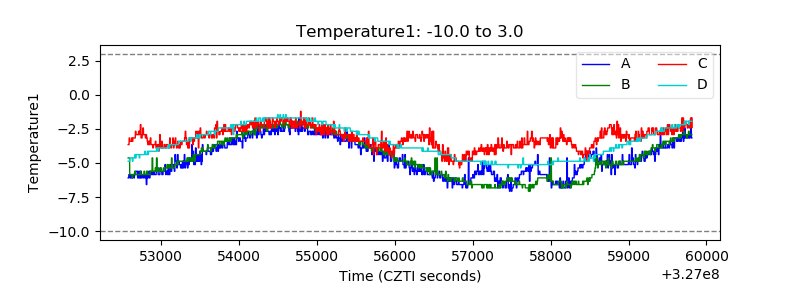 |
| Veto HV Monitor | 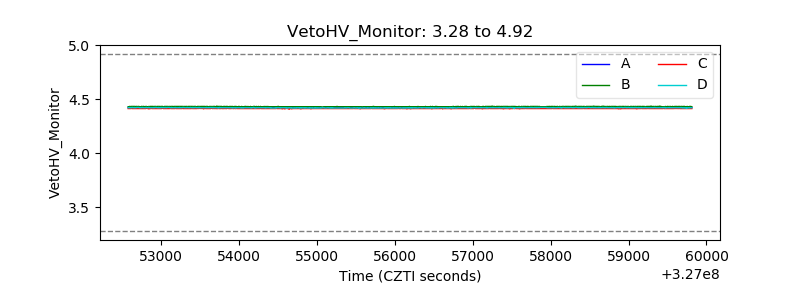 |
| Veto LLD | 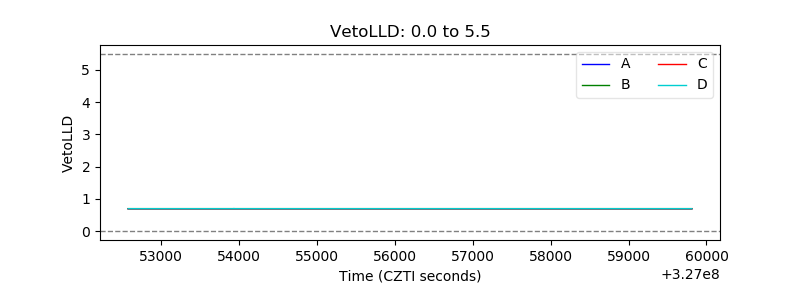 |
| Alpha Counter | 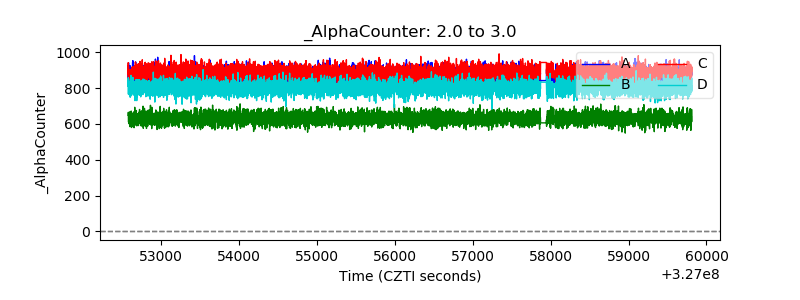 |
| _CPM_Rate | 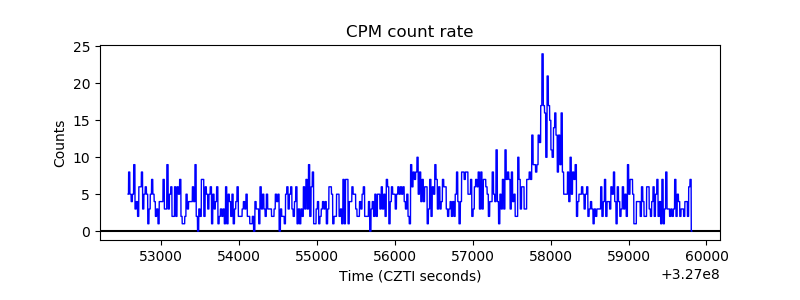 |
| CZT Counter |  |
| +2.5 Volts monitor |  |
| +5 Volts monitor | 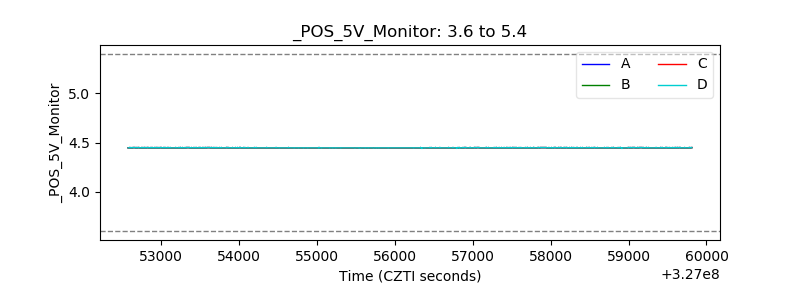 |
| _ROLL_ROT |  |
| _Roll_DEC |  |
| _Roll_RA |  |
| Veto Counter |  |