| Param | Original file | Final file |
|---|---|---|
| Filename | modeM0/AS1A07_127T03_9000003662_25006cztM0_level2.evt | modeM0/AS1A07_127T03_9000003662_25006cztM0_level2_quad_clean.evt |
| Size (bytes) | 1,422,334,080 | 216,239,040 |
| Size | 1.3 GB | 206.2 MB |
| Events in quadrant A | 8,693,485 | 1,342,863 |
| Events in quadrant B | 8,969,245 | 1,361,612 |
| Events in quadrant C | 9,405,299 | 1,305,766 |
| Events in quadrant D | 14,762,536 | 1,267,257 |
| Mode M0 | |||
|---|---|---|---|
| Quadrant | BADHDUFLAG | Total packets | Discarded packets |
| A | 0 | 37595 | 0 |
| B | 0 | 38073 | 0 |
| C | 0 | 38718 | 0 |
| D | 0 | 56732 | 0 |
| Mode SS | |||
|---|---|---|---|
| Quadrant | BADHDUFLAG | Total packets | Discarded packets |
| A | 0 | 374 | 0 |
| B | 0 | 374 | 0 |
| C | 0 | 374 | 0 |
| D | 0 | 374 | 0 |
| Mode M9 | |||
|---|---|---|---|
| Quadrant | BADHDUFLAG | Total packets | Discarded packets |
| A | 0 | 17 | 0 |
| B | 0 | 17 | 0 |
| C | 0 | 17 | 0 |
| D | 0 | 17 | 0 |
| Quadrant | Total seconds | Saturated seconds | Saturation percentage |
|---|---|---|---|
| A | 18453 | 268 | 1.452338% |
| B | 18454 | 308 | 1.669015% |
| C | 18453 | 330 | 1.788327% |
| D | 18453 | 427 | 2.313987% |
Noise dominated data is calculated using 1-second bins in cleaned event files. If a bin has >2000 counts, and if more than 50% of those come from <1% of pixels, then it is considered to be noise-dominated and hence unusable.
| Quadrant | # 1 sec bins | Bins with >0 counts | Bins with >2000 counts | High rate bins dominated by noise | Noise dominated (total time) | Noise dominated (detector-on time) | Marked lightcurve |
|---|---|---|---|---|---|---|---|
| A | 20093 | 18455 | 2 | 2 | 0.01% | 0.01% | 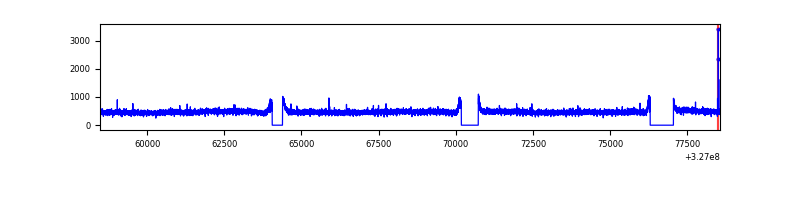 |
| B | 20094 | 18456 | 3 | 3 | 0.01% | 0.02% | 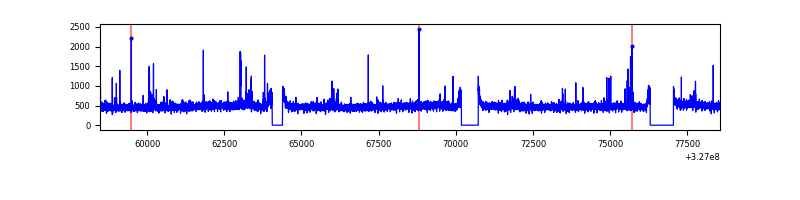 |
| C | 20093 | 18455 | 10 | 10 | 0.05% | 0.05% | 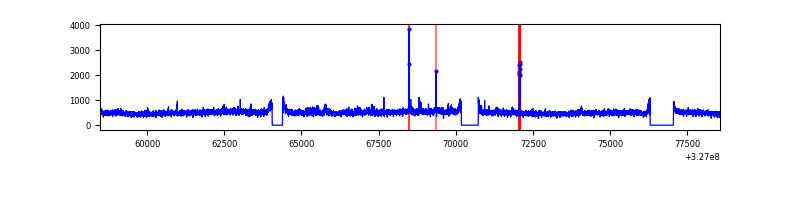 |
| D | 20093 | 18456 | 112 | 112 | 0.56% | 0.61% | 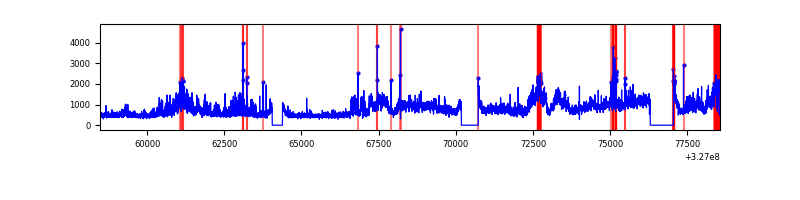 |
Top three noisy pixels from each quadrant. If the there are fewer than three noisy pixels in the level2.evt file, extra rows are filled as -1
| Pixel properties | Quadrant properties | ||||||
|---|---|---|---|---|---|---|---|
| Quadrant | DetID | PixID | Counts | Sigma | Mean | Median | Sigma |
| A | 13 | 254 | 28081 | 57.13 | 2251 | 2200 | 453.1 |
| A | 3 | 137 | 21245 | 42.04 | 2251 | 2200 | 453.1 |
| A | 0 | 226 | 19155 | 37.42 | 2251 | 2200 | 453.1 |
| B | 0 | 190 | 77316 | 175.0 | 2239 | 2179 | 429.3 |
| B | 12 | 111 | 54335 | 121.48 | 2239 | 2179 | 429.3 |
| B | 11 | 111 | 48067 | 106.88 | 2239 | 2179 | 429.3 |
| C | 7 | 247 | 484356 | 950.19 | 2163 | 2176 | 507.5 |
| C | 14 | 238 | 338092 | 661.96 | 2163 | 2176 | 507.5 |
| C | 2 | 16 | 74502 | 142.53 | 2163 | 2176 | 507.5 |
| D | 7 | 238 | 5194175 | 9749.93 | 2191 | 2129 | 532.5 |
| D | 8 | 195 | 846639 | 1585.87 | 2191 | 2129 | 532.5 |
| D | 12 | 153 | 236094 | 439.35 | 2191 | 2129 | 532.5 |
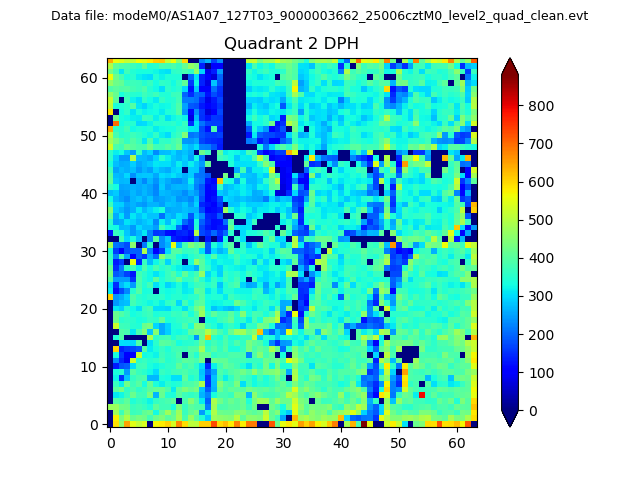
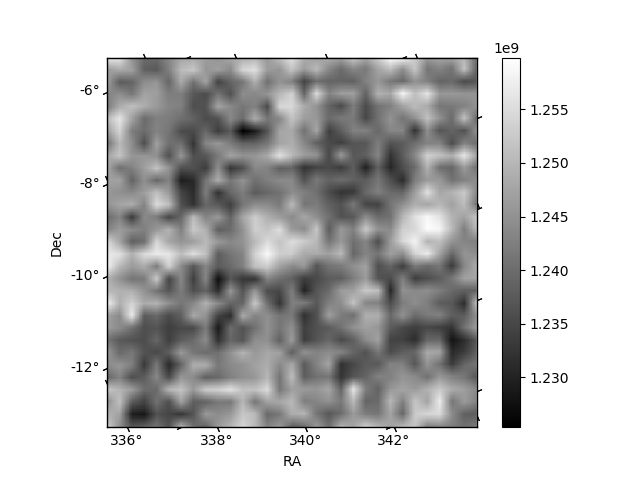
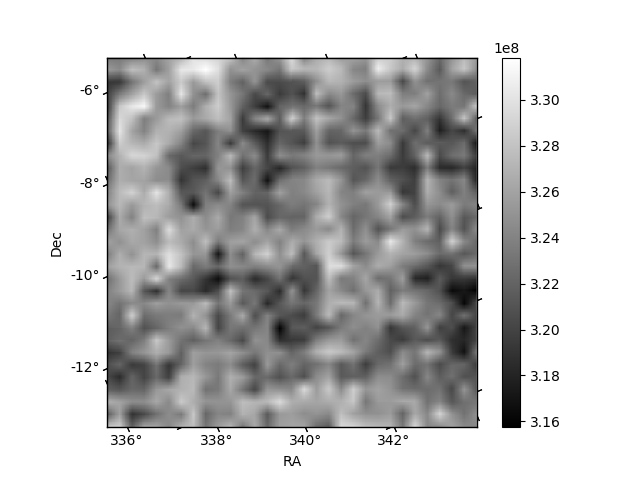
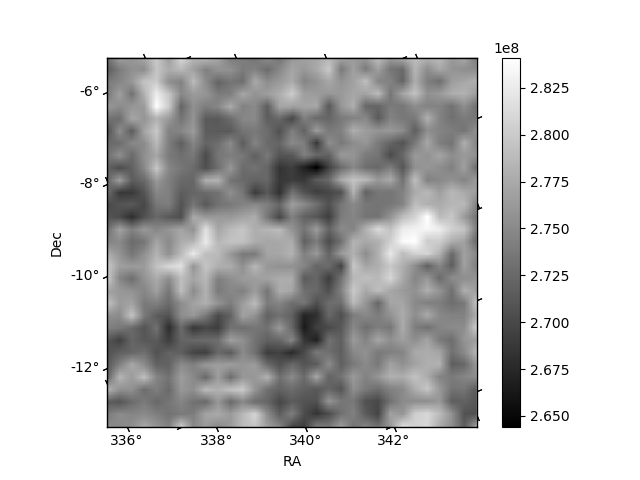
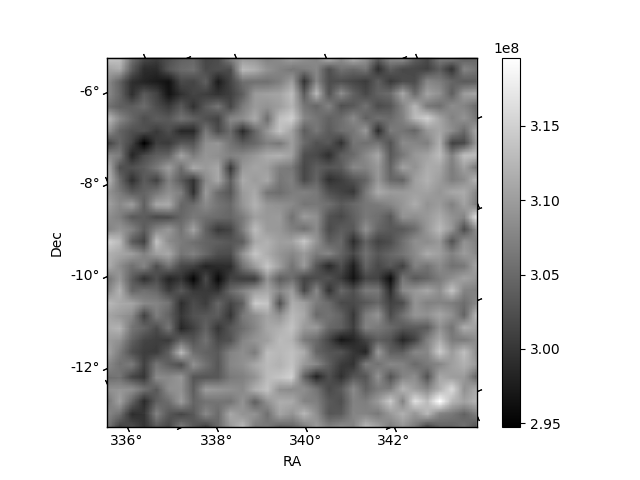
Histogram calculated using DETX and DETY for each event in the final _common_clean file
| Quadrant A | 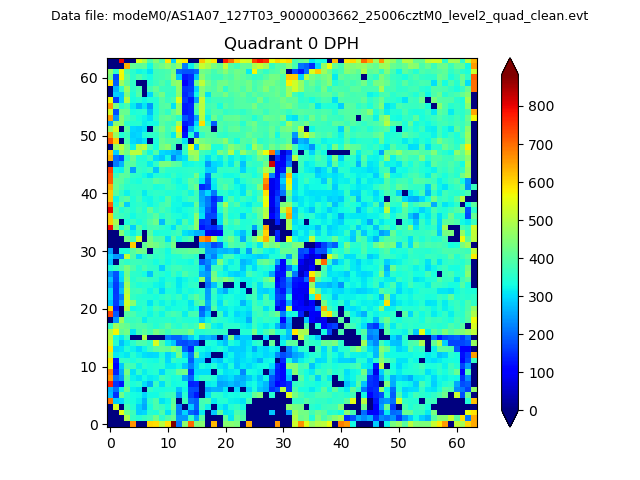 |
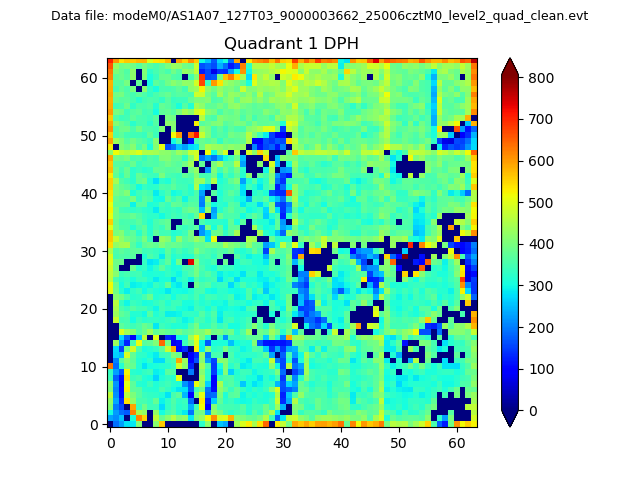 |
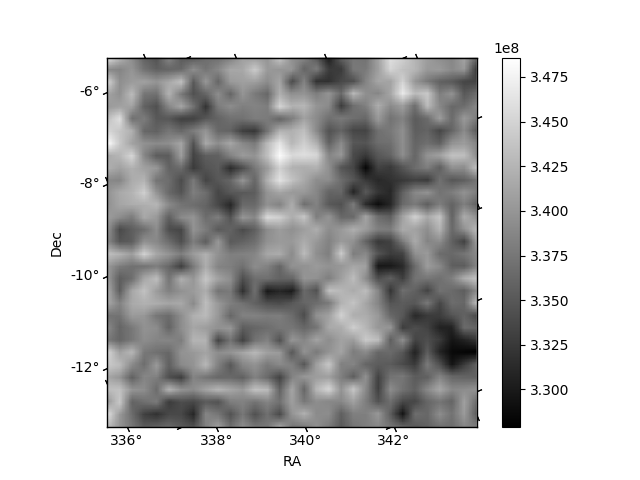
Quadrant B |
|---|---|---|---|
| Quadrant D | 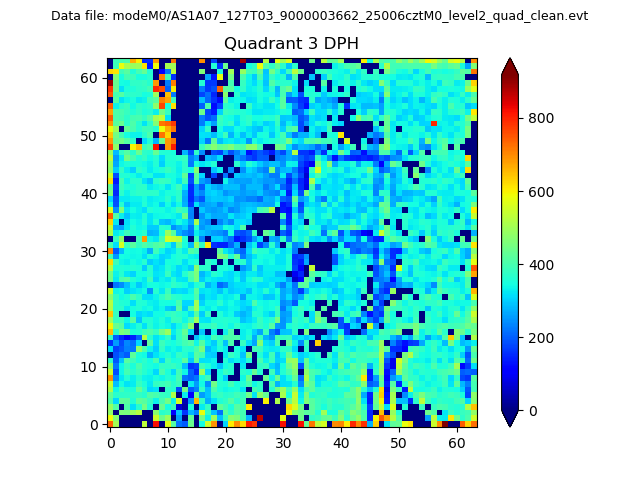 |
 |
Quadrant C |
| Plot type | Count rate plots | Images |
|---|---|---|
| Comparison with Poisson distribution Blue bars denote a histogram of data divided into 1 sec bins. Red curve is a Poisson curve with rate = median count rate of data. |
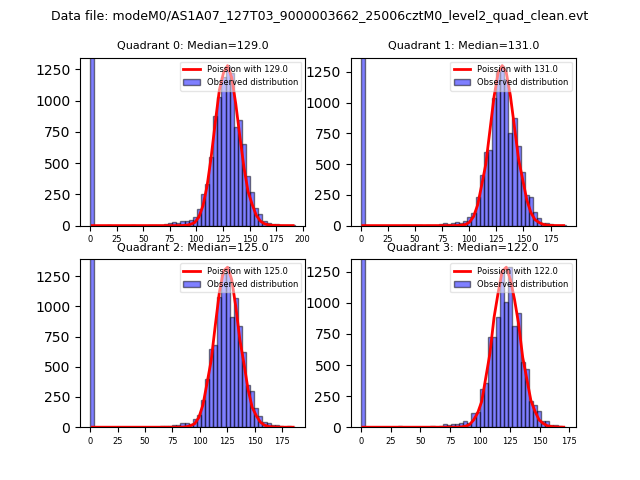 |
 |
| Quadrant-wise count rates Data is divided into 100 sec bins |
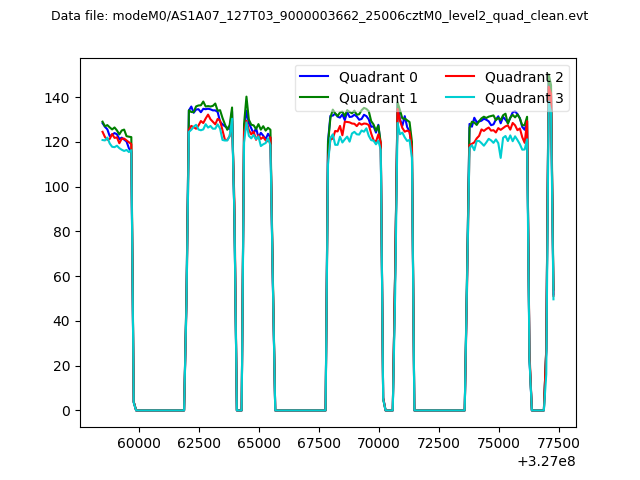 |
|
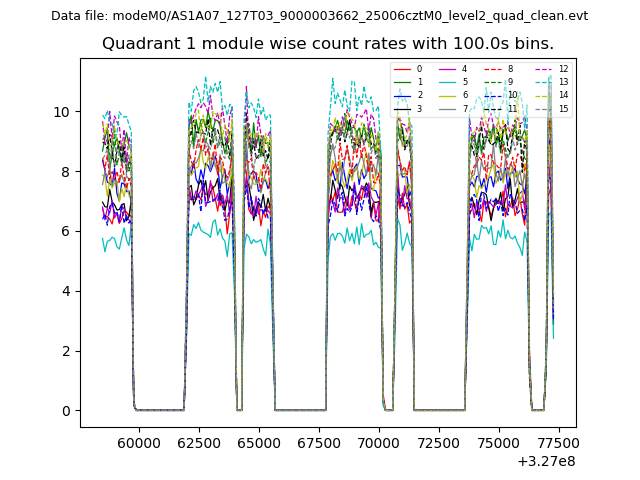
| Module-wise count rates for Quadrant A Data is divided into 100 sec bins |
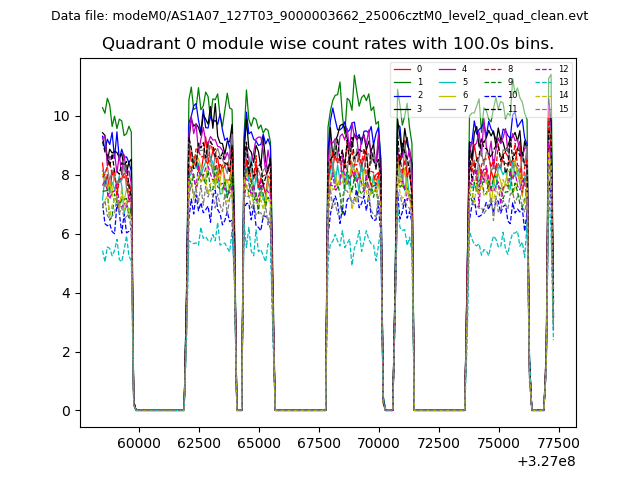 |
 |
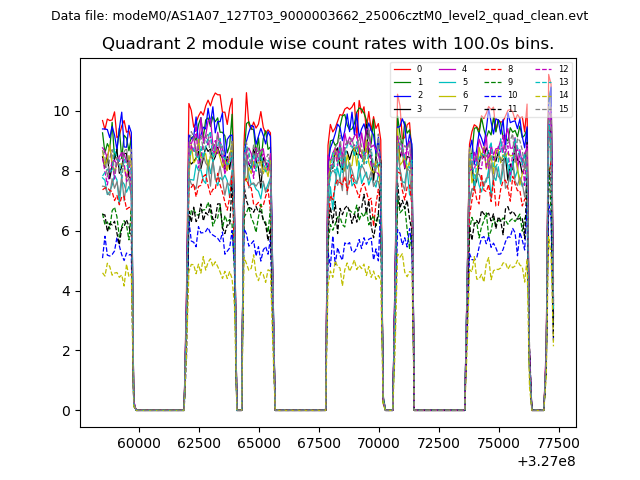
| Module-wise count rates for Quadrant B Data is divided into 100 sec bins |
 |
 |
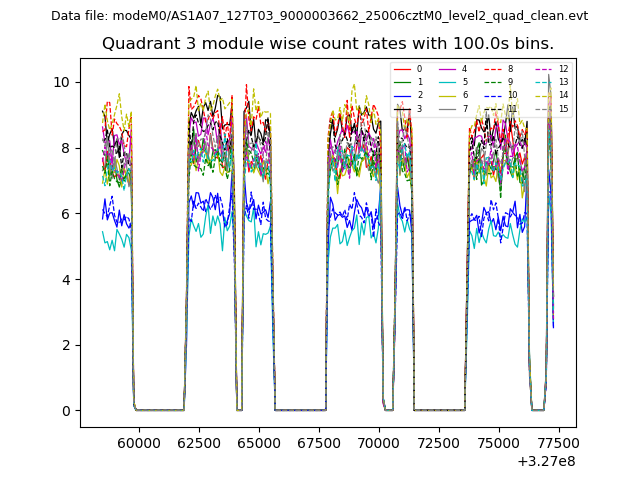
| Module-wise count rates for Quadrant C Data is divided into 100 sec bins |
 |
 |
| Module-wise count rates for Quadrant D Data is divided into 100 sec bins |
 |
 |
| Parameter | Plot |
|---|---|
| CZT HV Monitor | 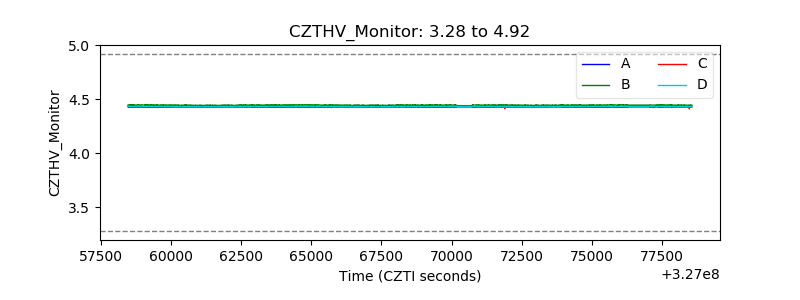 |
| D_VDD | 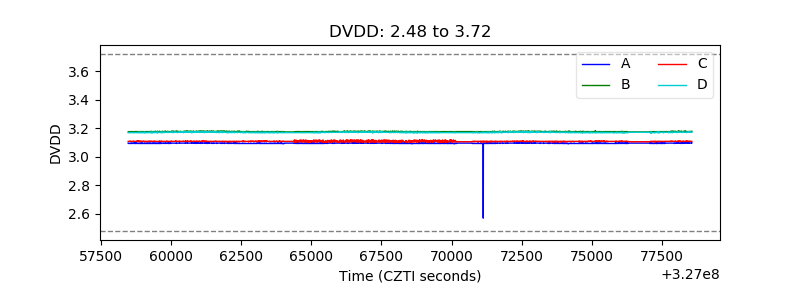 |
| Temperature 1 | 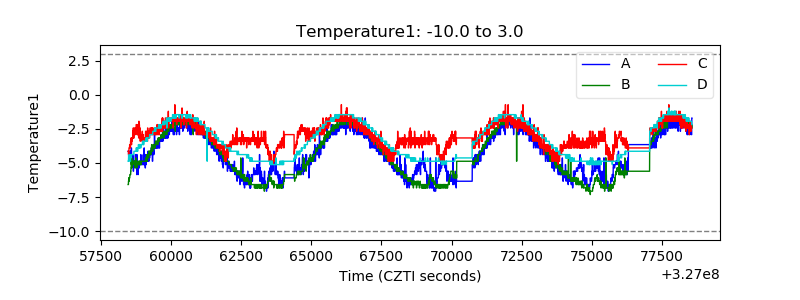 |
| Veto HV Monitor | 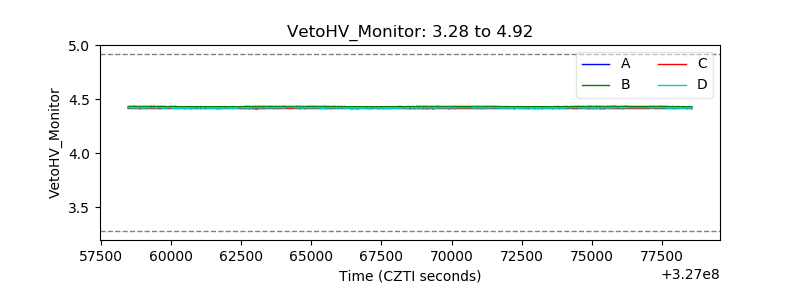 |
| Veto LLD | 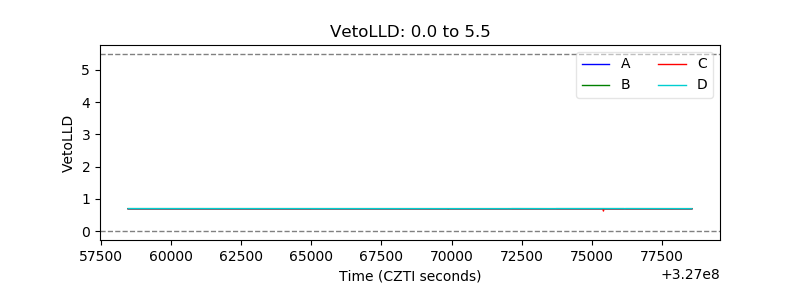 |
| Alpha Counter |  |
| _CPM_Rate | 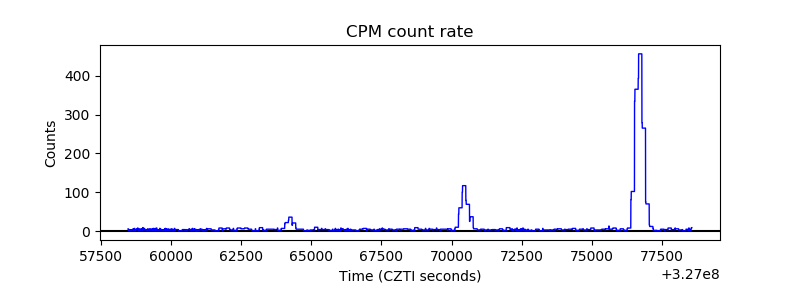 |
| CZT Counter | 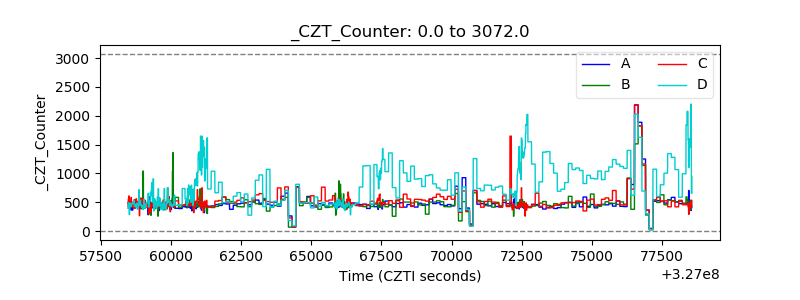 |
| +2.5 Volts monitor |  |
| +5 Volts monitor |  |
| _ROLL_ROT | 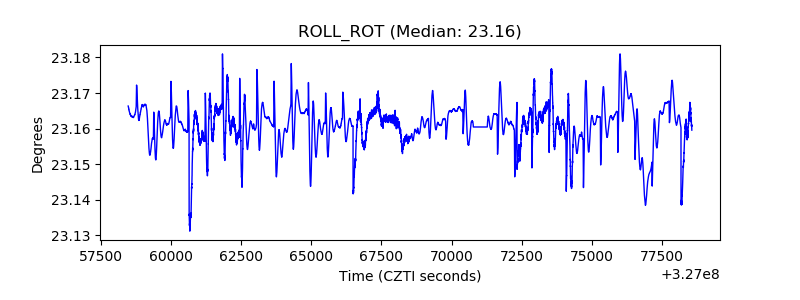 |
| _Roll_DEC | 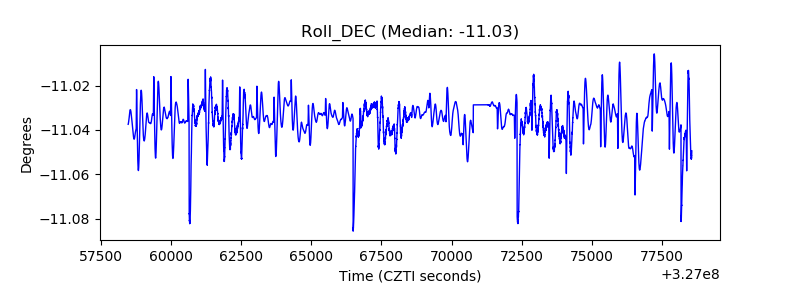 |
| _Roll_RA | 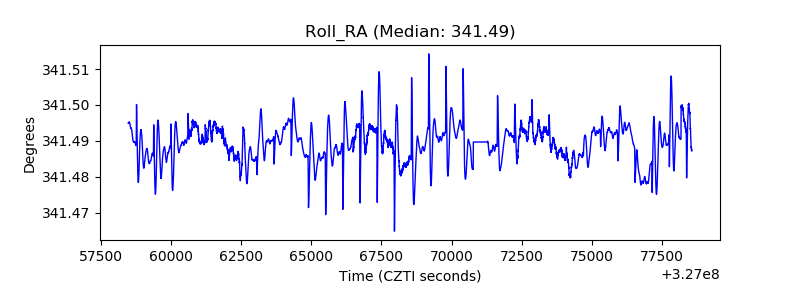 |
| Veto Counter | 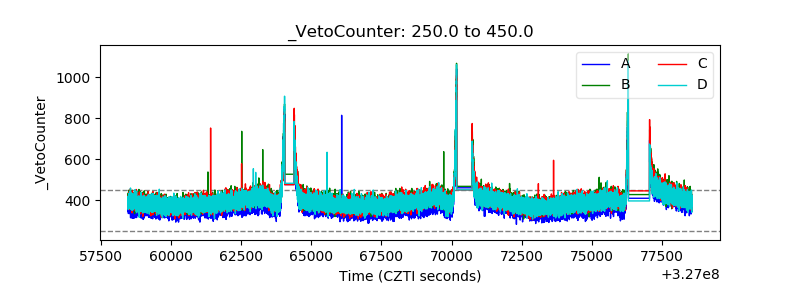 |