| Param | Original file | Final file |
|---|---|---|
| Filename | modeM0/AS1A07_127T03_9000003662_25009cztM0_level2.evt | modeM0/AS1A07_127T03_9000003662_25009cztM0_level2_quad_clean.evt |
| Size (bytes) | 205,957,440 | 22,187,520 |
| Size | 196.4 MB | 21.2 MB |
| Events in quadrant A | 1,475,151 | 118,067 |
| Events in quadrant B | 1,493,142 | 119,085 |
| Events in quadrant C | 1,560,562 | 111,294 |
| Events in quadrant D | 1,505,352 | 111,501 |
| Mode M0 | |||
|---|---|---|---|
| Quadrant | BADHDUFLAG | Total packets | Discarded packets |
| A | 0 | 6208 | 1 |
| B | 0 | 6254 | 1 |
| C | 0 | 6506 | 1 |
| D | 0 | 6299 | 1 |
| Mode SS | |||
|---|---|---|---|
| Quadrant | BADHDUFLAG | Total packets | Discarded packets |
| A | 0 | 60 | 0 |
| B | 0 | 60 | 0 |
| C | 0 | 60 | 0 |
| D | 0 | 60 | 0 |
| Mode M9 | |||
|---|---|---|---|
| Quadrant | BADHDUFLAG | Total packets | Discarded packets |
| A | 0 | 5 | 0 |
| B | 0 | 6 | 0 |
| C | 0 | 6 | 0 |
| D | 0 | 6 | 0 |
| Quadrant | Total seconds | Saturated seconds | Saturation percentage |
|---|---|---|---|
| A | 2958 | 15 | 0.507099% |
| B | 2958 | 8 | 0.270453% |
| C | 2958 | 29 | 0.980392% |
| D | 2958 | 3 | 0.101420% |
Noise dominated data is calculated using 1-second bins in cleaned event files. If a bin has >2000 counts, and if more than 50% of those come from <1% of pixels, then it is considered to be noise-dominated and hence unusable.
| Quadrant | # 1 sec bins | Bins with >0 counts | Bins with >2000 counts | High rate bins dominated by noise | Noise dominated (total time) | Noise dominated (detector-on time) | Marked lightcurve |
|---|---|---|---|---|---|---|---|
| A | 2958 | 2958 | 0 | 0 | 0.00% | 0.00% | 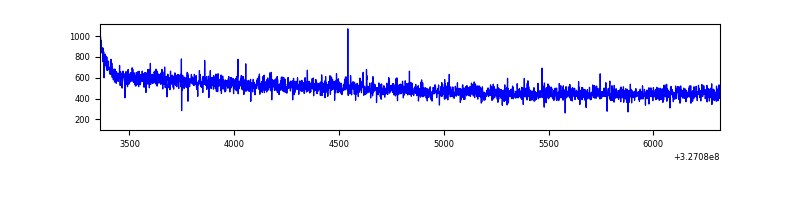 |
| B | 2958 | 2958 | 1 | 1 | 0.03% | 0.03% | 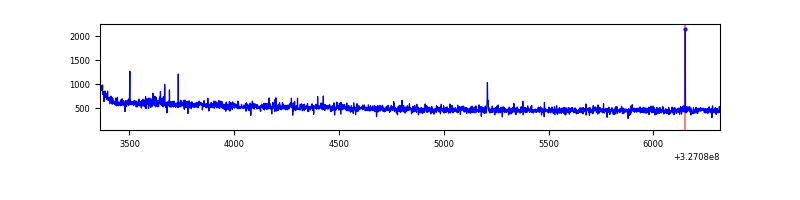 |
| C | 2958 | 2958 | 0 | 0 | 0.00% | 0.00% | 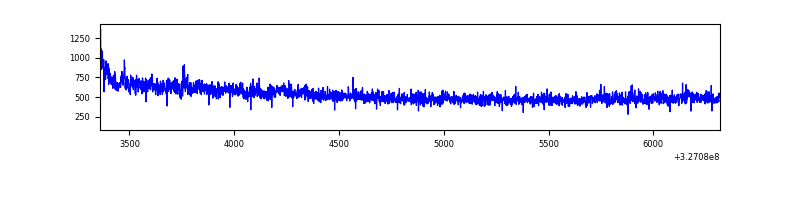 |
| D | 2958 | 2958 | 0 | 0 | 0.00% | 0.00% | 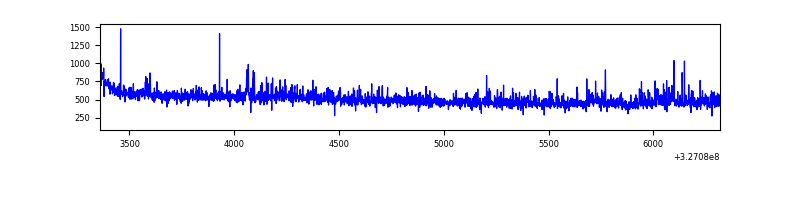 |
Top three noisy pixels from each quadrant. If the there are fewer than three noisy pixels in the level2.evt file, extra rows are filled as -1
| Pixel properties | Quadrant properties | ||||||
|---|---|---|---|---|---|---|---|
| Quadrant | DetID | PixID | Counts | Sigma | Mean | Median | Sigma |
| A | 13 | 254 | 4468 | 52.28 | 382 | 375 | 78.3 |
| A | 3 | 137 | 3497 | 39.87 | 382 | 375 | 78.3 |
| A | 0 | 226 | 3323 | 37.65 | 382 | 375 | 78.3 |
| B | 0 | 190 | 9732 | 126.42 | 377 | 369 | 74.1 |
| B | 12 | 111 | 8458 | 109.22 | 377 | 369 | 74.1 |
| B | 11 | 111 | 7843 | 100.92 | 377 | 369 | 74.1 |
| C | 7 | 247 | 79062 | 917.53 | 361 | 364 | 85.8 |
| C | 14 | 238 | 59078 | 684.54 | 361 | 364 | 85.8 |
| C | 3 | 233 | 13939 | 158.27 | 361 | 364 | 85.8 |
| D | 8 | 195 | 91842 | 1000.37 | 369 | 358 | 91.5 |
| D | 2 | 234 | 13301 | 141.53 | 369 | 358 | 91.5 |
| D | 1 | 52 | 10915 | 115.44 | 369 | 358 | 91.5 |
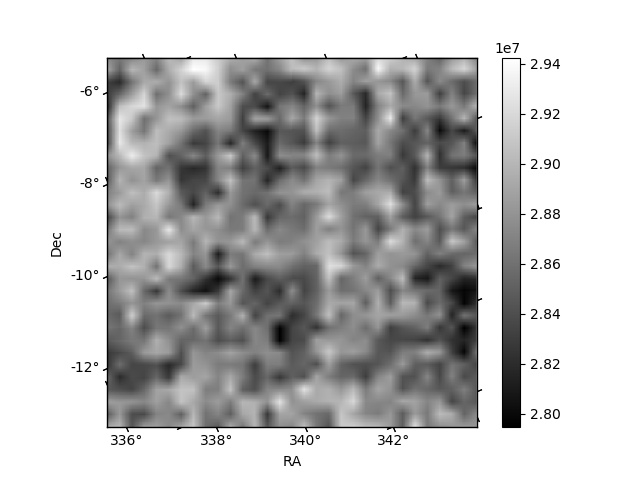
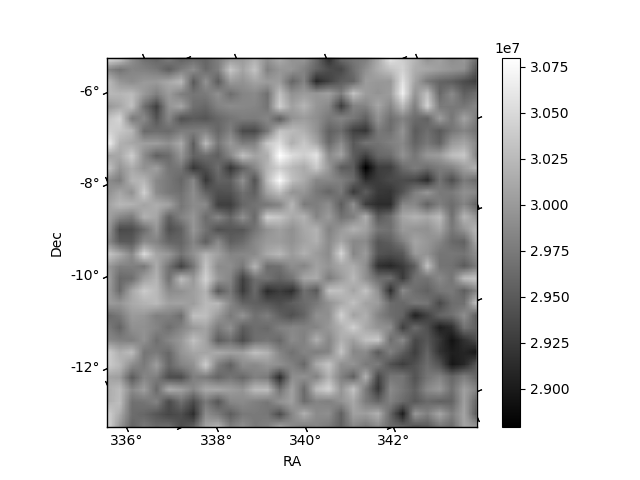
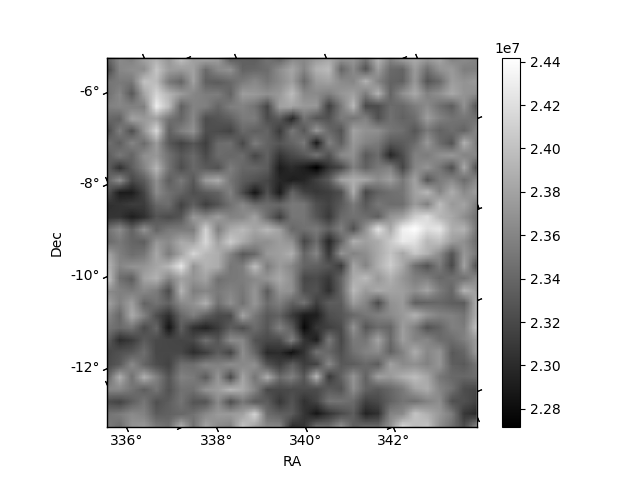
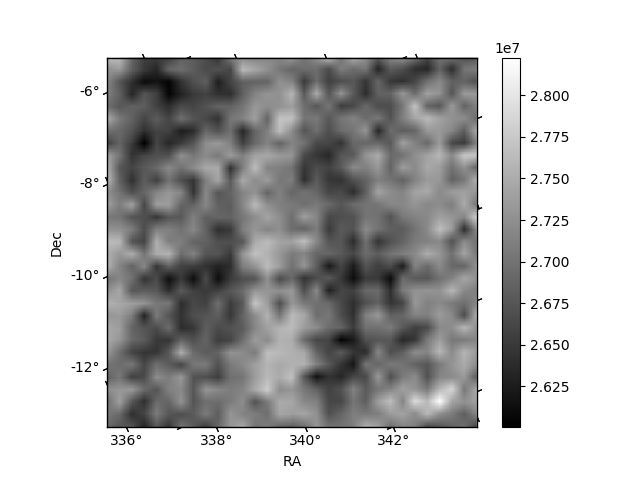
Histogram calculated using DETX and DETY for each event in the final _common_clean file
| Quadrant A | 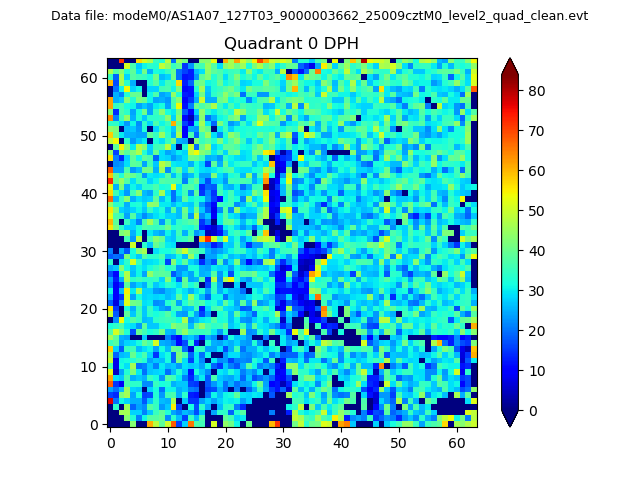 |
 |
Quadrant B |
|---|---|---|---|
| Quadrant D | 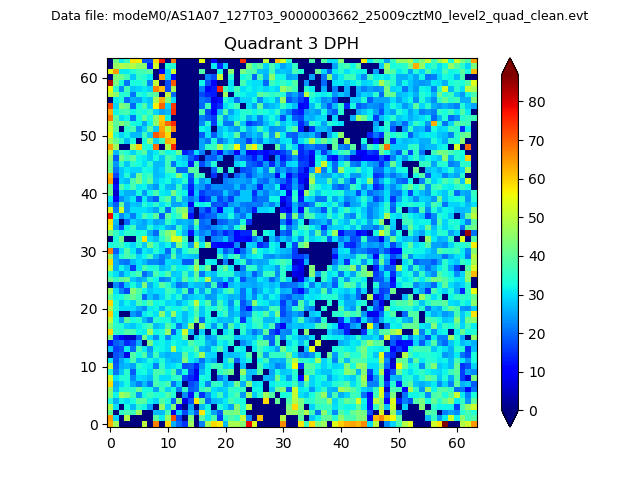 |
 |
Quadrant C |
| Plot type | Count rate plots | Images |
|---|---|---|
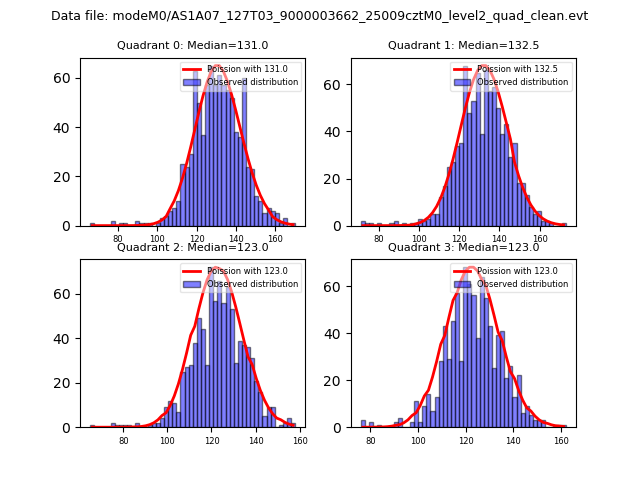
| Comparison with Poisson distribution Blue bars denote a histogram of data divided into 1 sec bins. Red curve is a Poisson curve with rate = median count rate of data. |
 |
 |
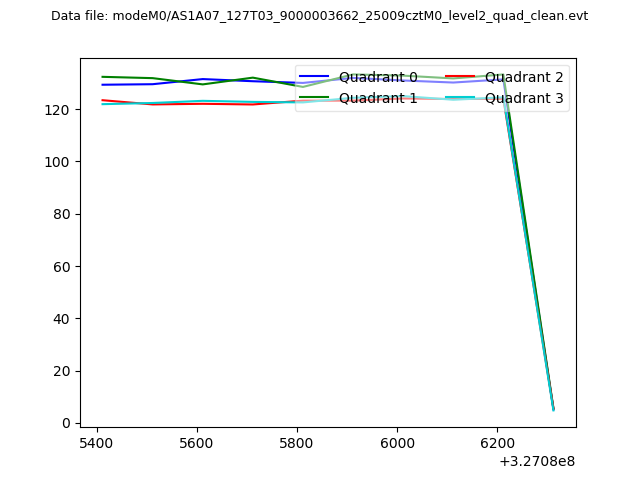
| Quadrant-wise count rates Data is divided into 100 sec bins |
 |
|
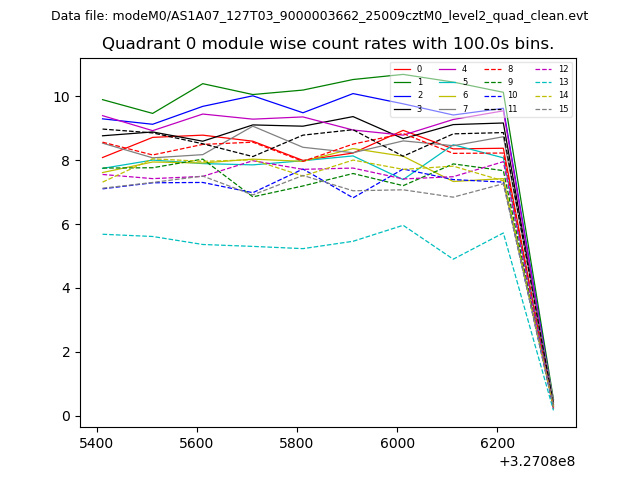
| Module-wise count rates for Quadrant A Data is divided into 100 sec bins |
 |
 |
| Module-wise count rates for Quadrant B Data is divided into 100 sec bins |
 |
 |
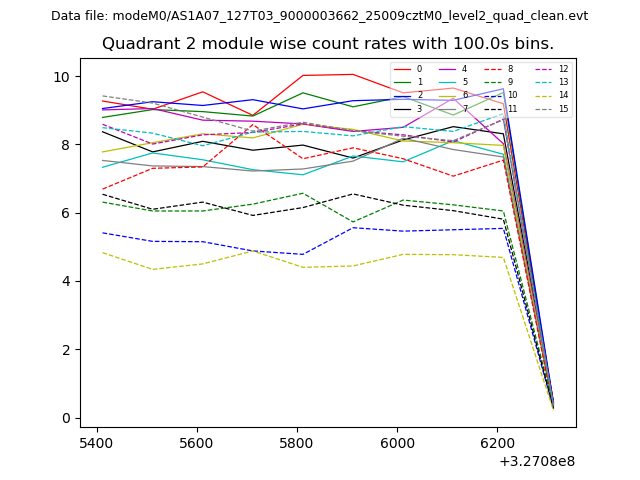
| Module-wise count rates for Quadrant C Data is divided into 100 sec bins |
 |
 |
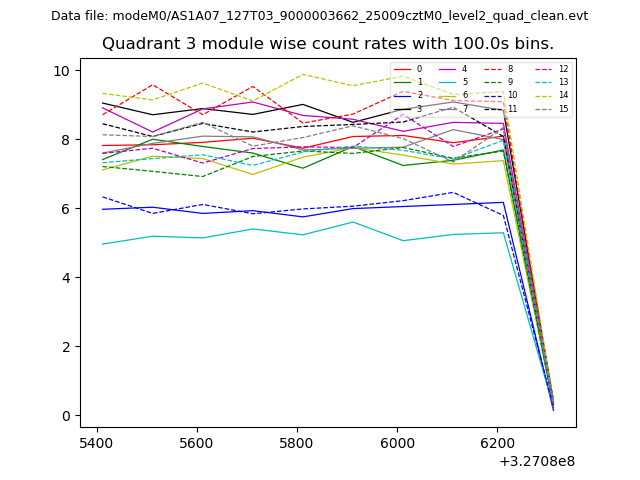
| Module-wise count rates for Quadrant D Data is divided into 100 sec bins |
 |
 |
| Parameter | Plot |
|---|---|
| CZT HV Monitor | 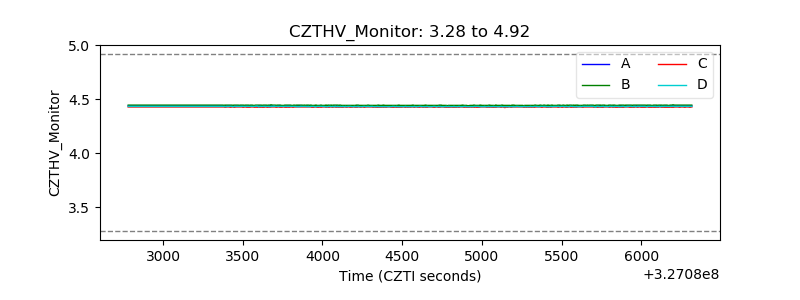 |
| D_VDD | 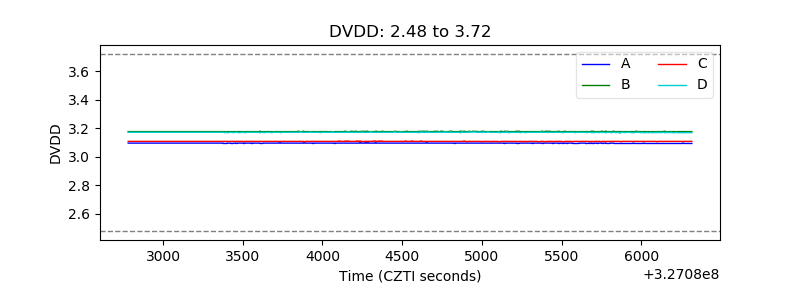 |
| Temperature 1 | 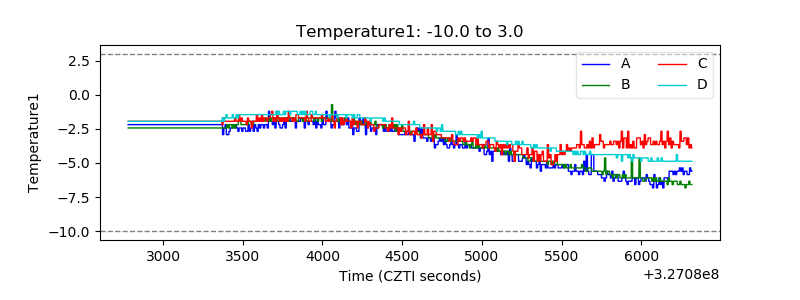 |
| Veto HV Monitor | 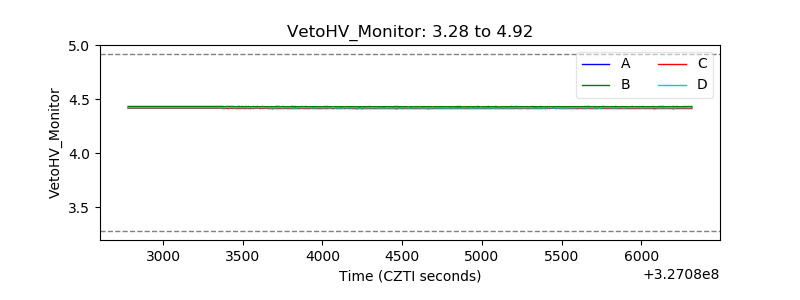 |
| Veto LLD |  |
| Alpha Counter | 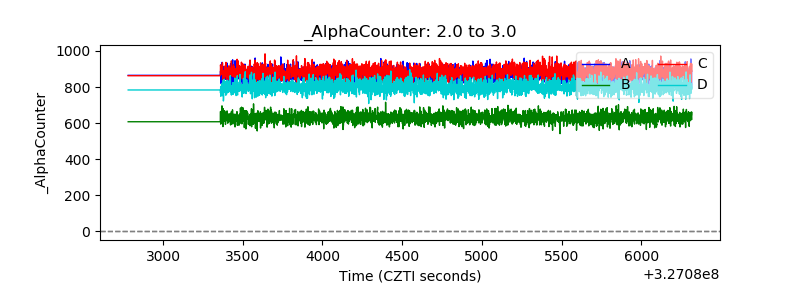 |
| _CPM_Rate | 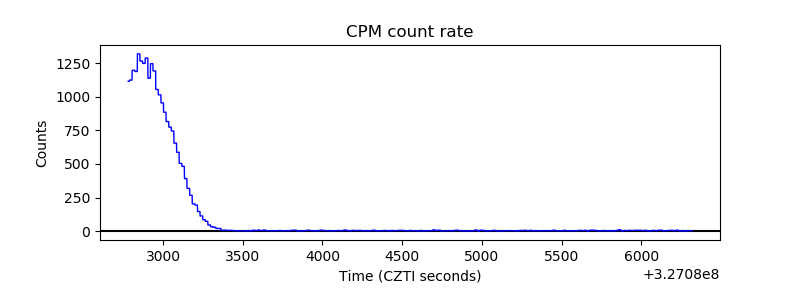 |
| CZT Counter | 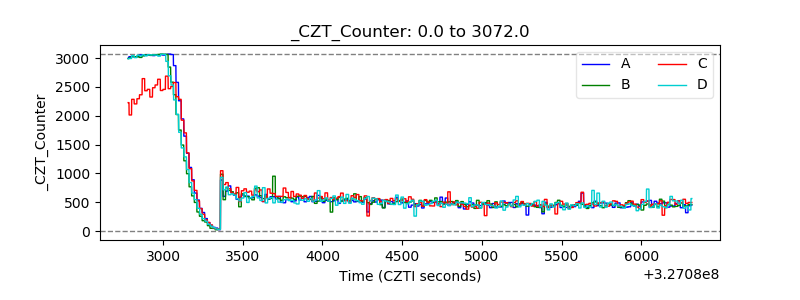 |
| +2.5 Volts monitor |  |
| +5 Volts monitor |  |
| _ROLL_ROT | 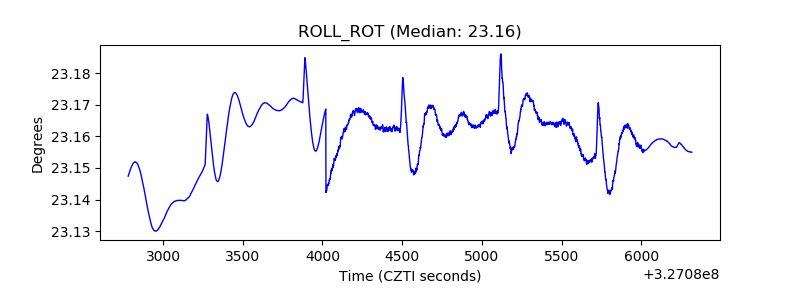 |
| _Roll_DEC | 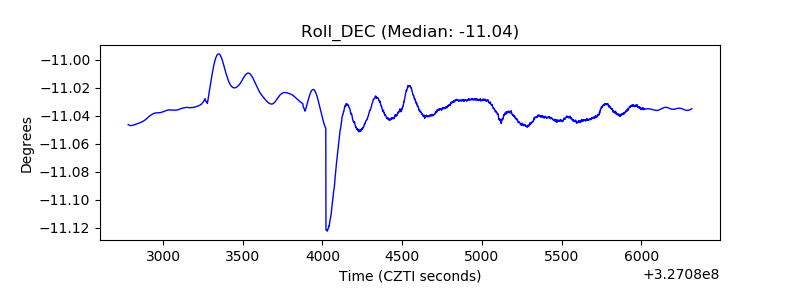 |
| _Roll_RA | 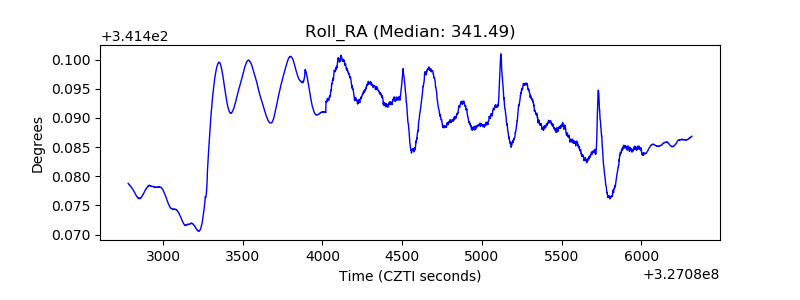 |
| Veto Counter | 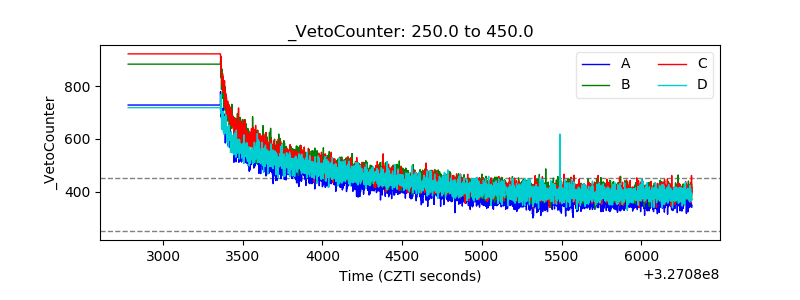 |