| Param | Original file | Final file |
|---|---|---|
| Filename | modeM0/AS1C05_013T04_9000003660cztM0_level2.fits | modeM0/AS1C05_013T04_9000003660cztM0_level2_quad_clean.evt |
| Size (bytes) | 71,049,600 | 58,461,120 |
| Size | 67.8 MB | 55.8 MB |
| Events in quadrant A | 434,038 | 326,130 |
| Events in quadrant B | 417,038 | 328,783 |
| Events in quadrant C | 419,510 | 310,552 |
| Events in quadrant D | 362,658 | 285,659 |
| Mode SS | |||
|---|---|---|---|
| Quadrant | BADHDUFLAG | Total packets | Discarded packets |
| A | 0 | 152 | 0 |
| B | 0 | 152 | 0 |
| C | 0 | 152 | 0 |
| D | 0 | 152 | 0 |
| Mode M0 | |||
|---|---|---|---|
| Quadrant | BADHDUFLAG | Total packets | Discarded packets |
| A | 0 | 15599 | 0 |
| B | 0 | 15711 | 0 |
| C | 0 | 16359 | 0 |
| D | 0 | 18381 | 0 |
| Mode M9 | |||
|---|---|---|---|
| Quadrant | BADHDUFLAG | Total packets | Discarded packets |
| A | 0 | 3 | 0 |
| B | 0 | 3 | 0 |
| C | 0 | 3 | 0 |
| D | 0 | 3 | 0 |
| Quadrant | Total seconds | Saturated seconds | Saturation percentage |
|---|---|---|---|
| A | 7446 | 298 | 4.002149% |
| B | 7446 | 283 | 3.800698% |
| C | 7446 | 242 | 3.250067% |
| D | 7446 | 320 | 4.297609% |
Noise dominated data is calculated using 1-second bins in cleaned event files. If a bin has >2000 counts, and if more than 50% of those come from <1% of pixels, then it is considered to be noise-dominated and hence unusable.
| Quadrant | # 1 sec bins | Bins with >0 counts | Bins with >2000 counts | High rate bins dominated by noise | Noise dominated (total time) | Noise dominated (detector-on time) | Marked lightcurve |
|---|---|---|---|---|---|---|---|
| A | 7801 | 7447 | 0 | 0 | 0.00% | 0.00% |  |
| B | 7801 | 7446 | 0 | 0 | 0.00% | 0.00% |  |
| C | 7801 | 7446 | 0 | 0 | 0.00% | 0.00% |  |
| D | 7801 | 7446 | 0 | 0 | 0.00% | 0.00% |  |
Top three noisy pixels from each quadrant. If the there are fewer than three noisy pixels in the level2.evt file, extra rows are filled as -1
| Pixel properties | Quadrant properties | ||||||
|---|---|---|---|---|---|---|---|
| Quadrant | DetID | PixID | Counts | Sigma | Mean | Median | Sigma |
| A | 0 | 29 | 469 | 12.21 | 112 | 105 | 29.8 |
| A | 14 | 188 | 447 | 11.47 | 112 | 105 | 29.8 |
| A | 14 | 204 | 420 | 10.56 | 112 | 105 | 29.8 |
| B | 2 | 9 | 318 | 8.94 | 110 | 105 | 23.8 |
| B | 2 | 245 | 290 | 7.77 | 110 | 105 | 23.8 |
| B | 14 | 254 | 284 | 7.52 | 110 | 105 | 23.8 |
| C | 12 | 241 | 321 | 7.3 | 110 | 103 | 29.9 |
| C | 12 | 242 | 304 | 6.73 | 110 | 103 | 29.9 |
| C | 3 | 126 | 279 | 5.89 | 110 | 103 | 29.9 |
| D | 7 | 3 | 287 | 6.62 | 103 | 93 | 29.3 |
| D | 4 | 246 | 276 | 6.24 | 103 | 93 | 29.3 |
| D | 3 | 14 | 274 | 6.18 | 103 | 93 | 29.3 |
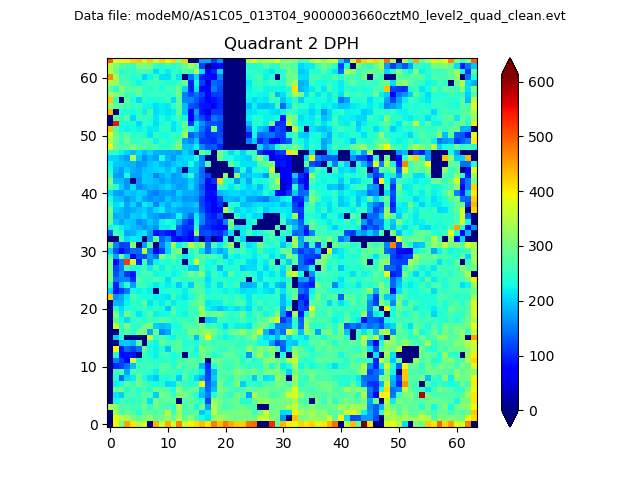
Histogram calculated using DETX and DETY for each event in the final _common_clean file
| Quadrant A |  |
 |
Quadrant B |
|---|---|---|---|
| Quadrant D |  |
 |
Quadrant C |
| Plot type | Count rate plots | Images |
|---|---|---|
| Comparison with Poisson distribution Blue bars denote a histogram of data divided into 1 sec bins. Red curve is a Poisson curve with rate = median count rate of data. |
 |
 |
| Quadrant-wise count rates Data is divided into 100 sec bins |
 |
|
| Module-wise count rates for Quadrant A Data is divided into 100 sec bins |
 |
 |
| Module-wise count rates for Quadrant B Data is divided into 100 sec bins |
 |
 |
| Module-wise count rates for Quadrant C Data is divided into 100 sec bins |
 |
 |
| Module-wise count rates for Quadrant D Data is divided into 100 sec bins |
 |
 |
| Parameter | Plot |
|---|---|
| CZT HV Monitor | 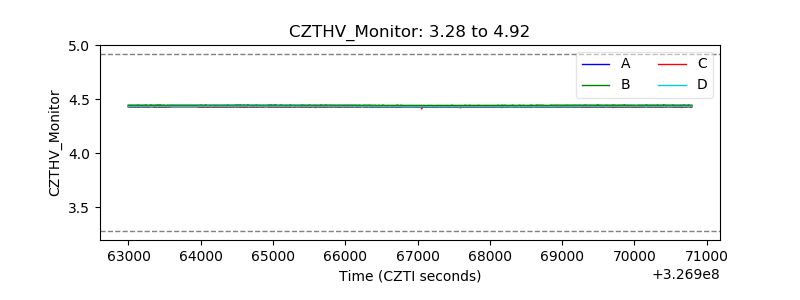 |
| D_VDD | 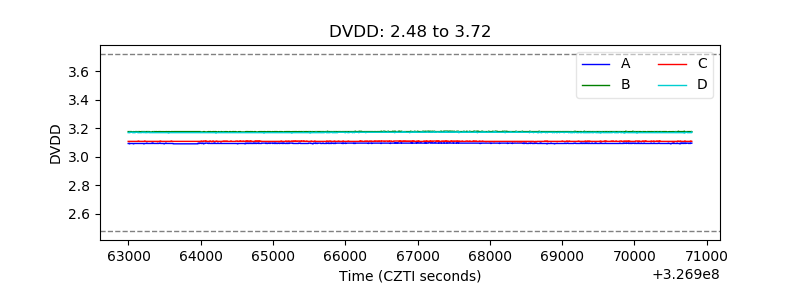 |
| Temperature 1 |  |
| Veto HV Monitor |  |
| Veto LLD |  |
| Alpha Counter | 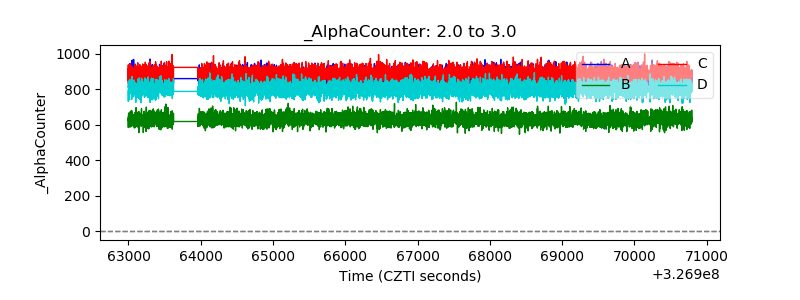 |
| _CPM_Rate | 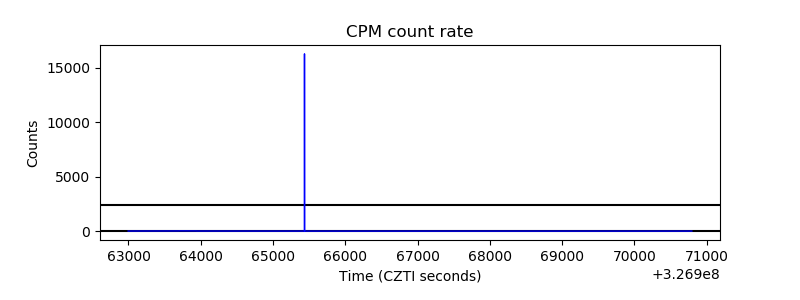 |
| CZT Counter |  |
| +2.5 Volts monitor |  |
| +5 Volts monitor |  |
| _ROLL_ROT |  |
| _Roll_DEC | 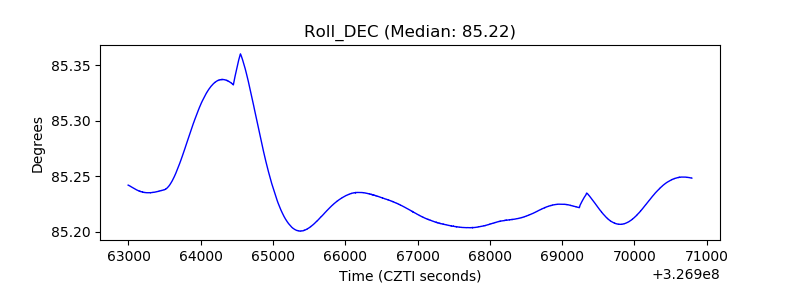 |
| _Roll_RA |  |
| Veto Counter |  |